

Abstract
Reduction of volume and neuronal number has been found in several association nuclei of the thalamus in schizophrenic subjects. Recent evidence suggests that schizophrenic patients exhibit abnormalities in early visual processing and that many of the observed perceptual deficits are consistent with dysfunction of the magnocellular pathway, i.e. the visual relay from peripheral retinal cells to the two ventrally located magnocellular layers of the lateral geniculate nucleus (LGN). The present study was undertaken to determine whether abnormalities in cell number and volume of the LGN are associated with schizophrenia and whether the structural alterations are restricted to either the magnocellular or parvocellular subdivisions of the LGN. Series of Nissl-stained sections spanning the LGN were obtained from 15 schizophrenic and 15 normal control subjects. The optical disector/fractionator sampling method was used to estimate total neuronal number, total glial number and volume of the magnocellular and parvocellular subdivisions of the LGN. Cell number and volume of the LGN in schizophrenic subjects were not abnormal. Volume of both parvocellular and magnocellular layers of the LGN decreased with age. These findings do not support the hypothesis that early visual processing deficits are due to reduction of neuronal number in the LGN.
Keywords: vision, magnocellular, parvocellular, postmortem, human, aging
1. Introduction
The lateral geniculate nucleus (LGN) of the thalamus is the major target of retinal ganglion cells and relays visual information from the contralateral visual field to the primary visual cortex. The LGN is comprised of six cellular layers, i.e., two magnocellular layers lying ventrally and four parvocellular layers located dorsally, as well as cell-sparse intralaminar layers and a cell-poor superficial layer that is ventral to the magnocellular layers. Parvocellular layers transmit information about color and object form from the fovial retina to the visual cortex whereas magnocellular layers carry retinal signals from peripheral retinal cells that are involved in spatial recognition and motion detection (Lennie, 1980; Kaplan and Shapley, 1988; Livingston and Hubel, 1988). The magnocellular and parvocellular pathways correspond loosely to the transient and sustained channels of visual processing that have been derived from psychophysical experimentation in human subjects (Breitmeyer, 1992). These pathways travel in parallel through the LGN but interact at the level of the primary visual cortex and in subsequent relays through the dorsal and ventral visual streams. Thus, although the magnocellular and parvocellular pathways project primarily into the dorsal and ventral visual streams, respectively, these functionally distinct visual streams represent an integrated signal from the two LGN pathways that encodes object localization (dorsal) and object recognition (ventral).
The most prominent symptoms of schizophrenia are thought disorder, psychosis, and cognitive dysfunction (for review, see Carpenter and Buchanan, 1994). Somewhat surprisingly, recent evidence suggests that schizophrenic subjects also have subtle deficits in early visual processing (Butler et al., 2001; 2002; Green et al., 2003; Schecter et al., 2003). Moreover, several lines of evidence suggest that perceptual abnormalities associated with schizophrenia may be channel-specific. The majority of findings in schizophrenic subjects suggest that deficits are more prominent in the magnocellular pathway or in the dorsal stream which would also implicate magnocellular processing (Green et al., 1994 a,b; O’Donnell et al., 1996; Cadenhead et al., 1998; Butler et al., 2001; 2005; Doniger et al., 2002; Schecter et al., 2003; Kim et al., 2005;) although some recent evidence implicates the parvocellular pathway in visual processing abnormalities associated with schizophrenia (Butler et al., 2002; Green et al., 2003).
Several abnormalities in structural and neurochemical composition of the visual cortex have emerged despite its inclusion in many studies only as a “control” comparison region for the dorsolateral prefrontal cortex (for review, see Selemon, 2001). These abnormalities include increased neuronal cell packing density (Selemon et al., 1995), decreased expression of synaptophysin protein and mRNA (Perrone-Bizzozero et al., 1996; Eastwood et al., 2000), and decreased expression of RSG4 mRNA, a gene that regulates G-coupled intracellular signaling (Mirnics et al., 2001). All of these findings are consistent with reduced connectivity and diminished synaptic signaling in the visual cortex.
Presently, it is not known whether there are corresponding structural changes in the LGN, and in particular, whether the LGN may have fewer projection neurons in schizophrenic patients in comparison to normal subjects. In vivo neuroimaging studies of schizophrenic subjects have found smaller whole thalamic volume and altered thalamic shape (Ettinger et al., 2001; Gilbert et al., 2001; Csernansky et al., 2004), altered metabolic activity (Buchsbaum et al., 1996 Hazlett et al., 1999) and reduction of volume in subregions or specific nuclei of the thalamus (Andreasen et al., 1994; Byne et al., 2001; Kemether et al., 2003). In addition, postmortem studies of brains from schizophrenic subjects have reported a reduction in total neuronal number and volume of individual thalamic nuclei, e.g., the mediodorsal, anterior, pulvinar and ventral lateral posterior nuclei (Pakkenberg, 1990; Popken et al., 2000; Young et al., 2000; Byne et al., 2002; Danos et al., 2002; 2003). It should be noted, however, that several studies have not found evidence of thalamic pathology in schizophrenic subjects (Portas et al., 1998; Arciniegas et al., 1999; Deicken et al., 2002; Cullen et al., 2003; Dorph-Petersen et al., 2004; Preuss et al., 2005). Moreover, all of the thalamic nuclei that have been implicated in schizophrenia are reciprocally connected with higher association cortices; therefore, it is not clear whether thalamic neuronal deficits in schizophrenia extend to sensory thalamic nuclei, such as the LGN.
The present study was undertaken to determine whether subjects with schizophrenia had an altered number of neurons or glia in the LGN and whether, if structural differences were found, the pathology would be limited to either the parvocellular or magnocellular subdivisions of the LGN.
2. Methods
2.1 Brains and Histology
Thirty brains from the Stanley Foundation Consortium Collection, 15 schizophrenic and 15 matched normal control brains, were examined in this study (Table 1). Schizophrenic patients were diagnosed by retrospective review of medical records using DSM-IV criteria by two senior psychiatrists associated with the Stanley Foundation. A detailed description of donor selection has previously been reported (Torrey et al., 2000). Normal control subjects did not have a history of psychiatric or neurologic illness, and all brains included in this study were free of major pathology.
Table 1.
Subject Demographics*
| Normal subjects (N=15) | Schizophrenic subjects (N=15) | Student’s T-test | |
|---|---|---|---|
| Gender | 9M/6F | 9M/6F | |
| Age | 48.07 ± 10.66 | 44.53 ± 13.11 | t1,28= 0.810, P= 0.425 |
| PMI | 23.73 ± 9.95 | 33.80 ± 14.55 | t1,28= −2.212, P= 0.035 |
| TF | 338.27 ± 234.32 | 620.73 ± 233.11 | t1,28= −3.310, P= 0.003 |
| Brain wt | 1501.00 ± 164.12 | 1471.67 ± 110.89 | t1,28= 0.578, P= 0.568 |
| pH | 6.18 + 0.25 | 6.16 + 0.26 | t1,28=1.175, P=0.250 |
| Hemisphere | 8R/7L | 9R/6L |
means ± SD
PMI = postmortem interval in hours
TF = storage time in formalin in days
Brain wt = brain weight in grams
Histological processing of the thalamus was performed by the Stanley Foundation and Dr. Dwight German’s laboratory, University of Texas, Southwestern, as follows. Large blocks containing the entire thalamus were dissected and embedded in paraffin. The blocks were subsequently deparaffinized, frozen, and sectioned coronally at 60 μm. A 1 in 16 series of sections was mounted on slides and Nissl stained. Sections were coded by the Stanley Foundation.
2.2 Stereologic analysis of total number and volume
The total number of neurons and glia in the parvocellular and magnocellular subdivisions of the LGN was estimated using the optical disector method (Gundersen et al., 1988). Systematic, random sampling of the LGN was achieved by sampling every 16th section through the entire LGN and then applying the fractionator method of sampling (Gundersen et al., 1988). Note that the first section containing the LGN essentially represented a random start for this nucleus since the 1 in 16 series extended throughout the entire thalamus. All analyses were performed blind to diagnostic status by a single observer (AB).
Stereologic analyses were conducted by viewing the sections on a Zeiss Axioskop microscope which had been fitted with an integrated, computer-guided microscopy system and Stereo Investigator (ver. 5.05) software (MicroBrightfiled, Williston, VT). Prior to the actual analysis, optimal parameters for counting box size and sampling grid spacing were determined. Section thickness was measured on slide as ranging from 10–16 μm. Thus, a counting box dimension of 58 (l) × 50 (w) × 6 (h) μm was chosen to maximize the size of the box but still allow for ≥2 μm guard zones at the top and bottom of the section. A pilot study was then performed to determine the grid spacing for the parvocellular and magnocellular subdivisions that would yield a sampling coefficient of error (CE) ≤ 0.05 for each area (Gunderson et al., 1987). Optimal sampling grid sizes were 350 × 275 μm for the magnocellular layers and 600 × 400 μm for the parvocellular layers.
In each section, the contours of magnocellular and parvocellular layers were traced at low power under a 2.5X objective. The borders of parvocellular and magnocellular layers were distinguished from the intralaminar layers and surrounding thalamus by the presence of large (parvocellular) and larger (magnocellular) neurons. The interlaminar space was not included in the contours and therefore intralaminar neurons and glia were not counted. Sections were then examined under a high power, 100x oil immersion objective. Neurons containing a nucleolus that was in focus inside the counting box were counted; glia nuclei inside the box were counted as well. Neurons were distinguished from glia on the basis of morphologic characteristics of the nucleus including clumping of chromatin and sharper delineation of the nuclear membrane in glia as illustrated previously (Selemon et al., 1999). To ensure that neurons and glia were not overcounted, three exclusion planes were used: cells crossing the left, front and bottom surfaces of the box were not counted. The Stereo Investigator software program also generated an estimated volume for each of the LGN subdivisions (reported here). Volume of the parvocellular and magnocellular subdivisions was also measured using the Cavalieri method. Agreement between the two methods was very good as shown by high intraclass correlation coefficients (ICCs) for both parvocellular (0.95) and magnocellular layers (0.94).
Recounts of the magnocellular layers in all 30 cases to assess the reliability of the counts yielded the following ICCs: neuronal number (0.97), glial number (0.86), and volume (0.93). ICCs for recounts of the parvocellular layers in 7/30 cases were excellent: neuronal number (0.97), glial number (0.97), and volume (0.96).
2.3 Statistical Analyses
Statistical analyses were used to test the hypothesis that total number of neurons, total number of glia, and/or volume of the LGN differed between schizophrenic subjects and normal comparison subjects. Data were tested for normality prior to analysis using Kolmogorov-Smirnov test statistics, and normality was confirmed. Mixed models were used to evaluate each outcome. All analyses were considered statistically significant at P< 0.02 after application of a Bonferroni correction for multiple tests. Data were analyzed using SAS, ver. 9.1 (SAS Institute Inc., Cary, NC). Data are presented as mean ± standard deviation of the mean.
In the primary analysis, in which all subjects were included, neuronal number, glial number and volume represented the dependent variables, group (control subjects, schizophrenic subjects) and gender were included as between-subject effects, and region (parvocellular, magnocellular) was included as a within-subject explanatory factor. Subject was used as the clustering factor. All 2- and 3-way interaction effects were tested. Age, postmortem interval (PMI), storage time in formalin (TF), and brain weight were considered as potential covariates in the models. Age was significantly associated (inversely) with volume (F1,24=15.3, P= 0.007) but not with the other outcomes (P> 0.41 for neuronal number and P> 0.06 for glial number) and therefore was retained as a covariate in the model for analysis of volume. Although brain weight was not significantly associated with any of the variables (P> .49 for all), analyses were performed covarying for brain weight. Similar results were found for secondary analyses.
In secondary analyses, subjects were limited to (1) brain samples from left hemispheres (7 control subjects, 6 schizophrenic subjects), (2) brain samples from right hemispheres (8 control subjects, 9 schizophrenic subjects) (3) subjects without alcohol/abuse scores above 3 (15 control subjects, 10 schizophrenic subjects), (4) schizophrenic subjects that committed suicide and controls (15 control subjects 4 schizophrenic subjects), and (5) non-suicidal schizophrenic subjects and controls (15 control subjects, 11 schizophrenic subjects). As one LGN from a schizophrenic subject spanned fewer coronal sections that all other brains (see Results), all analyses were repeated with the exclusion of this case.
3. Results
3.1 Qualitative observations
The LGN was present in 7–9 coronal sections (Fig. 1), approximately 910 μm apart, and thus spanned 6.7–8.6 mm in the anterior-posterior axis. The only exception was one schizophrenic brain that only spanned 4 coronal sections. Not all 4 parvocellular and 2 magnocellular layers were visible in all sections, and the parvocellular layers often appeared to be fused along a portion of their dorso-ventral boundaries (Fig. 2). Neurons in the parvocellular subdivision were oblong or triangular in shape (Fig. 3A); magnocellular neurons were similarly shaped but larger (Fig. 3B). Both parvocellular and magnocellular neurons featured a pale nucleus with a prominent nucleolus. Glia were easily distinguished from neurons by their small, round dark profiles (Fig. 3A,B).
Figure 1.
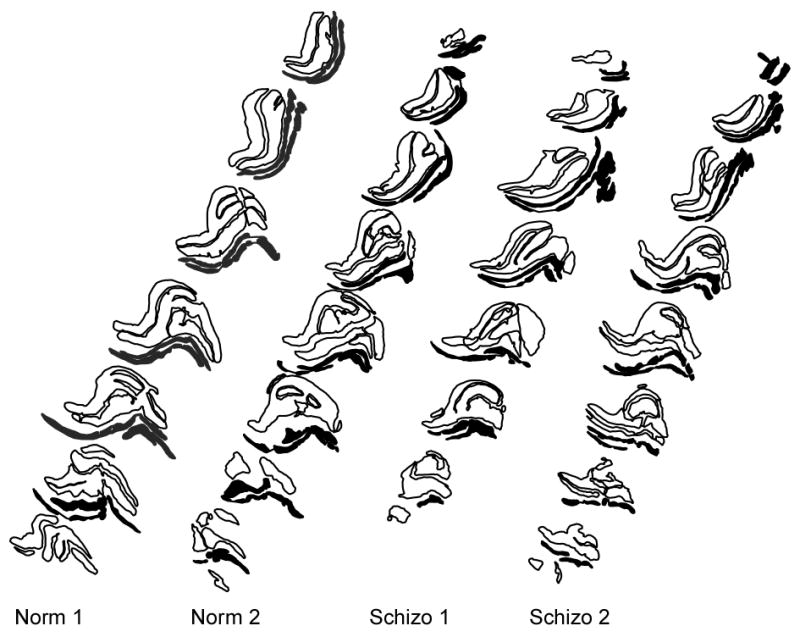
Representative contour drawings of the LGN showing parvocellular layers (black outlines) and magnocellular layers (solid black) from two normal comparison brains (Norm1, Norm2) and two schizophrenic brains (Schizo1, Schizo2).
Figure 2.
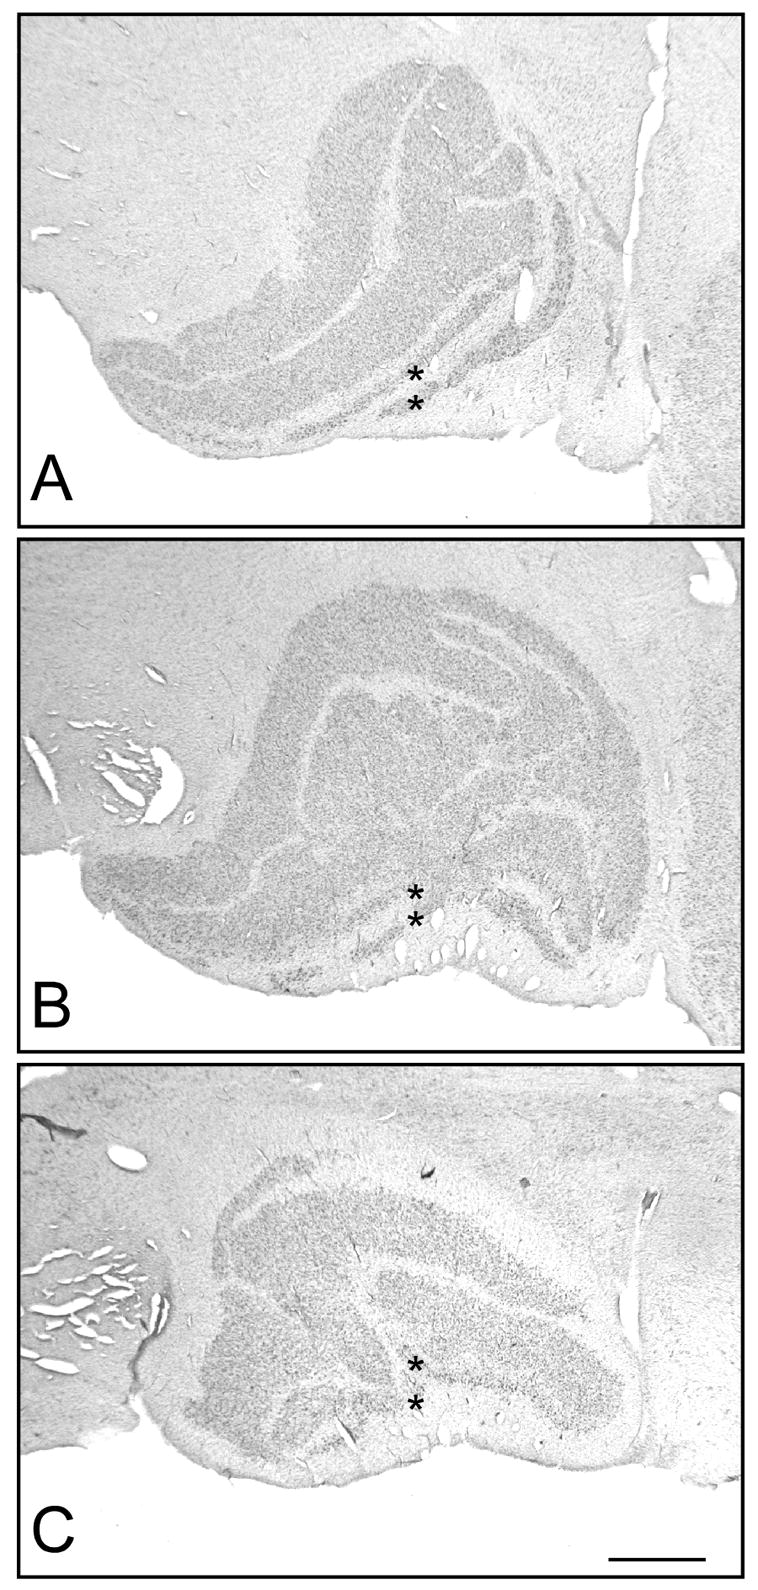
Low power photomicrographs of the LGN. Three representative sections through the (A) anterior, (B) middle, and (C) posterior LGN are shown. The LGN is comprised of six cellular layers: two magnocellular layers (marked with asterisks) lying ventrally and four parvocellular layers located dorsally, as well as cell-sparse intralaminar layers and a cell-poor superficial layer that is ventral to the magnocellular layers. Note that not all four parvocellular layers were visible in all sections and that individual layers often appeared to be fused. Scale bar = 1 mm.
Figure 3.
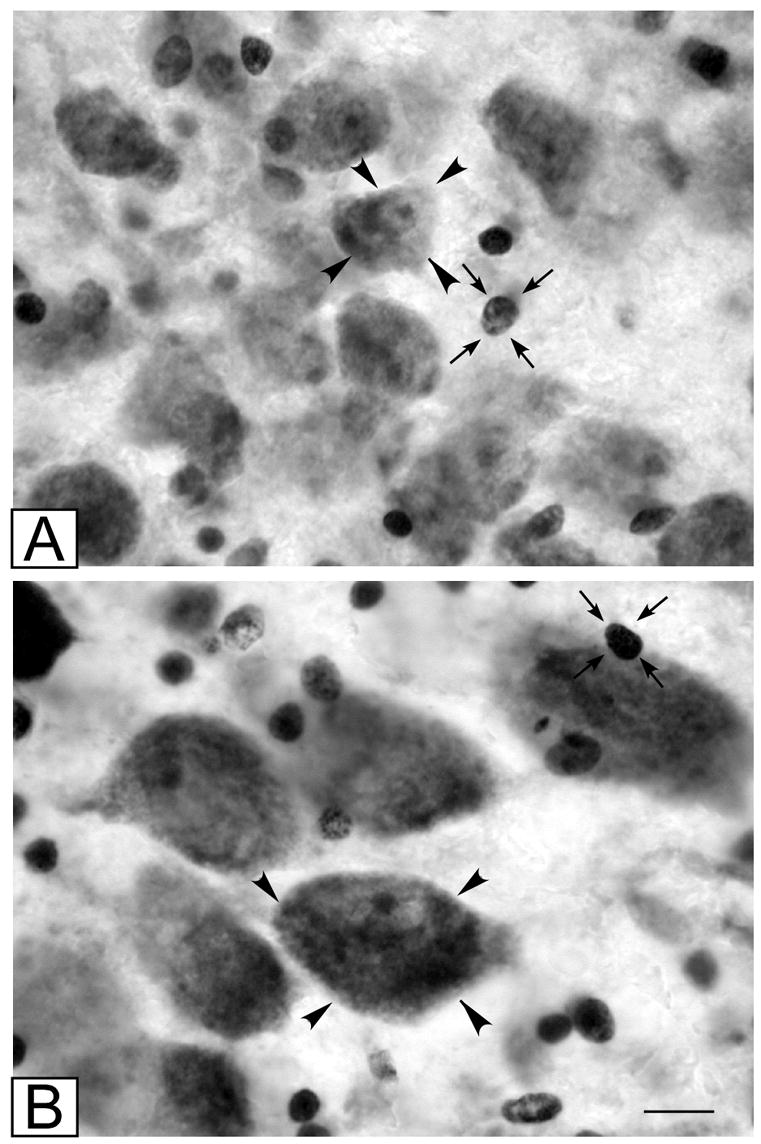
High power photomicrographs of (A) parvocellular and (B) magnocellular subdivisions of the LGN. Typical neurons are indicated by arrowheads; typical glial cells are indicated by small arrows. Scale bar = 10 μm
3.2 Total cell number
The number of profiles counted in each subdivision was as follows: parvocellular neurons, average 1027.00 (range 827–1251); parvocellular glia, average 335.76 (range 231–560); magnocellular neurons, average 502.55 (range 357–662); magnocellular glia, average 335.76 (range 231–560). Estimated total neuronal number and total glial number for the parvocellular and magnocellular divisions of the LGN for schizophrenic and control subjects are shown in Table 2. Statistical analysis of all subjects in the primary analysis indicated that there were no significant group or group interaction effects (P> .23) for neuronal number or glial number in either subdivision of the LGN (Table 2; Fig. 4). Likewise, secondary analyses did not indicate any significant group effects. A significant effect of region on cell number was present in the primary analysis (neuronal number: F1,26= 387.1, P< 0.001; glial number: F1,26= 247.49, P<0.001) and in all secondary analyses. This reflected the fact that the parvocellular layers of the LGN contained five times as many neurons and glia in comparison to the magnocellular layers (Table 2).
Table 2.
Group Means (SD)
| Control Subjects | Schizophrenic Subjects | % Change | Statistics** | |
|---|---|---|---|---|
| Parvocellular | ||||
| Neurons | 2,865,936 (691,183) | 2,955,790 (747,735) | + 3% | F(1,27)=0.03, P=0.86 |
| Glia | 963,574 (273,034) | 863,123 (280.113) | − 10% | F(1,27)=1.95, P=0.17 |
| Volume* | 67.12 (10.71) | 65.42 (14.03) | − 3% | F(1,27)=1.22, P=0.28 |
| Magnocellular | ||||
| Neurons | 536,689 (119,387) | 594,981 (151013) | + 11% | F(1,27)=0.91, P=0.35 |
| Glia | 199.338 (53,479) | 196,947 (53,347) | − 1% | F(1,27)=0.25, P=0.62 |
| Volume* | 12.55 (2.46) | 13.69 (2.85) | + 9% | F(1,27)=0.69, P=0.41 |
in mm3
Based on one-way ANCOVA with age as a covariate
Figure 4.
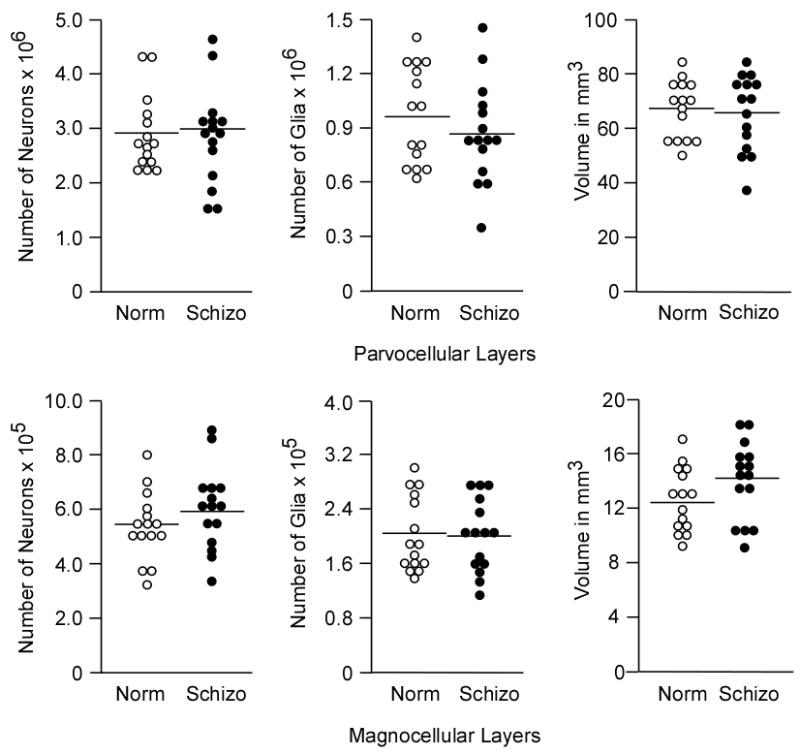
Graphs of total neuronal number, total glial number, and volume in the parvocellular layers (above) and magnocellular layers (below) in normal control subjects (Norm, open circles) and schizophrenic subjects (Schizo, filled circles).
3.3 Volume
Volumes of the parvocellular and magnocellular divisions of the LGN did not differ between groups in the primary analyses (P>.39; Table 2) nor in secondary analyses. There was a significant effect of region on volume (F1,26= 704.24, P<0.001). In addition, age showed a significant effect on volume of both parvocellular and magnocellular layers in the primary analysis (F1,24= 14.95, P<0.001) (Fig. 5) and in all secondary analysis except that limited to the right hemispheres (F1,12= 3.92, P= 0.07). In the secondary analysis limited to left hemispheres, a trend region by gender interaction was found for volume of the LGN (F1,14=6.29, P= 0.025) due to gender differences within the parvocellular region (F1,15= 7.93, P= 0.013). This gender difference, which must be considered preliminary, needs to be replicated in a larger sample of brains.
Figure 5.
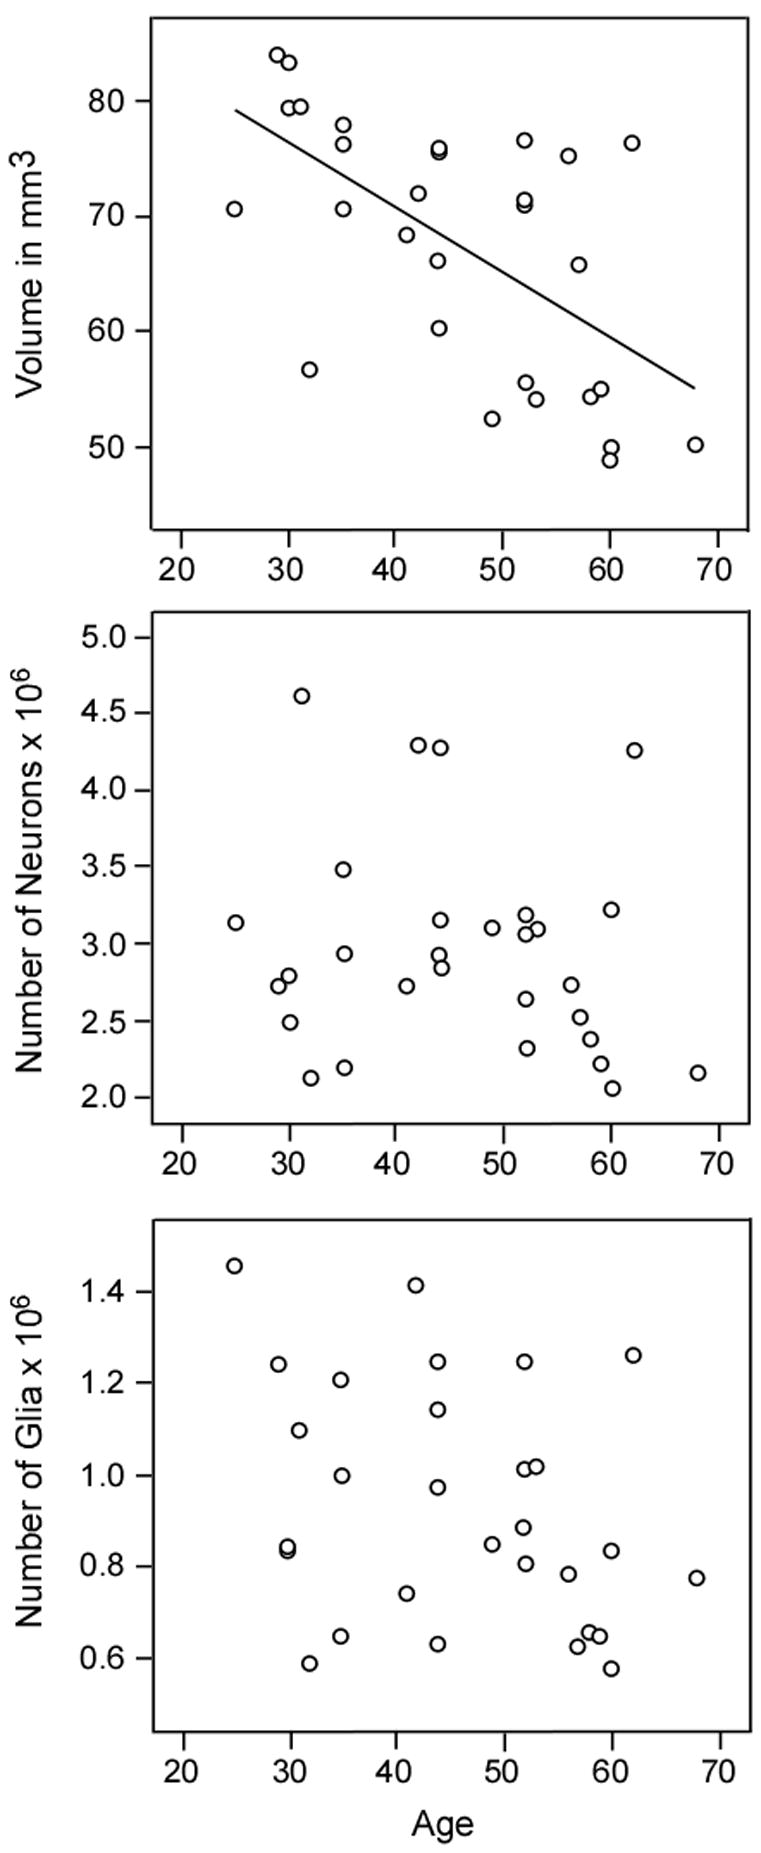
Graphs of correlations between volume and age but not neuronal number of glial number and age in the parvocellular subdivision of the LGN. A similar correlation between volume and age was found for the magnocellular subdivision (not shown).
4. Discussion
4.1 Comparison with stereologic analyses in human and non-human primates
To our knowledge, stereologic analysis of total cell number has not been performed in the adult human LGN prior to the present study. A previous study of adult human LGN volume (Andrews et al., 1997) found larger mean volumes for parvocellular (90.42 mm3) and magnocellular (28.03 mm3) layers than measured in the present study. The discrepancy probably is due to differential shrinkage resulting from differing postmortem processing methodologies in the two studies. The one study of total cell number in the human LGN, which examined only 2 late-gestational fetuses and utilized non-stereologic methods, found total neuronal counts in LGN of 1.68 million (Khan et al., 1993). LGN volume and neuronal number exhibit a high degree (at least two-fold) of variability among individuals (Spear et al., 1996; Andrews et al., 1997, present study) so that any estimate of neuronal number based on two cases might be skewed far from the true mean. Estimates of total cell number based on stereologic methods are independent of measured volume, cell size and section thickness and therefore can more reliably be compared across studies.
Several studies in non-human primates have utilized stereologic cell counting methods to estimate the number of neurons in the normal, young adult LGN either as a control for experimental manipulation (Berman et al., 1998; Boire et al., 2002), development (Willliams and Rakic, 1988), aging (Ahmad and Spear, 1993), or as a primary interest (Sunner and Rakic, 1996; Blasco et al., 1999). Despite differences in methodology and species examined, these studies are generally in agreement in estimating approximately 1.4 million neurons in the whole LGN; neuronal number in the pigtail monkey (1.79 million) was slightly higher (Blasco et al., 1999). In the present study, we estimated approximately 2.5 times as many neurons (3.4 million; range 2.5–5.1 million) in the combined parvocellular and magnocellular subdivisions of the human LGN compared to the non-human primate LGN.
4.2 Comparable cell number in schizophrenic and control subjects
The present study failed to find differences in neuronal or glial cell number in the LGN of schizophrenic subjects in comparison to normal subjects and therefore does not support hypothesis that early visual processing deficits in schizophrenia can be attributed to cell loss in the LGN. As reduction of thalamic volume and neuronal number has been described in several association nuclei of the thalamus, including the mediodorsal, anterior, pulvinar, and ventral lateral posterior nuclei (Pakkenberg, 1990; Popken et al., 2000; Young et al., 2000; Byne et al., 2002; Danos et al., 2002; 2003), one possible explanation for the absence of cell loss in the LGN is that neuronal pathology in schizophrenia is restricted to nuclei with reciprocal connections to higher association cortices. It should be noted, however, that none of the postmortem studies that have described neuronal deficits in schizophrenic patients examined brains from the Stanley Foundation, the cohort that was analyzed in the present study. Therefore, it is also possible that thalamic pathology is not inherent to this particular schizophrenic cohort. Thalamic pathology has not been a universal finding in schizophrenia. Several in vivo imaging and postmortem studies have failed to find abnormalities in thalamic volume or neuronal number in schizophrenic subjects (Portas et al., 1998; Arciniegas et al., 1999; Deicken et al., 2002; Cullen et al., 2003; Dorph-Petersen et al., 2004; Preuss et al., 2005). Moreover, recent neuroimaging analyses of the hippocampus (Csernansky et al., 2002) and thalamus (Csernansky et al., 2004) in the same cohort of schizophrenic subjects has indicated that pathology of one or the other structure may be more pronounced in different individuals (Csernansky, personal communication).
Alterations in glial number were not found in the schizophrenic group in comparison to normal controls. This is somewhat surprising given the prominence of glial abnormalities in the Stanley Foundation cohort uncovered in the prefrontal cortex and hippocampus by proteomic and immunoctyochemical analyses (Johnston-Wilson et al., 2000; Webster et al., 2001). However, we did not distinguish different classes of glial cells, e.g., astrocytes, oligodendrocytes, and microglia, and therefore a selective alteration in one of these morphologic classes might have gone undetected in the present study.
There were no significant differences in volume between schizophrenic and control groups in the present study for either subdivision of the LGN. Mean volume of the magnocellular layers was larger in the schizophrenic cohort than in controls, although the difference was not significant and did not even represent a trend. We attribute the higher mean to variability in the human LGN between individuals and to the fact that this variability was probably exaggerated in the magnocellular LGN because of the small size and convoluted shape of the layers.
4.3 Clinical context of visual deficits in schizophrenia
The present study addressed the question of whether early visual processing deficits are associated with anatomic abnormalities in the LGN. It should be emphasized that visual deficits are not prominent in schizophrenic subjects and in fact have only been manifest with extensive psychophysiologic testing (e.g., Javitt et al., 1993; Renshaw et al., 1994). The cardinal symptoms of schizophrenia, which include thought disorder, positive symptoms of hallucinations and delusions, and negative symptoms such as flattened affect and anhedonia, all involve higher order cognitive and emotional processing circuits (for review, see Carpenter and Buchanan, 1994). Perhaps it is not surprising that anatomic deficits were not detected in the LGN of schizophrenia subjects given that anatomic abnormalities tend to be subtle even in the prefrontal and medial temporal cortices, two brain regions that have been strongly implicated in the pathophysiology of schizophrenia (Selemon, 2001). A number of studies indicate that heteromodal areas of the association cortex, including the prefrontal cortex, are key sites of pathology in the schizophrenic brain (Pearlson et al., 1996; Barch et al., 2001; Selemon, 2001). Thalamic nuclei that are reciprocally connected with heteromodal cortical areas have been shown to be smaller and have fewer neurons in schizophrenic subjects (Pakkenberg, 1990; Popken et al., 2000; Young et al., 2000; Byne et al., 2002; Danos et al., 2002; 2003); however, our analysis suggests that the LGN does not exhibit comparable reductions in volume and neuronal number.
4.4 LGN volume decreases with age
Volume of both subdivisions of the LGN showed a marked inverse correlation with age whereas neuronal and glial numbers were not correlated with age. Although a rather speculative interpretation, these data could indicate that aging is associated with a decrease in the neuropil compartment of the LGN rather than loss of neurons and glia; more direct studies of dendritic architecture and synaptic number are required to validate this interpretation. Since neuropil is comprised of dendrites, axons, synapses and glial processes, decreases in these cellular elements would be consistent with a reduction in neuronal connectivity. Previous morphometric studies of human retinal ganglion cells have found moderate (15–50%), age-related reductions in the number of retinal ganglion cells that were dependent on the distance from the fovea and were highly variable between individuals (Gao and Hollyfield, 1992; Curcio and Drucker 1993). The observed reduction in retinal projection neurons, which is consistent with the proposed loss of neuropil in the LGN, suggests that there may be a reduction in retinal afferent input to the LGN in aged human subjects. There are no other quantitative studies of the aged human LGN for comparison with the present findings, and only one study (Ahmed and Spear, 1993) has examined age-related changes in the non-human primate LGN. In the non-human primate, neuronal and glial numbers were not altered in aged monkeys; however, neuronal density was decreased with age due to a small, non-significant increase in LGN volume and associated neuropil. The latter finding differs from our observation of decreased LGN volume with age in the human and raises the possibility of significant species differences in the aging process. Studies of human visual function in aged subjects have uncovered age-related deficits, e.g., in visual acuity and in spatial and temporal contrast sensitivity, that cannot be attributed to ocular changes (Spear, 1993). The present findings suggest that the structural underpinnings of this age-related visual decline may include reduction of LGN volume.
Stereologic analysis of the LGN in schizophrenic subjects in comparison to normal controls did not uncover evidence of a reduced number of neurons or glia in the diseased subjects. These negative findings do not support the hypothesis that the early visual processing deficits described in schizophrenic subjects are related to reduced neuronal number in the thalamic visual relay nucleus. However, we cannot rule out the possibility that more subtle changes in structural architecture of the LGN might account for the visual abnormalities associated with schizophrenia.
Acknowledgments
We are grateful to the Stanley Foundation, especially Drs. E. Fuller Torrey, Maree J. Webster, Michael B. Knable, Serge Weis, and Robert H. Yolken, and Ms. Beata M. Barci, for procurement, processing, and distribution of brain tissues. We also thank Brian Pittman, M.S., Department of Psychiatry, Yale University, for statistical analysis of the data and Douglas Gelowitz, Ph.D. for early pilot data. This work was supported by grants from the Theodore and Vada Stanley Foundation and the NIMH (Washington University Conte Center, MH 71616).
Footnotes
Publisher's Disclaimer: This is a PDF file of an unedited manuscript that has been accepted for publication. As a service to our customers we are providing this early version of the manuscript. The manuscript will undergo copyediting, typesetting, and review of the resulting proof before it is published in its final citable form. Please note that during the production process errors may be discovered which could affect the content, and all legal disclaimers that apply to the journal pertain.
References
- Ahmad A, Spear PD. Effects of aging on the size, density and number of rhesus monkey lateral geniculate neurons. Journal of Comparative Neurology. 1993;3334:631–643. doi: 10.1002/cne.903340410. [DOI] [PubMed] [Google Scholar]
- Andreasen NC, Arndt S, Swayze V, 2nd, Cizaldo T, Flaum M, O’Leary D, Ehrnardt JC, Yuh WT. Thalamic abnormalities in schizophrenia visualized through magnetic resonance image averaging. Science. 1994;266:294–298. doi: 10.1126/science.7939669. [DOI] [PubMed] [Google Scholar]
- Andrews TJ, Halpern SD, Purves D. Correlated size variations in human visual cortex, lateral geniculate nucleus, and optic tract. The Journal of Neuroscience. 1997;17:2859–2868. doi: 10.1523/JNEUROSCI.17-08-02859.1997. [DOI] [PMC free article] [PubMed] [Google Scholar]
- Arciniegas D, Rojas DC, Teale P, Sheeder J, Sandberg E, Reite M. The thalamus and schizophrenia phenotype: Failure to replicate reduced volume. Biological Psychiatry. 1999;45:1329–1335. doi: 10.1016/s0006-3223(97)00459-9. [DOI] [PubMed] [Google Scholar]
- Barch DM, Carter CS, Braver TS, Sabb FN, MacDonald A, 3rd, Noll DC, Cohen JD. Selective deficits in prefrontal cortex function in medication-naïve patients with schizophrenia. Archives of General Psychiatry. 2001;58:280–288. doi: 10.1001/archpsyc.58.3.280. [DOI] [PubMed] [Google Scholar]
- Berman NEJ, Raymond LA, Warren KA, Raghavan R, Joag SV, Narayan O, Cheney PD. Fractionator analysis shows loss of neurons in the lateral geniculate nucleus of macaques infected with neurovirulent simian immunodeficiency virus. Neuropathology and Applied Neurobiology. 1998;24:44–52. doi: 10.1046/j.1365-2990.1998.00095.x. [DOI] [PubMed] [Google Scholar]
- Blasco B, Avendano C, Cavada C. A stereologic analysis of the lateral geniculate nucleus in adult Macaca nemestrina monkeys. Visual Neuroscience. 1999;16:933–941. doi: 10.1017/s0952523899165131. [DOI] [PubMed] [Google Scholar]
- Boire D, Theoret H, Ptito M. Stereological evaluation of neurons and glia in the monkey dorsal lateral geniculate nucleus following an early cerebral hemispherectomy. Experimental Brain Research. 2002;142:208–220. doi: 10.1007/s00221-001-0921-8. [DOI] [PubMed] [Google Scholar]
- Breitmeyer G. Parallel processing in human vision. History, review, and critique. In: Brannan JR, editor. Applications of parallel processing in vision. North Holland Press; Amsterdam: 1992. pp. 37–78. [Google Scholar]
- Buchsbaum MS, Someya T, Teng CY, Abel L, Chin S, Najafi A, Haier RJ, Wu J, Bunney WE., Jr PET and MRI of the thalamus in never-medicated patients with schizophrenia. American Journal of Psychiatry. 1996;153:191–199. doi: 10.1176/ajp.153.2.191. [DOI] [PubMed] [Google Scholar]
- Butler PD, Schechter I, Zemon V, Schwartz SG, Greenstein VC, Gordon J, Schroeder CE, Javitt DC. Dysfunction of early-stage visual processing in schizophrenia. American Journal of Psychiatry. 2001;158:1126–1133. doi: 10.1176/appi.ajp.158.7.1126. [DOI] [PubMed] [Google Scholar]
- Butler PD, DeSanti LA, Maddox J, Harkavy-Friedman JM, Amador XA, Goetz RR, Javitt DC, Gorman JM. Visual backward-masking deficits in schizophrenia: Relationship to visual pathway function and symptomotology. Schizophrenia Research. 2002;59:199–209. doi: 10.1016/s0920-9964(01)00341-3. [DOI] [PubMed] [Google Scholar]
- Butler PD, Zemon V, Schechter I, Saperstein AM, Hoptman MJ, Lim KO, Revheim N, Silipo G, Javitt DC. Early-stage visual processing and cortical amplification deficits in schizophrenia. Archives of General Psychiatry. 2005;62:495–504. doi: 10.1001/archpsyc.62.5.495. [DOI] [PMC free article] [PubMed] [Google Scholar]
- Byne W, Buchsbaum MS, Kemether E, Hazlett EA, Shinwari A, Mitropoulou V, Siever LJ. Magnetic resonance imaging of the thalamic mediodorsal nucleus and pulvinar in schizophrenia and schizotypal personality disorder. Archives of General Psychiatry. 2001;58:133–140. doi: 10.1001/archpsyc.58.2.133. [DOI] [PubMed] [Google Scholar]
- Byne W, Buchsbaum MS, Mattiace LA, Hazlett EA, Kemether E, Elhakem SL, Purohit DP, Haroutunian V, Jones L. Postmortem assessment of thalamic nuclear volumes in subjects with schizophrenia. American Journal of Psychiatry. 2002;159:59–65. doi: 10.1176/appi.ajp.159.1.59. [DOI] [PubMed] [Google Scholar]
- Cadenhead KS, Swerper Y, Braff DL. Transient versus sustained visual channels in the visual backward masking deficits of schizophrenia patients. Biological Psychiatry. 1998;43:132–138. doi: 10.1016/S0006-3223(97)00316-8. [DOI] [PubMed] [Google Scholar]
- Carpenter WT, Jr, Buchanan RW. Schizophrenia. New England Journal of Medicine. 1994;330:681–690. doi: 10.1056/NEJM199403103301006. [DOI] [PubMed] [Google Scholar]
- Csernansky JG, Wang L, Jones D, Rastogi-Cruz D, Posener JA, Heydebrand G, Miller JP, Miller MI. Hippocampal deformities in schizophrenia characterized via high dimensional brain mapping. American Journal of Psychiatry. 2002;159:2000–2006. doi: 10.1176/appi.ajp.159.12.2000. [DOI] [PubMed] [Google Scholar]
- Csernansky JG, Schindler MK, Splinter NR, Wang L, Gado M, Selemon LD, Rastogi-Cruz D, Posener JA, Thompson PA, Miller MI. Abnormalities of thalamic volume and shape in schizophrenia. American Journal of Psychiatry. 2004;161:896–902. doi: 10.1176/appi.ajp.161.5.896. [DOI] [PubMed] [Google Scholar]
- Cullen TJ, Walker MA, Parkinson N, Craven R, Crow TJ, Esiri MM, Harrison PJ. A postmortem study of the mediodorsal nucleus of the thalamus in schizophrenia. Schizophrenia Research. 2003;60:157–166. doi: 10.1016/s0920-9964(02)00297-9. [DOI] [PubMed] [Google Scholar]
- Curcio CA, Drucker DN. Retinal ganglion cells in Alzheimer’s disease and aging. Annals of Neurology. 1993;33:248–257. doi: 10.1002/ana.410330305. [DOI] [PubMed] [Google Scholar]
- Danos P, Baumann B, Bernstein HG, Stauch R, Krell D, Falkai P, Bogerts B. The ventral lateral posterior nucleus of the thalamus in schizophrenia: a post-mortem study. Psychiatric Research Neuroimaging. 2002;114:1–9. doi: 10.1016/s0925-4927(01)00131-7. [DOI] [PubMed] [Google Scholar]
- Danos P, Baumann B, Kramer A, Bernstein HG, Stauch R, Krell D, Falkai P, Bogerts B. Volumes of association thalamic nuclei in schizophrenia: a postmortem study. Schizophrenia Research. 2003;60:141–155. doi: 10.1016/s0920-9964(02)00307-9. [DOI] [PubMed] [Google Scholar]
- Deicken RF, Eliaz Y, Chosiad L, Feiwell R, Rogers L. Magnetic resonance imaging of the thalamus in male patients with schizophrenia. Schizophrenia Research. 2002;58:135–144. doi: 10.1016/s0920-9964(01)00330-9. [DOI] [PubMed] [Google Scholar]
- Doniger GM, Foxe JJ, Murray MM, Higgins BA, Javitt DC. Impaired visual object recognition and dorsal/ventral stream interaction in schizophrenia. Archives of General Psychiatry. 2002;59:1011–1020. doi: 10.1001/archpsyc.59.11.1011. [DOI] [PubMed] [Google Scholar]
- Dorph-Petersen KA, Pierri JN, Sun Z, Sampson AR, Lewis DA. Stereological analysis of the mediodorsal thalamic nucleus in schizophrenia: volume, neuron number, and cell types. Journal of Comparative Neurology. 2004;472:449–462. doi: 10.1002/cne.20055. [DOI] [PubMed] [Google Scholar]
- Eastwood SL, Cairns NJ, Harrison PJ. Synaptophysin gene expression in schizophrenia. Investigation of synaptic pathology in the cerebral cortex. British Journal of Psychiatry. 2000;176:236–242. doi: 10.1192/bjp.176.3.236. [DOI] [PubMed] [Google Scholar]
- Ettinger U, Chitnis XA, Kumari V, Fannon DG, Sumich AL, O’Ceallaigh S, Doku VC, Sharma T. Magnetic resonance imaging of the thalamus in first-episode psychosis. American Journal of Psychiatry. 2001;158:116–118. doi: 10.1176/appi.ajp.158.1.116. [DOI] [PubMed] [Google Scholar]
- Gao H, Hollyfield JG. Aging of the human retina- differential loss of neurons and retinal pigment epithelial cells. Investigative Opthalmology and Visual Science. 1992;33:1–17. [PubMed] [Google Scholar]
- Gilbert AR, Rosenberg DR, Harenski K, Spencer S, Sweeney JA, Keshavan MS. Thalamic volumes in patients with first-episode schizophrenia. American Journal of Psychiatry. 2001;158:618–624. doi: 10.1176/appi.ajp.158.4.618. [DOI] [PubMed] [Google Scholar]
- Green MF, Nuechterlein KH, Mintz J. Backward masking in schizophrenia and mania: I. Specifying a mechanism. Archives of General Psychiatry. 1994a;51:939–944. doi: 10.1001/archpsyc.1994.03950120011003. [DOI] [PubMed] [Google Scholar]
- Green MF, Nuechterlein KH, Mintz J. Backward masking in schizophrenia and mania: II. Specifying the visual channels. Archives of General Psychiatry. 1994b;51:945–951. doi: 10.1001/archpsyc.1994.03950120017004. [DOI] [PubMed] [Google Scholar]
- Green MF, Mintz J, Salveson D, Nuechterlein KH, Breitmeyer B, Light GA, Braff DL. Visual masking as a probe for abnormal gamma range activity in schizophrenia. Biological Psychiatry. 2003;31:1113–1119. doi: 10.1016/s0006-3223(02)01813-9. [DOI] [PubMed] [Google Scholar]
- Gundersen HJ, Jensen EB. The efficiency of systematic sampling in stereiology and its prediction. Journal of Microscopy. 1987;147:223–263. doi: 10.1111/j.1365-2818.1987.tb02837.x. [DOI] [PubMed] [Google Scholar]
- Gunderson HJG, Bagger P, Bendtsen TF, Evans SM, Korbo L, Marcussen N, Moller A, Neilsen K, Nyengaard JR, Pakkenberg B, Sorensen FB, Vesterby A, West MJ. The new stereological tools: Disector, fractionator, nucleator and point sampled intercepts and their use in pathological research and diagnosis. Acta Pathologica, Microbiologica, et Immunologica Scandinavica. 1988;96:857–881. doi: 10.1111/j.1699-0463.1988.tb00954.x. [DOI] [PubMed] [Google Scholar]
- Hazlett EA, Buchsbaum MS, Byne W, Wei TC, Speigel-Cohen J, Geneve C, Kinderlehrer R, Haznedar MM, Shihabuddin L, Siever LJ. Three-dimensional analysis with MRI and PET of the size, shape, and function of the thalamus in the schizophrenia spectrum. American Journal of Psychiatry. 1999;156:1190–1199. doi: 10.1176/ajp.156.8.1190. [DOI] [PubMed] [Google Scholar]
- Javitt DC, Doneshka P, Zylberman I, Ritter W, Vaughan HG., Jr Impairment of early cortical processing in schizophrenia: an event related potential confirmation study. Biological Psychiatry. 1993;33:513–519. doi: 10.1016/0006-3223(93)90005-x. [DOI] [PubMed] [Google Scholar]
- Johnston-Wilson NL, Sims CD, Hofmann JP, Anderson L, Shore AD, Torrey EF, Yolken RH. Disease-specific alterations in frontal cortex brain proteins in schizophrenia, bipolar disorder, and major depressive disorder. The Stanley Neuropathology Consortium. Molecular Psychiatry. 2000;5:142–149. doi: 10.1038/sj.mp.4000696. [DOI] [PubMed] [Google Scholar]
- Kaplan E, Shapley RM. The primate retina contains two types of ganglion cells, with high and low contrast sensitivity. Proceedings of the National Academy of Science USA. 1986;83:2755–2757. doi: 10.1073/pnas.83.8.2755. [DOI] [PMC free article] [PubMed] [Google Scholar]
- Kemether EM, Buchsbaum MS, Byne W, Hazlett EA, Haznedar M, Brickman AM, Platholi J, Bloom R. Magnetic resonance imaging of mediodorsal, pulvinar, and centromedian nuclei of the thalamus in patients with schizophrenia. Archives of General Psychiatry. 2003;60:983–991. doi: 10.1001/archpsyc.60.9.983. [DOI] [PubMed] [Google Scholar]
- Khan AA, Wadhwa S, Randey RM, Bijlani V. Prenatal human lateral geniculate nucleus: a quantitative light microscopic study. Developmental Neuroscience. 1993;15:403–409. doi: 10.1159/000111364. [DOI] [PubMed] [Google Scholar]
- Kim D, Zemon V, Saperstein A, Butler PD, Javitt DC. Dysfunction of early-stage visual processing in schizophrenia: harmonic analysis. Schizophrenia Research. 2005;76:55–65. doi: 10.1016/j.schres.2004.10.011. [DOI] [PubMed] [Google Scholar]
- Lennie P. Parallel visual pathways. A review. Vision Research. 1980;20:561–594. doi: 10.1016/0042-6989(80)90115-7. [DOI] [PubMed] [Google Scholar]
- Livingston M, Hubel D. Segregationg of form, color, movement, and depth: anatomy, physiology, and perception. Science. 1988;240:740–749. doi: 10.1126/science.3283936. [DOI] [PubMed] [Google Scholar]
- Mirnics K, Middleton FA, Stanwood GD, Lewis DA, Levitt P. Disease-specific changes in regulator of G-protein signaling 4 (RSG4) expression in schizophrenia. Molecular Psychiatry. 2001;6:293–301. doi: 10.1038/sj.mp.4000866. [DOI] [PubMed] [Google Scholar]
- O’Donnell BF, Swearer JM, Smith LT, Nestor PG, Shenton ME, McCarley RW. Selective deficits in visual perception and recognition in schizophrenia. American Journal of Psychiatry. 1996;153:687–692. doi: 10.1176/ajp.153.5.687. [DOI] [PubMed] [Google Scholar]
- Pakkenberg B. Pronounced reduction of total neuron number in mediodorsal thalamic nucleus and nucleus accumbens in schizophrenics. Archives of General Psychiatry. 1990;47:1023–1028. doi: 10.1001/archpsyc.1990.01810230039007. [DOI] [PubMed] [Google Scholar]
- Pearlson GD, Petty RG, Ross CA, Tien AY. Schizophrenia: A disease of heteromodal association cortex? Neuropsychopharmacology. 1996;14:1–17. doi: 10.1016/S0893-133X(96)80054-6. [DOI] [PubMed] [Google Scholar]
- Perrone-Bizzozero NI, Sower AC, Bird ED, Benowitz LI, Ivins KJ, Neve RL. Levels of growth-associated protein GAP-43 are selectively increased in association cortices in schizophrenia. Proceedings of National Academy of Science USA. 1996;93:14182–14187. doi: 10.1073/pnas.93.24.14182. [DOI] [PMC free article] [PubMed] [Google Scholar]
- Popken GJ, Bunney WE, Jr, Potkin SF, Jones EF. Subnucleus-specific loss of neurons in medial thalamus in schizophrenia. American Journal of Psychiatry. 2000;153:191–199. [Google Scholar]
- Portas CM, Goldstein JM, Shenton ME, Hokama HH, Wible CG, Fischer I, Kikinis R, Donnino R, Jolesz A, McCarley RW. Volumetric evaluation of the thalamus in schizophrenic male patients using magnetic resonance imaging. Biological Psychiatry. 1998;43:649–659. doi: 10.1016/s0006-3223(97)00339-9. [DOI] [PubMed] [Google Scholar]
- Preuss UW, Zetzsche T, Jager M, Groll C, Frodl T, Bottlender R, Leinsinger G, Hegerl U, Hahn K, Moller HJ, Meisenzahl EM. Thalamic volume in first-episode and chronic schizophrenic subjects: a volumetric MRI study. Schizophrenia Research. 2005;73:91–101. doi: 10.1016/j.schres.2004.09.019. [DOI] [PubMed] [Google Scholar]
- Renshaw PF, Yurgelin-Todd DA, Cohen BM. Greater hemodynamic response to photic stimulation in schizophrenic patients: an echo-planar MRI study. American Journal of Psychiatry. 1994;151:1493–1495. doi: 10.1176/ajp.151.10.1493. [DOI] [PubMed] [Google Scholar]
- Schecter I, Butler PD, Silipo G, Zemon V, Javitt DC. Magnocellular and parvocellular contributions to backward masking dysfunction in schizophrenia. Schizophrenia Research. 2003;64:91–101. doi: 10.1016/s0920-9964(03)00008-2. [DOI] [PubMed] [Google Scholar]
- Selemon LD. Regionally diverse cortical pathology in schizophrenia: Clues to the etiology of the disease. Schizophrenia Bulletin. 2001;27:349–377. doi: 10.1093/oxfordjournals.schbul.a006881. [DOI] [PubMed] [Google Scholar]
- Selemon LD, Rajkowska G, Goldman-Rakic PS. Abnormally high neuronal density in the schizophrenic cortex. A morphometric analysis of prefrontal area 9 and occipital area 17. Archives of General Psychiatry. 1995;52:805–818. doi: 10.1001/archpsyc.1995.03950220015005. [DOI] [PubMed] [Google Scholar]
- Selemon LD, Lidow MS, Goldman-Rakic PS. Increased volume and glial density in primate prefrontal cortex associated with chronic antipsychotic drug exposure. Biological Psychiatry. 1999;46:161–172. doi: 10.1016/s0006-3223(99)00113-4. [DOI] [PubMed] [Google Scholar]
- Spear PD. Neural bases of visual deficits during aging. Vision Research. 1993;33:2589–2609. doi: 10.1016/0042-6989(93)90218-l. [DOI] [PubMed] [Google Scholar]
- Spear PD, Kim CB, Ahmad A, Tom BW. Relationship between numbers of retinal ganglion cells and lateral geniculate neurons in the rhesus monkey. Visual Neuroscience. 1996;13:199–203. doi: 10.1017/s0952523800007239. [DOI] [PubMed] [Google Scholar]
- Sunner I, Rakic P. Numerical relationship between neurons in the lateral geniculate nucleus and primary visual cortex in macque monkeys. Visual Neuroscience. 1996;13:585–590. doi: 10.1017/s0952523800008269. [DOI] [PubMed] [Google Scholar]
- Torrey EF, Webster M, Knable M, Johnston N, Yolken RH. The Stanley Foundation brain collection and neuropathology consortium. Schizophrenia Research. 2000;44:151–155. doi: 10.1016/S0920-9964(99)00192-9. [DOI] [PubMed] [Google Scholar]
- Webster MJ, Knable MB, Johnston-Wilson N, Nagata K, Inagaki M, Yolken RH. Immunohistochemical localization of phosphorylated glial fibrillary acidic protein in the prefrontal cortex and hippocampus from patients with schizophrenia, bipolar disorder, and depression. Brain, Behavior, and Immunity. 2001;15:388–400. doi: 10.1006/brbi.2001.0646. [DOI] [PubMed] [Google Scholar]
- Williams RW, Rakic P. Elimination of neurons from the rhesus monkey’s lateral geniculate nucleus during development. Journal of Comparative Neurology. 1988;272:424– 436. doi: 10.1002/cne.902720310. [DOI] [PubMed] [Google Scholar]
- Young KA, Manaye KF, Liang CL, Hicks PB, German DC. Reduced number of mediodorsal and anterior thalamic neurons in schizophrenia. Biological Psychiatry. 2000;47:944–953. doi: 10.1016/s0006-3223(00)00826-x. [DOI] [PubMed] [Google Scholar]