

Abstract
People often experience age-related declines in cone-based visual capacities despite an absence of apparent visual pathology. Although mice are used as models of human visual pathologies associated with aging, little is known about how age impacts vision in animals with disease-free retinas since most studies have heretofore examined relatively young mice. We examined the effects of age on cone-based vision by assessing opsin gene transcription, cone densities, the flicker electroretinogram (ERG), and behavioral increment thresholds in mice. ERG measurements of cone function showed age-related declines in maximum voltage (Vmax), while opsin gene transcription, cone density, and increment thresholds were unchanged even in extremely old mice. The age-related decline in Vmax seen in mice is qualitatively similar to that documented for human subjects. It is notable that Vmax, a commonly used index of ERG activity, does not predict behavioral performance in the mouse.
Keywords: Aging, Photoreceptor, Opsin, Electroretinogram (ERG), Behavioral sensitivity, Mus musculus
1. Introduction
A classic concern attracting renewed interest in recent years is the change in function and structure of the visual system with age. As humans age the incidence of visual pathologies such as macular degeneration, glaucoma, and cataracts increase dramatically. In addition to problems directly linked to visual pathology, older people with disease-free retinas often experience declines in visual capacities. These changes may include reductions in spatial vision under low-light conditions, poorer color discrimination, glare disability, reduced facial recognition, impaired motion perception, and a restriction in visual field size (Haegerstrom-Portnoy, 2005; Haegerstrom-Portnoy, Sch-neck, & Brabyn, 1999; Snowden & Kavanagh, 2006; West et al., 2002).
The nature of the deficits seen in aged humans suggests that both rod and cone mediated visual pathways are subject to the effects of aging. Such deficits could be due to decreased transmission of light by the ocular media, loss of photoreceptors, changes in photoreceptor transduction efficiency, a decline in the production of photopigment, problems in brain structures involved in visual processing, or some combination of these factors. Experiments using electroretinogram (ERG) a-waves as an index of the electrical activity of human rod and cone photoreceptors reveal a modest age-related decline in sensitivity of both photoreceptor types, perhaps due to decreases in photoreceptor transduction efficiency, while maximum response amplitudes (Vmax) are unaffected by age (Birch, Hood, Locke, Hoffman, & Tzekov, 2002). In contrast, examinations of rod and cone mediated ERG b-waves, reflecting post-receptoral activity, yielded Vmax values in geriatric individuals (∼70 years) that were only half as large as those of young adults (∼20 years) (Birch & Anderson, 1992; Weleber, 1981). These results suggest that at least some of the deficits seen in older individuals are due to changes in the eye itself, but there is still uncertainty regarding their exact cause. For example, Fortune and Johnson (2002) argued that age-dependent declines in retinal responses are due primarily to decreased transmission of light through the ocular media whereas Hemenger (1982) found no age-related changes in ocular transmission of non-cataractous lenses in individuals up to 62 years of age. Horiguchi and colleagues (1998) detected age-related declines in ERG voltages elicited from all three cone types in pseudoaphakic humans, implying that at least some of the deficits associated with normal aging are not due to decreased lens transmission. Some of the discrepancies in these results could be due to differences in subject populations, but in general the cause(s) of non-pathological visual deficits associated with aging are still not entirely clear.
Rodents are frequently used to model various aspects of human vision. A virtue of utilizing such animals is that environmental conditions (light levels, nutrition, etc.) to which they are exposed can be made less variable than those present in human study populations and, consequently, it is usually possible to provide much cleaner experimental comparisons in animal experiments. Are rodents, like humans, subject to age-related visual deficits? A vast majority of the work on this topic has been conducted on the house mouse. Previous electrophysiological experiments on mouse aging have yielded mixed results; for example, Provencio, Wong, Lederman, Argamaso, and Foster (1994) reported no decreases in ERG responses in mice up to 5.5 months of age, whereas Gresh and colleagues (2003) found that rod and middle-wavelength sensitive (M) cone ERG voltages of C57BL/6 and Balb/c mice decreased with age, but they detected no age-related decrease in ultraviolet sensitive (UV) cone responses in animals up to 17 months of age. In accord with their electrophysiological results in the Balb/c mice, Gresh, Goletz, Crouch, and Rohrer (2003) also found age-related decreases in the number of cell body profiles in the outer nuclear layer (ONL), in rhodopsin pigment density (as measured by microspectrophotometry), in the number of M opsin antibody reactive cells, and in the total number of cone photoreceptors. However, in C57BL/6 mice rhodopsin levels and ONL cell numbers decreased with age, but cone numbers remained unchanged. UV opsin immunoreactivity showed no change with age in either mouse strain. Nir, Agarwal, and Papermaster (1990) looked at ONL cell numbers in BALB/C mice and found no differences between mice of 1 week and 6 months of age. Similarly, Li, Cheng, Yang, Peachey, and Naash (2001) saw no significant age-related decreases in either rod or cone photoreceptor density in C57BL/6 mice as old as 12 months while Trachimowicz and colleagues (1981) found no age-related changes in rod densities in mice ranging in age from 65 to 1000 days. Together these results suggest that once adult levels are achieved, rod numbers remain stable across the mouse lifespan.
From these results, it appears that rod and cone function indexed by ERG Vmax values decline with age and that rod numbers are not reduced, even in very old animals. However, it is also clear that better data are needed to evaluate cone function in older mice and it remains to be seen how age might impact visual behavior. Accordingly, we sought to expand what is known about cone-based vision by examining cone opsin gene transcription, cone densities, ERG measurements, and behavioral measurements of visual sensitivity in the aging mouse.
2. Materials and methods
2.1. Subjects
Mice (C57BL/6) were obtained from the Aged Mouse Colony maintained by the National Institute on Aging (NIA), from Charles River Laboratories (Wilmington, MA), or as locally born offspring of mice obtained from Charles River Laboratories. Observations were made on animals ranging in age from 32 to 954 days. For reference, the median survival age for C57BL/6 mice given ad-lib access to food is around 820 days (Turturro et al., 1999). Animals were housed under a 12 h light/12 h dark cycle with overhead lighting sufficient to provide an average ambient illumination of 51 lux. Except for those that were subjects in behavioral experiments, mice were given ad-lib access to food and water. Mice being tested in behavioral experiments were deprived of food for 22 h prior to testing. To ensure the welfare of food restricted animals they were weighed daily and fed sufficiently to maintain normal body weight. All experiments were conducted in accord with NIH guidelines and were approved by the UCSB Institutional Animal Care and Use Committee.
2.2. Real-time RT-PCR
RT-PCR was used to measure M and UV opsin transcript levels as a function of age. Animals were euthanized with an overdose of halothane, the eyes were removed, and retinal tissue was excised and placed in RNA-later stabilization reagent (Ambion) for a maximum of 1 h at 4 °C. The tissue was placed in a combination of RLT lysis buffer (Qiagen, Valencia, CA) and β-mercaptoethanol and the samples were subsequently disrupted and homogenized using a rotor–stator. RNA from these samples was purified using an RNA purification kit (RNeasy Mini, Qiagen, Valencia, CA) and subsequently treated with DNase (Promega, Madison, WI). RNA was reverse transcribed using Superscript II Reverse Transcriptase (Invitrogen, Carlsbad, CA). Primer sets for the mouse cone opsins and a set of standard housekeeping genes were generated using primer designing software (Beacon Designer 3.0) based on sequences obtained from GenBank (see Table 1). Gene transcripts were amplified by quantitative polymerase chain reaction with DNA-specific fluorescent dye (SYBR Green, P.E. Bio-systems) using the following temperature cycles: 3 min at 95 °C and 45 cycles of 10 s at 95 °C, 15 s at 60 °C, 90 s at 72 °C, 30 s at 78 °C, and 30 s at 82 °C.
Table 1.
Primer sets for RT-PCR experiment
| Gene | Sense primer | Anti-sense primer | Amplicon length (bases) |
GenBank Accession Nos. |
|---|---|---|---|---|
| Mouse M opsin | TGCTACCTCCAAGTGTGGCTG | TATAGGGTCCCCAGCAGAGGC | 142 | AF190672 |
| Mouse UV opsin | GTGTGTGACTATGTGAGTGTTGGA | AGAGGCTGAAGAGATGGCTCAG | 143 | NM007538 |
| B2M | GGAGAATGGGAAGCCGAACATAC | AGAAAGACCAGTCCTTGCTGAAG | 143 | BC085164 |
| Cyclophilin | TGCCAGGGTGGTGACTTTACA | GCCATCCAGCCATTCAGTCTTG | 189 | X52803 |
| GADP | AATGTGTCCGTCGTGGATCTGA | AGTGTAGCCCAAGATGCCCTTC | 117 | BC083149 |
| YWHAZ | GGTCTGTCACCGTCTCCCTTTAA | TCGGTAGGGTGTGAGCTTTGG | 107 | NM011740 |
To generate standard efficiency curves for quantifying opsin transcript levels in the experimental samples, RT-PCR was first run using the opsin primers. The resulting PCR amplicon from each opsin primer set was run on an electrophoresis gel. The gel band for each amplicon was excised and the product purified using a DNA purification kit (QIAquick, Qiagen, Valencia, CA). The concentration of the purified cDNA was determined using a DNA detection system (Agilent 2100 Bioanalyzer, Agilent Technologies, Palo Alto, CA) to establish the number of copies of each cDNA product/μL. Efficiency curves for each opsin primer set were generated by performing RT-PCR using a series of reactions containing known quantities of each cDNA product.
PCR products were quantified using a BioRad MyIQ detection system (Hercules,CA) and transcript levels were adjusted using the standard efficiency curves described above. To control for the total amount of mRNA extracted across samples, the geometric mean expression of the housekeeping genes was used to normalize levels of opsin mRNA transcript expression (Pfaffl, 2001). In order to ensure reliability, opsin mRNA transcript levels were determined three times in each sample with each primer set.
2.3 Cone opsin labeling
Mice were killed by an overdose of halothane. The eyes were marked for orientation by making a small burn on the dorsal cornea and then removed. Eye cups were prepared by removing the cornea and lens while a small cut corresponding to the corneal orientation mark was made in the dorsal eye cup to maintain identification of retinal orientation. Eye cups were immersion fixed in 4% paraformaldehyde diluted in 0.086 M NaP4buffer (pH 7.3). Whole retinas were removed and kept in 4% paraformaldehyde for at least 4 h.
Retinas were rinsed and protein blocked overnight at 4 °C in normal goat serum (1:20; Vector Laboratories, Burlingame, CA) diluted in a solution containing 0.1 M phosphate-buffered saline (PBS), 0.5% bovine serum albumin (BSA; Sigma, St. Louis, MO), 0.1% Triton X-100 (LabChem Inc., Pittsburgh, PA), and 0.1% sodium azide (Sigma, St. Louis, MO), together referred to as PBTA. Next, retinas were incubated in a combination of biotinylated peanut agglutinin (PNA) lectin (1:1000, Vector Laboratories, Burlingame, CA), a cone-specific marker (Blanks & Johnson, 1984) and either a UV/S-specific antibody (JH455; 1:2000) or a M/L opsin-specific antibody (JH492; 1:2000; both antibodies being gifts of Dr. Jeremy Nathans) for 24 h at 4 °C on a rotator. The retinas were then rinsed in PBTA and incubated in a combination of streptavidin conjugated to the fluorochrome Texas Red (1:200, Vector Laboratories, Burlingame, CA) and a goat anti-rabbit IgG secondary antibody conjugated to the fluoro-chrome Cy2 (1:200, Vector Laboratories, Burlingame, CA) for 24 h at 4 °C on a rotator. The retinas were whole-mounted photoreceptor side up in fade-resistant mounting media (5% n-propyl gallate in glycerol). All dilutions and rinses were done in PBTA. Control retinas were processed with the primary antibodies omitted.
Digital images having areas of 0.0125 mm −2 were taken at 1 mm intervals across the whole-mounted retinas using the 60× objective of a fluorescence microscope (Olympus BX-60) equipped with a CCD camera. On average 21 sites were sampled from each retina. The images were adjusted for contrast and brightness using Adobe photoshop. The images were viewed on a computer monitor and labeled cells were counted. From the counts, the overall density of cones, UV opsin expressing cones, and M opsin expressing cones for each sq mm sampled were estimated. Cell densities/mm2 were then averaged across all retinal locations.
2.4. ERG measurements
Cone generated ERG V–log I functions were recorded from mice of various ages using methods described elsewhere (Jacobs, Neitz, & Krogh, 1996; Jacobs, Williams, & Fenwick, 2004). Animals were anesthetized with an intra-muscular injection of a mixture of xylazine (20 mg/kg) and keta-mine hydrochloride (100 mg/kg). The test eye was dilated by topically applied atropine sulfate (0.04%). Animals were placed in a head restraint to allow for alignment with the optical system and body temperature was maintained at a normal level through the use of a circulating hot-water heating pad. The electrical signal was recorded using a pair of stainless steel recording electrodes constructed specifically for use on rodents. Flickering test stimuli were presented in a train of 70 pulses. The fundamental response components generated by the last 50 such pulses were averaged. A complete description of the ERG signal processing steps can be found in Jacobs et al. (1996).
For V–log I experiments two separate light sources were employed. The test stimulus was produced by a 50 W tungsten-halide light source. The intensity and spectral character of this light was determined by filters positioned in the optical pathway; its timing was controlled with a high-speed shutter similarly positioned. The second light source was a 50 W tungsten-halide lamp which could be used to provide adaptation lights. Lights derived from the two sources were optically superimposed and projected in Maxwellian view so as to illuminate a circular field subtending 57° of visual angle on the retina.
To access cone signals, recordings were made using 12.5 Hz stimuli in a room illuminated by overhead fluorescent lights which produced ∼150 lux at the cornea. Earlier experiments indicate that these conditions reliably yield cone-based signals in ERGs recorded from mice (Calderone & Jacobs, 1995; Jacobs, Fenwick, Calderone, & Deeb, 1999; Jacobs et al., 2004). The mouse retina contains two types of cone pigment having respective peak absorptions at about 360 and 510 nm (Jacobs, Neitz, & Deegan, 1991). To access signals from cones containing M pigment a long-pass filter with a cutoff at 455 nm (Schott GG455) was placed in the stimulus pathway. With this combination of illumination and flicker rate, and because the mouse UV cone pigment is relatively insensitive to these wavelengths, this produces a stimulus that effectively isolates signals arising from the activation of M cone pigment. V–log I functions were obtained by averaging the stimulus-locked component of 50 responses to the flickering lights at each of a series of intensity values ranging from threshold up to saturation levels.
The intensities of the stimuli were controlled by placing Kodak–Wratten neutral-density filters in the stimulus pathway. In these experiments stimulus intensity was specified by using a spectrophotometer to measure the energy of the test lights at 10-nm steps across the spectrum, converting these to photon units, and then weighting the values according to their effectiveness on each of the mouse cone pigments. Corrections were also made for the spectral absorption properties of the mouse lens (unpublished measurements). Stimulus intensities specified in this way for the M cone pigment test light ranged from 11.7 to 15.6 log effective/photons/s/sr. For each animal five consecutive measurements were made at each test intensity.
To record signals initiated from cones containing UV pigment the eye was steadily adapted to an intense, long-wavelength light generated by placing a long-pass filter (Wratten 21A; 50% transmission at 556 nm) in front of the adapting light source. When weighted by its effectiveness on the mouse M pigment the adapting light yielded 14.97 log effective photons/s/sr; this was sufficient to obviate any responses to long-wavelength test lights and thus effectively eliminated any contributions to the ERG signal from activation of the M photopigment. The UV test light was generated by placing a band-pass filter (Schott UG1; peak = 370 nm; half-band-pass of 60 nm) in the pathway of the test beam. Taken together, these stimulus conditions would be expected to selectively elicit responses from cones containing UV pigment. UV photopigment driven V–log I functions were obtained by averaging the stimulus-locked component of 50 responses to the flickering lights at each of a series of intensity values ranging from threshold up to a level at which the response saturated. The intensities of the stimuli were also controlled by placing Wratten neutral-density filters in the stimulus pathway. Specified as above, this provided a range of stimulus intensities from 10.6 to 13.7 log effective photons/s/sr. As for the M cone pigment responses, five sets of measurements were made for each animal at each of the test intensities.
2.5. Behavioral experiments
Increment-threshold sensitivity was assessed using a three-alternative forced-choice discrimination task. The behavioral test apparatus and the general procedures for measuring visual capacities in non-human subjects have been described in detail elsewhere (Jacobs, 1983; Jacobs et al., 2004). In brief, the behavioral testing apparatus consists of a small test chamber in which visual stimuli and reinforcement are presented automatically under the program control of a remotely located computer. Stimulus lights are presented via three, circular rear-projection test panels (2.5-cm diameter) mounted in a horizontal line (center-to-center distance = 5 cm) along one wall of the test chamber. Two separate light sources are used to illuminate the panels. A background light originates from a 150 W tungsten-halide lamp; it diffusely and equally illuminates all three test panels. The second light source originates from an Instruments SA (Model H-10) grating monochromator (half-energy passband = 16 nm) equipped with a 75 W xenon lamp and it serves as the test light. The wavelength setting of the test light and the intensity of the test light are computer controlled; the latter through adjustment of a circular wedge filter that is placed in the test light pathway. The test light can be directed to any of the three circular test panels via an automated system of computer controlled mirrors. The spectral character and intensity of the background lights are controlled by step filters that are placed in the path of the beam from the background light source.
Mice were operantly trained to indicate which of the three stimulus panels was illuminated by the test light by touching the lit panel. Responses were detected by computer and correct responses were reinforced by a small volume of soy milk (0.028 mL; Westsoy) automatically delivered through feeding tubes positioned directly above each of the stimulus panels. Test trials were signaled by a cueing tone and terminated when the animal responded or after a period of 15 s. The inter-trial interval averaged 6 s.
To measure photopic increment thresholds the background lights were set to provide a panel luminance of 27 cd/m2; a fluorescent bulb in the ceiling of the testing box provided an ambient illuminance of 100 lux. Test lights were monochromatic (500 and 580 nm). Over trials, the test lights were presented at a range of intensities selected to elicit performance spanning the range from about 90% to 40% correct. For each measurement, testing continued across daily sessions until approximately 100 trials were accumulated at each of the test intensities. To determine thresholds the resulting psychometric data were best-fit using a logistic function. From those functions the test light intensity required to elicit 57% accuracy was taken as the threshold measure.
Although, our experiments were principally directed toward mouse cones and the vision they subserve, it was convenient to additionally assess scotopic increment thresholds in these same subjects and in that way see if rod-based visual performance changes with age. For that purpose, all of the same procedures were employed except that the test chamber was darkened and the background light was dimmed to 0.04 cd/m2. Mice were pre-adapted to these chamber conditions for 15 min prior to start of the daily test session.
3. Results
3.1. Effects of age on cone opsin mRNA expression
Mouse M and UV opsin mRNAs were selectively amplified by RT-PCR and then quantified using primer efficiency curves. M and UV opsin mRNAs were detected in each of the mice analyzed (n = 6). To control for differences in the overall amount of mRNA extracted across samples, a suite of housekeeping genes was also amplified by RT-PCR. To verify that the housekeeping genes provided a valid measure of baseline mRNA levels, linear regression analyses were performed on the relative expression of each housekeeping gene as a function of age. The relative expression of these genes did not vary as a function of age (all p values > .30). Accordingly, the geometric mean level of expression of the housekeeping genes was calculated for each animal (Pfaffl, 2001). Fig. 1 shows the normalized levels of M opsin and UV opsin mRNA expression (expressed in log units) plotted as a function of age. Regression analyses on the data expressed in linear units showed that neither M opsin mRNA nor UV opsin mRNA expression varied significantly with age (p = .440, r2 = .1234; p = .454, r2 = .1162, respectively).
Fig. 1.
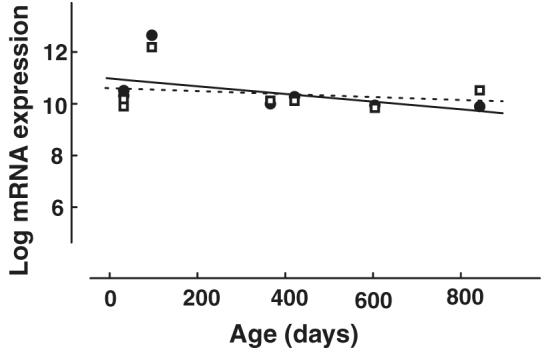
Mouse M opsin (circles, solid line) and UV opsin (squares, dashed line) mRNA transcript levels as a function of age. The lines are best-fitting linear regressions. The mRNA transcript levels were normalized to the geometric mean of a suite of housekeeping genes and are plotted on a logarithmic scale.
3.2. Opsin antibody-labeling
Cells reactive for PNA and each of the cone opsin antibodies were detected in all of the retinas processed (Fig. 2). In all cases the antibody-labeled cells were coincident with PNA labeled cells suggesting that these antibodies are specific for cone opsins. Control retinas processed using only the secondary antibodies showed no labeling.
Fig. 2.
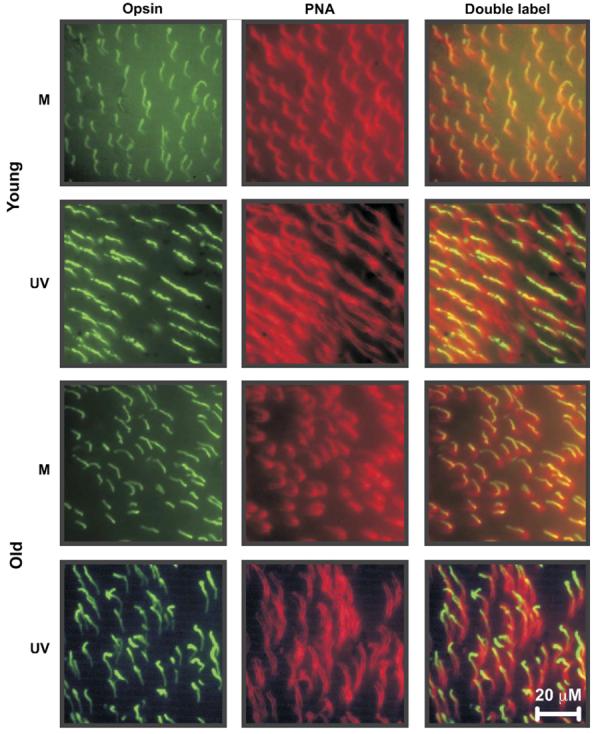
Immunolabeled flat-mounted mouse retinas. Shown are representative images of retinas from two young (ages = 105 and 185 days) mice and one old mouse (age = 857 days) double-labeled with PNA (middle column) and a cone opsin-specific antibody (left column). The right column shows images of opsin antibody-labeled cells (left column) superimposed with cells labeled with PNA (middle column). In all cases opsin antibody reactivity was restricted to cone outer segments. Scale bar = 20 μM.
For each animal the average density of cells/mm2 was first estimated for each of the two eyes and those estimates were averaged to obtain a density estimate for the animal. The average density of cones for all animals examined was 10,364 cells/mm2 (SD = 290.65, n = 7). Assuming a retinal area of 18.5 mm2 for C57BL/6 mice (Zhou & Williams, 1999), these average densities imply that the total number of cones in the retinas of these mice was approximately 190,000. This value is in reasonable accord with other estimates of the total number of mouse cone photoreceptors (∼180,000) (Jeon, Strettoi, & Masland, 1998). Fig. 3a shows cone densities plotted as a function of age. A linear regression analysis of the data indicates that there is no significant relationship between age and cone density (p > .05, r2 = .241).
Fig. 3.
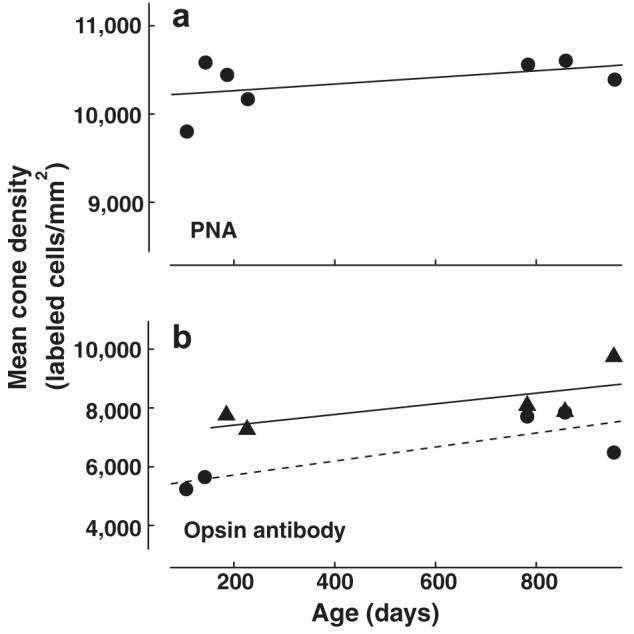
Results from fluorescence immunohistochemistry experiments. (a) Estimated cone densities (cells/mm2) as evidenced by PNA reactivity. The densities are plotted as a function of age (n = 7) with the best-fitting line. (b) Average densities (cells/mm2) of cones expressing M pigment (triangles; n = 5) and UV pigment (circles; n = 5) plotted as a function of age. (M pigment, solid line; UV pigment, dashed line).
The densities of cones containing each of the two pigment types were also measured. For most subjects one eye was processed with PNA and the antibody JH492, while the other was processed with PNA and JH455. However, for some animals both eyes were processed with the same combination of antibodies and the densities obtained from the two eyes were averaged to obtain an estimate. The average density of UV antibody labeled cells was 6582/mm2 (SD = 1178.24, n = 5) and that for the M antibody reactive cells was 8141/mm2 (SD = 914.89, n = 5). Fig. 3b shows the density of UV opsin containing cells plotted as a function of age. A linear regression indicates that although the number of UV reactive cells is slightly higher in older animals, this trend is not significant (p > .05, r2 = .674). Likewise, there was no significant relationship between age and the density of M labeled cells (see Fig. 3b; p > .05, r2 = .50). In summary, the labeling experiments indicate that there are no reliable changes in the densities of cones in mice across the lifespan.
3.3. ERG experiments
M and UV cone-based ERG V–log I functions were recorded from a total of 30 mice ranging in age from 66 to 826 days; each animal was tested only once. ERG voltages did not vary greatly across the five consecutive samples taken at each test light setting, usually by no more than 1–2 μV. For each animal measurements at each test intensity were averaged, the data were fitted using the Naka–Rushton equation, and the three parameters, maximum voltage (Vmax), slope (η), and half-saturation voltage (k), were calculated (Fulton & Rushton, 1978). Representative M cone V–log I functions obtained from a single young mouse and a single old mouse are shown in Fig. 4. It can be seen that the fitted functions account well for the ERG data and that much lower voltages were recorded from the older animal.
Fig. 4.
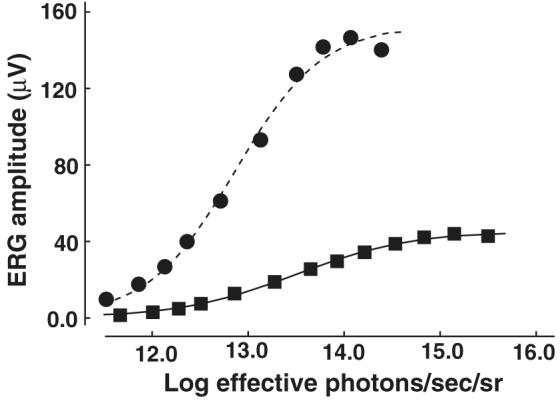
Representative V–log I functions from a single young mouse (circles) and a single old mouse (squares). The stimulus was a flickering light with a wavelength content designed to be absorbed by the M pigment (see text for complete details). Each data set has been fit using the Naka–Rushton equation.
As described above, the test light intensities were specified by weighting each stimulus according to its effectiveness on the mouse UV and M cone pigments. Fig. 5a shows the Vmax parameter for the M V–log I functions plotted as function of age. Although, the inter-subject variability is traditionally quite large in voltage measurements of this kind, there is a highly significant negative correlation between age and the Vmax values (r2 = .4406, p < .001), the decline being such that in aged mice the average Vmax is less than half that recorded from young mice. Similarly, the Vmax values for UV V–log I functions also declined significantly as a function of age (Fig. 6a; r2 = .5042, p < .001). The slopes for the UV and M Vmax versus age regressions were not significantly different from each other, i. e., both UV and M Vmax values were similarly affected by age.
Fig. 5.
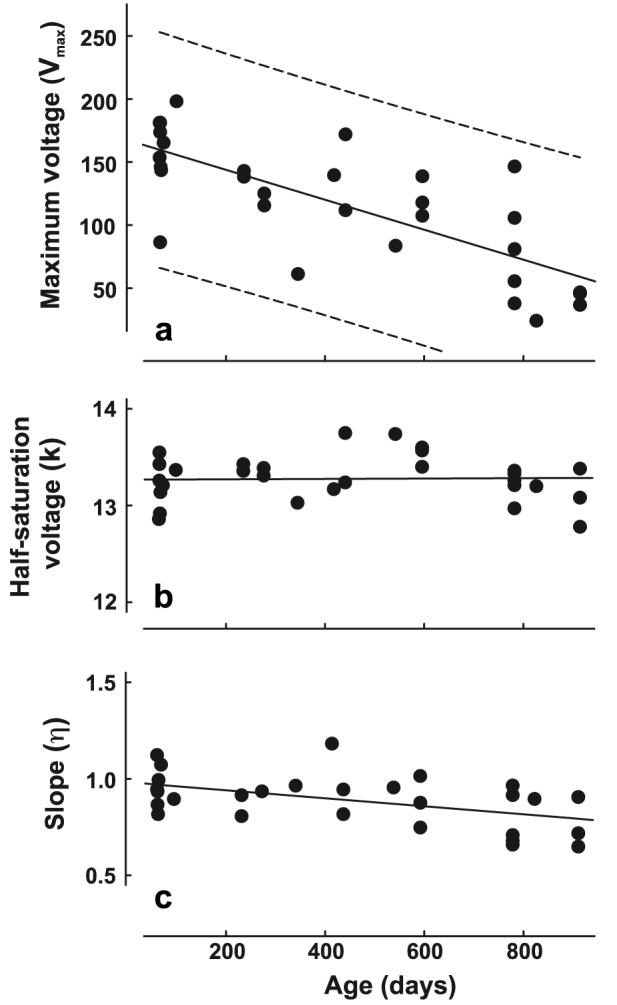
Parameters derived from the best-fits to V–log I functions obtained from 30 mice tested at different ages. The stimulus was a flickering light having wavelength content such that it activated receptors containing M cone pigment. (a) Vmax values. The dashed lines show the bounds of the 99% confidence interval. (b) k parameter. (c) Slope parameter.
Fig. 6.
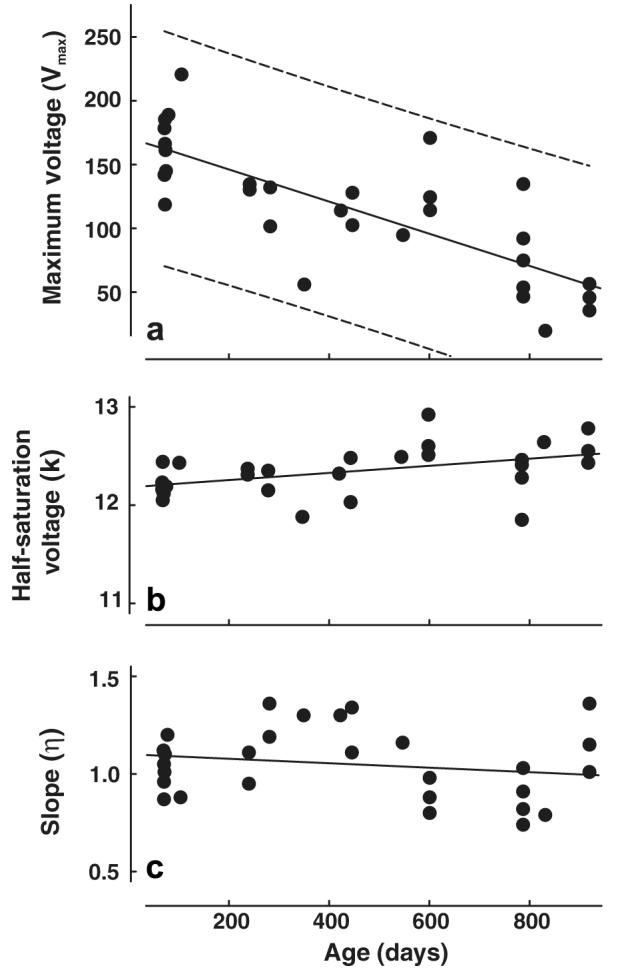
Parameters derived from the best-fits to V–log I functions obtained from 30 mice tested at different ages. The stimulus was designed to activate cones containing UV pigment. Other details as for Fig. 5.
The M- and UV-based half-saturation voltages (k) are plotted as a function of age in Figs. 5b and 6b, respectively. There was no significant relationship between age and the k parameter in either condition (p > .05). As was the case for the Vmax values, the slope parameters (ƞ) for both M (Fig. 5c) and UV (Fig. 6c) functions significantly declined as a function of age (r2 = .1866 and r2 = .1625, respectively; both p values < .05).
3.4. Effects of age on visual sensitivity
To ensure that tests conducted under light-adapted conditions in fact indexed measurements of cone-based vision, thresholds for test lights of 500 and 580 nm were determined in a single mouse. Eight separate threshold measurements were taken over multiple separate test sessions; the thresholds were then averaged, and best-fit with photopigment absorption curves to yield two-point spectral sensitivity functions. Fig. 7a shows the averaged sensitivity values (bottom, open circles; ±SD). These values were best-fit with a photopigment absorption curve (dashed line) having a peak value (λmax) of 509 nm. That value is close to other estimates of the sensitivity peak of mouse M cones (Jacobs et al., 1991, 2004; Lyubarsky, Falsini, Pennesi, Valentini, & Pugh, 1999; Sun, Macke, & Nathans, 1997; Yokoyama, Radlwimmer, & Kawamura, 1998) verifying that these behavioral test conditions do index cone-based vision.
Fig. 7.

(a) Two-point increment threshold spectral sensitivity functions measured under photopic (open circles) and scotopic (closed circles) conditions. The photopic data were best-fit (dashed lines) by a photopigment absorption function having a peak of 509 nm. The best-fit curve for scotopic data (continuous line) has a peak of 500 nm. (b) Behavioral increment thresholds measured under photopic conditions from a single mouse over a span of 21 months (107–753 days; open circles) with the best-fitting linear regression (solid line). Also shown are thresholds from three geriatric mice measured at various ages (662–905 days; open triangles and diamonds) and the average threshold from three young mice (108 days of age; open square, ±SD). (c) Behavioral increment thresholds measured under scotopic conditions from a single mouse over a span of ∼24 months (89–801 days; closed circles) with the best-fitting line (solid line). Also shown are scotopic increment thresholds obtained from a second geriatric mouse (935 days; closed triangle) and the average threshold obtained from three young mice (87–217 days; closed square, ±SD). All thresholds were derived as described in the text.
Increment thresholds measured under photopic conditions were obtained from a single mouse tested on thirteen separate occasions at ages ranging from 107 to 753 days (Fig. 7b, open circles). There was a remarkable consistency of thresholds (mean = 11.36 log effective photons/s/sr; range = 11.23–11.49 log effective photons/s/sr) measured over what is effectively the entire life span of this mouse (in fact, this animal died of natural causes within one week of the time of the last threshold measurement). The threshold data were fit with a linear regression; there was no significant correlation between age and photopic increment thresholds, r2 = .0489, p = .468. To verify that the data obtained from this animal are typical, photopic increment thresholds were similarly measured for three young mice (all 108 days of age; Fig. 7b, open square) and three other very old mice that were tested at multiple ages (662–905 days; Fig. 7b, open symbols). An independent samples t-test comparing thresholds from old mice tested at an average age of 839 days to those obtained from young animals showed that thresholds for old mice (mean = 11.41 log effective photons/s/sr, range = 11.18–11.52 log effective photons/s/sr) were not significantly different from those for young mice (mean = 11.46 log effective photons/s/sr, range = 11.31–11.53 log effective photons/s/sr; p > .05) This result suggests that the stable threshold measurements obtained across the lifespan from the single mouse are not atypical.
To similarly ensure that the test conditions used in the scotopic experiments adequately isolated rod-based vision, sensitivities to 500 and 580 nm test lights were also measured under those conditions. Fig. 7a (top, closed circles, ±SD) shows that sensitivity values measured under scotopic test conditions were approximately three log units higher than those obtained under photopic test conditions. The photopigment absorption curve that best-fits these data (solid line) has a peak value (λmax) of 500 nm, thus verifying that data measured under these test conditions represent mouse rod-based vision (Lyubarsky et al., 1999).
Scotopic thresholds were measured in a single mouse over an extended time period (age ranging from 89 to 801 days). Threshold sensitivity for this animal is shown plotted as a function of age in Fig. 7c (closed circles). The linear regression establishes that there was no signifi-cant relationship between age and scotopic sensitivity for this animal even when measurements were done when the animal was quite old (r2 = .1021, p = .211). Scotopic increment thresholds were also obtained from a second geriatric mouse tested when he was 935 days old and for three young animals tested at various ages ranging from 87 to 217 days. The threshold for the second old mouse, shown as the solid triangle at the right of Fig. 7c, was very similar to that of the mouse that had been repeatedly tested across the entire life span. The sensitivities of the young mice were plotted as a function of age and fitted with a linear regression. For these relatively young mice there was no relationship between age and scotopic sensitivity. Accordingly, the thresholds for these three mice were averaged (Fig. 7c, closed square at left, ±SD) in order to obtain a baseline sensitivity measurement for comparison with thresholds in the older mice. An independent samples t-test comparing scotopic thresholds measured in young mice at the earliest ages tested (mean = 8.64 log effective photons/s/sr, range = 8.45–8.80 log effective photons/s/sr) to those obtained from old mice at the oldest ages tested (mean = 8.73 log effective photons/s/sr) showed no significant difference. As in the case for the photopic increment thresholds, mice appear to show no significant changes in correspondingly measured scotopic increment-threshold measured across the life span.
4. Discussion
Our results paint a fairly clear picture of what happens to several indices of cone-based vision as measured across the lifespan of adult C57BL/6 mice. Cone opsin mRNA expression levels and cone photoreceptor cell densities do not vary significantly as a function of age. Neither are there any changes in the relative numbers of cones expressing the two cone photopigments. All of these results are in accord with those reported previously by others who examined much younger mice and who also found no decreases in either overall cone density or densities of cones expressing each photopigment subtype (Gresh et al., 2003; Li et al., 2001). These outcomes are also in line with results obtained from humans which show little or no age-related decline in overall cone numbers (Dorey, Wu, Ebenstein, Garsd, & Weiter, 1989; Jonas, Schneider, & Naumann, 1992).
As measured over a similar time span, the ERG Vmax values originating from absorption of light by M and UV cone photopigments showed very substantial age-related declines such that those elicited from aged mice were only about half those recorded from young mice. Previous studies using C57BL/6 mice, again conducted over more restricted time spans, also found decreases in ERG voltages for stimulation of M cones (Gresh et al., 2003; Li et al., 2001) and of UV cones (Li et al., 2001). These declines in mouse responsivity are also qualitatively similar to results from ERG studies of humans which indicate that by age 70 human cone ERG Vmax values have declined to roughly half those characteristic of young adults (Birch & Anderson, 1992). What might be the source of this decline in the cone-based Vmax values? Cone opsin gene transcription levels, the density of cells reactive to cone opsin antibodies, and overall cone densities appear to be stable across the mouse lifespan so the decline in Vmax accompanying mouse aging does not seem likely to be due to either photoreceptor death or decreased photopigment densities resulting from decreases in opsin gene transcription. We also screened the mice for obvious signs of cataracts prior to testing so pre-retinal filtering also seems an unlikely source of the voltage decline. Other potential changes that might lead to a decrease in maximum voltage include the death of non-photoreceptor cells such as bipolar or Muller cells (Birch & Anderson, 1992).
Results from human ERG studies may cast some light on this issue. Studies investigating the effects of age on an ERG model of phototransduction in human subjects involving an analysis of the leading edge of the a-way suggest that there are age-related decreases in both rod and cone transduction effciency (Cideciyan & Jacobson, 1996; Tzekov, Locke, Hood, & Birch, 2003). It has been proposed that such a decline in photoreceptor transduction effciency could contribute to age-related decreases in ERG signals that index post-receptoral sources like those recorded here (Tzekov et al., 2003). To the extent that a similar decline in photoreceptor operation goes on in the mouse, that may also be the source of the very significant decline in ERG amplitudes we have documented. Whatever the reason for such a decline, it is a significant feature of the ERG in the aging mouse. Although absolute ERG amplitudes will vary significantly for different recording arrangements and different choices of stimulus parameters, we suggest that the rate of decline documented in Figs. 5 and 6 may be used as a template to compare ERG responsivity for animals of greatly different ages. The decline in voltage with age documented here reinforces the view that studies of transgenic and knock-out mice involving ERG indices should routinely include age-matched wild-type mice as controls (Clarke et al., 2000; Karan et al., 2005).
Although, the ERG responses derived from each cone photopigment type showed virtually identical changes with age, those derived for UV-specific stimulation were approximately eight times more sensitive than those generated from M pigment stimulation. That difference is roughly similar to the relative contribution of signals from the two photopigment types to spectral sensitivity as measured using the ERG (Jacobs et al., 2004; Lyubarsky et al., 1999). That difference is believed to be a direct reflection of relatively greater total expression of UV vs M pigment in the mouse retina (Applebury et al., 2000).
The photopic and scotopic increment thresholds we measured were remarkably consistent across the entire mouse lifespan with aged animals having threshold values quite indistinguishable from those obtained from young mice. That result stands in sharp contrast to the dramatic decline in maximum voltage obtained from ERG recordings conducted over the same time span. One obvious difference between these two indices is that the behavioral measurements were necessarily made at much lower light levels. The most intense of the 500 nm test lights used in the photopic measurements can be estimated to have a value of ∼12.6 log effective photons/s/sr (calculated using the assumptions documented in Williams, Daigle, & Jacobs, 2005). That number is about a thousand times lower than the highest intensity used in the corresponding ERG measurements (∼15.56 log effective photons/s/sr). In fact, by those same calculations, the test light intensities required to reach the behavioral thresholds are lower than those that yielded reliable ERG responses. Even at the lowest intensities used in the ERG measurements there is a reliable age-related decline in voltage; for example, at a test light intensity of 11.7 effective photons/s/sr the voltages obtained from the samples of young and old mice shown in Fig. 5 vary significantly as a function of age (r2 = .1811, p < .05). These comparisons suggest that performance in the behavioral increment threshold task may be insensitive to physiological changes that influence changes in ERG voltage. The only feature of the ERG results (Figs. 5 and 6) that does not vary with age, and thus does predict the behavioral results, are the k values, the semisaturation constants. It is of some interest that the parameter k also shows only a relatively small change (an increase of ∼0.1 log unit) across a large fraction of the human life span (Birch & Anderson, 1992). Whether the relationship between ERG k values and behavioral increment thresholds are coincidental or not, our results do make clear that while ERG amplitude measures may be informative about local changes occurring in the outer retina, they clearly do not predict simple features of mouse vision such as these large-field, increment thresholds.
Our results show that there are no age-related declines in increment-threshold sensitivity in mice, but that obviously does not imply that all aspects of mouse vision are immune to the effects of age. In this case the picture derived from studies of humans may be instructive. Although, as indicated above, there is good documentation that a wide variety of human visual capacities do decline with advancing age some aspects of seeing show much less change. Of the latter, for example, when measured with low frequency targets chromatic contrast thresholds increase with age while achromatic contrast thresholds do not (Page & Crognale, 2005). And, paradoxically, in a visual motion task for some large, high contrast targets older human subjects can actually outperform younger individuals (Betts, Taylor, Sekuler, & Bennett, 2005). Based on the picture of human change, it seems likely that although some aspects of mouse visual capacity (like those documented here) may remain relatively intact across the lifespan, others will probably decline with advancing age. Given the diffculties of obtaining sensitive measurements of mouse vision it will be challenging to determine what aspects of the visual capacities of mice change with age and which do not.
Acknowledgments
This work was supported by the National Eye Institute (EY002052). We thank John Fenwick, Kris Krogh, and Katie Peterson for laboratory assistance.
References
- Applebury ML, Antoch MP, Baxter LC, Chun LLY, Falk JD, Farhangfar F, et al. The murine cone photoreceptor: a single cone type expresses both S and M opsins with retinal spatial patterning. Neuron. 2000;27:513–523. doi: 10.1016/s0896-6273(00)00062-3. [DOI] [PubMed] [Google Scholar]
- Betts LR, Taylor CP, Sekuler AB, Bennett PJ. Aging reduces center-surround antagonism in visual motion procession. Neuron. 2005;45:361–366. doi: 10.1016/j.neuron.2004.12.041. [DOI] [PubMed] [Google Scholar]
- Birch DG, Anderson JL. Standardized full-field electroretinography: Normal values and their variation with age. Archives of Ophthalmology. 1992;110:1571–1576. doi: 10.1001/archopht.1992.01080230071024. [DOI] [PubMed] [Google Scholar]
- Birch DG, Hood DC, Locke KG, Hoffman DR, Tzekov RT. Quantitative electroretinogram measures of phototransduction in cone and rod photoreceptors. Archives of Ophthalmology. 2002;120:1045–1051. doi: 10.1001/archopht.120.8.1045. [DOI] [PubMed] [Google Scholar]
- Blanks JC, Johnson LV. Specific binding of peanut lectin to a class of retinal photoreceptor cells. Investigative Ophthalmology and Visual Science. 1984;25:546–557. [PubMed] [Google Scholar]
- Calderone JB, Jacobs GH. Regional variations in the relative sensitivity to UV light in the mouse retina. Visual Neuroscience. 1995;12:463–468. doi: 10.1017/s0952523800008361. [DOI] [PubMed] [Google Scholar]
- Cideciyan AV, Jacobson SG. An alternative phototransduction model for human rod and cone ERG a-waves: normal parameters and variation with age. Vision Research. 1996;36:2609–2621. doi: 10.1016/0042-6989(95)00327-4. [DOI] [PubMed] [Google Scholar]
- Clarke G, Goldberg AF, Vidgen D, Collins L, Ploder L, Schwarz L, et al. Rom-1 is required for rod photoreceptor viability and the regulation of disk morphogenesis. Nature Genetics. 2000;25:67–73. doi: 10.1038/75621. [DOI] [PubMed] [Google Scholar]
- Dorey CK, Wu G, Ebenstein D, Garsd A, Weiter JJ. Cell loss in the aging retina. Investigative Ophthalmology and Visual Science. 1989;30:1691–1699. [PubMed] [Google Scholar]
- Fortune B, Johnson CA. Decline of photopic multifocal electroretinogram responses with age is due primarily to preretinal optical factors. Journal of the Optical Society of America A. 2002;19:173–184. doi: 10.1364/josaa.19.000173. [DOI] [PubMed] [Google Scholar]
- Fulton AB, Rushton WH. The human rod ERG: Correlation with psychophysical responses in light and dark adaptation. Vision Research. 1978;18:793–800. doi: 10.1016/0042-6989(78)90119-0. [DOI] [PubMed] [Google Scholar]
- Gresh J, Goletz PW, Crouch RK, Rohrer B. Structure–function analysis of rods and cones in juvenile, adult, and aged C57BL/6 and Balb/c mice. Visual Neuroscience. 2003;20:211–220. doi: 10.1017/s0952523803202108. [DOI] [PubMed] [Google Scholar]
- Haegerstrom-Portnoy G. The Glenn A. Fry award lecture 2003: Vision in elders—summary of findings of the SKI study. Optometry and Vision Science. 2005;82:87–93. doi: 10.1097/01.opx.0000153162.05903.4c. [DOI] [PubMed] [Google Scholar]
- Haegerstrom-Portnoy G, Schneck ME, Brabyn JA. Seeing into old age: vision function beyond acuity. Optometry and Vision Science. 1999;76:141–158. doi: 10.1097/00006324-199903000-00014. [DOI] [PubMed] [Google Scholar]
- Hemenger RP. Optical density of the crystalline lens. American Journal of Optometry and Physiological Optics. 1982;59:34–42. doi: 10.1097/00006324-198201000-00006. [DOI] [PubMed] [Google Scholar]
- Jacobs GH. Within-species variations in visual capacity among squirrel monkeys (Saimiri sciureus): Sensitivity differences. Vision Research. 1983;23:239–248. doi: 10.1016/0042-6989(83)90112-8. [DOI] [PubMed] [Google Scholar]
- Jacobs GH, Fenwick JC, Calderone JB, Deeb SS. Human cone pigment expressed in transgenic mice yields altered vision. The Journal of Neuroscience. 1999;19:3258–3265. doi: 10.1523/JNEUROSCI.19-08-03258.1999. [DOI] [PMC free article] [PubMed] [Google Scholar]
- Jacobs GH, Neitz J, Deegan JF., II Retinal receptors in rodents maximally sensitive to ultraviolet light. Nature. 1991;353:655–656. doi: 10.1038/353655a0. [DOI] [PubMed] [Google Scholar]
- Jacobs GH, Neitz J, Krogh K. Electroretinogram flicker photometer and its applications. Journal of the Optical Society of America A. 1996;13:641–648. doi: 10.1364/josaa.13.000641. [DOI] [PubMed] [Google Scholar]
- Jacobs GH, Williams GA, Fenwick JA. Influence of cone pigment coexpression on spectral sensitivity and color vision in the mouse. Vision Research. 2004;44:1615–1622. doi: 10.1016/j.visres.2004.01.016. [DOI] [PubMed] [Google Scholar]
- Jeon CJ, Strettoi E, Masland RH. The major cell populations of the mouse retina. The Journal of Neuroscience. 1998;18:8936–8946. doi: 10.1523/JNEUROSCI.18-21-08936.1998. [DOI] [PMC free article] [PubMed] [Google Scholar]
- Jonas JB, Schneider U, Naumann GOH. Count and density of human retinal photoreceptors. Graefe's Archive for Clinical and Experimental Ophthalmology. 1992;230:505–510. doi: 10.1007/BF00181769. [DOI] [PubMed] [Google Scholar]
- Karan G, Lillo C, Yang Z, Cameron DJ, Locke KG, Zhao Y, et al. Lipofuscin accumulation, abnormal electrophysiology, and photoreceptor degeneration in mutant ELOVL4 transgenic mice: A model for macular degeneration. Proceedings of the National Academy of Sciences of the United States of America. 2005;102:4164–4169. doi: 10.1073/pnas.0407698102. [DOI] [PMC free article] [PubMed] [Google Scholar]
- Li C, Cheng M, Yang H, Peachey NS, Naash MI. Age-related changes in the mouse outer retina. Optometry and Vision Science. 2001;78:425–430. doi: 10.1097/00006324-200106000-00015. [DOI] [PubMed] [Google Scholar]
- Lyubarsky AL, Falsini B, Pennesi ME, Valentini P, Pugh EN., Jr. UV- and midwave-sensitive cone-driven retinal responses of the mouse: A phenotype for coexpression of cone photopigments. Journal of Neuroscience. 1999;19:442–455. doi: 10.1523/JNEUROSCI.19-01-00442.1999. [DOI] [PMC free article] [PubMed] [Google Scholar]
- Nir I, Agarwal N, Papermaster DS. Opsin gene expression during early and late phases of retinal degeneration in rds mice. Experimental Eye Research. 1990;51:257–267. doi: 10.1016/0014-4835(90)90022-m. [DOI] [PubMed] [Google Scholar]
- Page JW, Crognale MA. Differential aging of chromatic and achromatic visual pathways: Behavior and electrophysiology. Vision Research. 2005;45:1481–1489. doi: 10.1016/j.visres.2004.09.041. [DOI] [PubMed] [Google Scholar]
- Pfaffl MW. A new mathematical model for relative quantification in real-time PCR. Nucleic Acids Research. 2001;29:2002–2007. doi: 10.1093/nar/29.9.e45. [DOI] [PMC free article] [PubMed] [Google Scholar]
- Provencio I, Wong S, Lederman AB, Argamaso SM, Foster RG. Visual and circadian responses to light in aged retinally degenerate mice. Vision Research. 1994;34:1799–1806. doi: 10.1016/0042-6989(94)90304-2. [DOI] [PubMed] [Google Scholar]
- Snowden RJ, Kavanagh E. Motion perception in the ageing visual system: Minimum motion, motion coherence, and speed discrimination thresholds. Perception. 2006;35:9–24. doi: 10.1068/p5399. [DOI] [PubMed] [Google Scholar]
- Sun H, Macke JP, Nathans J. Mechanisms of spectral tuning in the mouse green cone pigment. Proceedings of the National Academy of Sciences of the United States of America. 1997;94:8860–8865. doi: 10.1073/pnas.94.16.8860. [DOI] [PMC free article] [PubMed] [Google Scholar]
- Suzuki S, Horiguchi M, Tanikawa A, Miyake Y, Kondo M. Effect of age on short-wavelength sensitive cone electroretinogram and long- and middle-wavelength sensitive cone electroretinogram. Japanese Journal of Ophthalmology. 1998;42:424–430. doi: 10.1016/s0021-5155(98)00030-6. [DOI] [PubMed] [Google Scholar]
- Trachimowicz RA, Fisher LJ, Hinds JW. Preservation of retinal structure in aged pigmented mice. Neurobiology of Aging. 1981;2:133–141. doi: 10.1016/0197-4580(81)90011-7. [DOI] [PubMed] [Google Scholar]
- Turturro A, Witt WW, Lewis S, Hass BS, Lipman RD, Hart RW. Growth curves and survival characteristics of the animals used in the Biomarkers of Aging Program. The Journals of Gerontology A. 1999;54:492–501. doi: 10.1093/gerona/54.11.b492. [DOI] [PubMed] [Google Scholar]
- Tzekov RT, Locke KG, Hood DC, Birch DG. Cone and rod ERG phototransduction parameters in retinitis pigmentosa. Investigative Ophthalmology and Visual Science. 2003;44:3993–4000. doi: 10.1167/iovs.02-1104. [DOI] [PubMed] [Google Scholar]
- Weleber RG. The effect of age on human cone and rod ganzfeld electroretinograms. Investigative Ophthalmology and Visual Science. 1981;20:392–399. [PubMed] [Google Scholar]
- West CG, Gildengorin G, Haegerstrom-Portnoy G, Schneck ME, Lott L, Brabyn JA. Is vision function related to physical functional ability in older adults? Journal of the American Geriatric Society. 2002;50:136–145. doi: 10.1046/j.1532-5415.2002.50019.x. [DOI] [PubMed] [Google Scholar]
- Williams GA, Daigle KA, Jacobs GH. Rod and cone function in coneless mice. Visual Neuroscience. 2005;22:807–816. doi: 10.1017/S095252380522610X. [DOI] [PubMed] [Google Scholar]
- Yokoyama S, Radlwimmer FB, Kawamura S. Regeneration of ultraviolet pigments of vertebrates. FEBS Letters. 1998;423:155–158. doi: 10.1016/s0014-5793(98)00086-6. [DOI] [PubMed] [Google Scholar]
- Zhou G, Williams RW. Mouse models for myopia: An analysis of variation in eye size in adult mice. Optometry and Vision Science. 1999;76:408–418. doi: 10.1097/00006324-199906000-00021. [DOI] [PubMed] [Google Scholar]