Abstract
Several methods exist to retrieve and purify DNA fragments after agarose or polyacrylamide gel electrophoresis for subsequent analyses. However, molecules present in low concentration and molecules similar in size to their neighbors are difficult to purify. Capillary electrophoresis has become popular in molecular diagnostic laboratories because of its automation, excellent resolution, and high sensitivity. In the current study, the ABI Prism 310 Genetic Analyzer was reconfigured into a fraction collector by adapting the standard gel block to accommodate a collection tube at the distal end of capillary. The time to collect the desired peaks was estimated by extrapolating from standard capillary electrophoresis using the original gel block. Fraction collection from a mixture of DNA fragments amplified from wild type and several internal tandem duplication mutations of the FMS-like tyrosine kinase 3 (Flt3) gene yielded highly purified DNA fragments containing internal tandem duplication mutations and predictable electrokinetics using the reconstructed gel block. The reconfigured instrument could successfully isolate DNA amplicons from extremely low-amplitude peaks (110 relative fluorescent units), which were undetectable using polyacrylamide gel electrophoresis. In addition, we successfully isolated bands that were only three bases apart that comigrated on polyacrylamide gel electrophoresis. DNA sequencing was used to confirm that the correct peaks were recovered at sufficient purity.
Electrophoretic separation of molecules is essential to molecular biology. Agarose gel-based electrophoresis was formerly the standard method to separate DNA or RNA molecules, subsequently visualized by ethidium bromide staining. Polyacrylamide gel electrophoresis (PAGE) offers higher resolution compared with conventional agarose gel electrophoresis and can be automated using laser excitable fluorochrome-labeled DNA fragments, “automated sequencing.”1 Currently, capillary electrophoresis has become widely used in molecular diagnostic laboratories principally because of its single base resolution and ability to automate both the loading and analysis.2,3
Routine retrieval of molecules after electrophoretic separation is less straightforward. Several methods have been developed to retrieve and purify DNA fragments from ethidium bromide-stained agarose gels for subsequent analyses, such as cloning or DNA sequencing.4 These include “band-stabbing” and electroelution of bands.4,5,6 However, inherent to these methods are the requirements that the molecule is present at high enough concentration to be visualized and that the desired molecule is sufficiently separated from neighboring molecules so that it can be recovered in pure form. Molecules present in low concentration or similar in size to their neighbors are notoriously difficult to recover.
Recovery of molecules for additional analysis is especially critical in certain clinical situations. Flt3 testing is sometimes performed on patients with either low or unknown blast counts. When a low-amplitude peak is found, it is difficult to differentiate between low-level nonspecific amplification and the expected low-amplitude peak because of a low blast count. In these cases, sequencing the peak provides additional data supporting a real putative internal tandem duplication (ITD) mutation. For somatic hypermutation analysis, one may wish to purify immunoglobulin heavy and light chain amplicons to homogeneity before DNA sequencing, and this can be difficult if the bands are close together in size.
In this study, we designed and constructed an alternative block for the ABI 310 capillary electrophoresis instrument (Applied Biosystems, Foster City, CA) that permits collection of separated DNA molecules. This allowed us to successfully collect molecules with extremely low peak heights and those separated from their neighbors by as few as three bases.
Materials and Methods
Samples and PCR
DNA was extracted from the peripheral blood or bone marrow submitted to Molecular Diagnostic Laboratory at Johns Hopkins Hospital for detection of ITD mutations of the Flt3 gene, using the QIAamp DNA kit (Qiagen, Valencia, CA).7 Alternatively, DNA was extracted from the tissue blocks submitted for determination of T-cell receptor (TCR) gene rearrangement using xylene/ethanol deparaffinization followed by proteinase K digestion and heat inactivation at 97°C for 10 minutes.8 The ITD and the TCR gene fragments were amplified according to the protocols previously described.7,9
Capillary Electrophoresis
Two microliters of PCR products, 0.5 μl of 5-carboxytetramethylrhodamine-labeled size standard, and 13 μl of deionized formamide were mixed according to the manufacturer’s protocol (Applied Biosystems), heated at 95°C for 2 minutes, and placed on ice for at least 1 minute before electrokinetic injection to the ABI 310 Genetic Analyzer. The size and positions of peaks on the electropherogram were analyzed using GeneScan analysis software (Applied Biosystems).
PAGE
Ten microliters of PCR products was separated by 10% PAGE (Bio-Rad, Hercules, CA) in Tris borate-EDTA buffer, stained with ethidium bromide, and visualized under UV light as described previously.7
Fraction Collecting
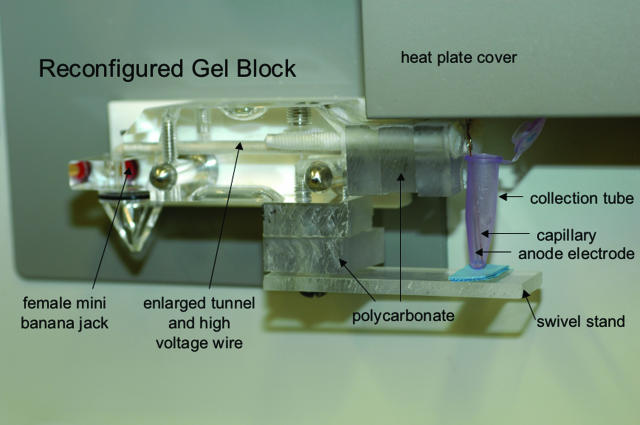
Capillary electrophoresis was stopped approximately 60 to 90 seconds ahead of the estimated time needed for the desired molecules to migrate to the distal end of the capillary (see Results). The original gel block was then replaced by the reconfigured gel block holding a 1.5-ml Eppendorf tube with 20 μl of standard 1× capillary electrophoresis buffer with EDTA (Figure 1). The voltage was then turned off at selected time intervals (15 to 60 seconds) to change the collection tubes. The tips of the anode electrode and capillary were rinsed in an Eppendorf tube containing 1 ml of deionized water and in a second containing 1 ml of buffer and dried with a Kimwipe before submersion in the buffer of the new collection tube. We collected fractions using two operators, where one was responsible for running the instrument from the computer using the “manual control” window, whereas the second was responsible for changing the collection tubes. We exercised tremendous care to ensure that, after the voltage was turned off, both the current and voltage in the “status” window had dissipated to zero before opening the doors. This typically took a few seconds after initiating the “voltage off” command in the “manual control” window.
Figure 1.
Reconfigured gel block, mounted inside the ABI 310 Genetic Analyzer. The original block has been replaced with the reconfigured block as shown. The new anode runs parallel to the released capillary with its end approximately 0.5 mm above the distal end of capillary, the same relative position recommended for the end of the cathode and the proximal end of the capillary. The reconfigured gel block holds a pink collection tube containing 20 μl of buffer. See Results.
Reamplification of Isolated DNA Fragments
From the collection tube containing the isolated DNA fragments, 1.5 μl was subjected to PCR in a total volume of 15 μl to reamplify the ITD or TCR gene fragments according to the protocols described above, where the number of amplification cycles was reduced to 25 to 30.
Reamplification of PCR products in a clinical lab must be performed in a safe manner to avoid contamination of the clinical laboratory. We recommend that reamplification reactions be assembled in a separate room dedicated either to research or specifically for reamplification. One could devise a strategy in which initial PCR reactions are performed using uracil-DNA-N-glycosylase (UNG) and uracil. Reamplification reactions could be performed using uracil (in the absence of UNG). In this way, both the initial PCR products and the reamplification products would be susceptible to UNG degradation. This issue is the same as that with nested PCR reactions in which care must be exercised to prevent contamination of the lab.
DNA Sequencing
PCR products were purified using QiaQuick columns (Qiagen, Valencia, CA) and cycle sequenced using BigDye 3.1 according to manufacturer’s protocol at the DNA sequencing facility and resolved on an ABI 3700 (Applied Biosystems). Sequences were analyzed using Sequencher software (Gene Codes Corp, Inc., Ann Arbor, MI).
Results
Reconfiguration of ABI 310 Genetic Analyzer
We first considered whether the existing ABI 310 instrument could safely be reconfigured as a molecular fraction collector. The voltage used for the ABI 310 is commonly 15,000 V, resulting in a current of approximately 8 to 9 microamperes. The DNA fragments migrate from the cathode (proximal end of capillary, which is dipped into the sample on the right side of the instrument) to the anode (distal end of capillary, which is inserted into the gel block, on the left). Using a Fluke 87 digital multimeter with a Fluke 80K-40 high-voltage probe (Fluke Electronics, Everett, WA), we determined that this voltage potential is produced using −15,000 V at the cathode and ground potential at the anode.
We therefore reasoned it safe to conduct the ground potential on the anode side using a wire attached to an electrode mounted next to the distal end of the capillary. To accomplish this, we reconfigured a second gel block (Figure 1) as follows. Starting with a commercial block from ABI, the existing electrode (anode) was first removed by unscrewing the female mini banana jack. The tunnel of the gel block (which normally contains polymer) was drilled out to increase its size. A high-voltage wire, WHV Sup 15-18 (Surplus Sales of Nebraska, Omaha, NE), was threaded through the enlarged tunnel and attached to the existing mini banana jack by tightening. The right side of the block was extended using three pieces of 0.5-inch polycarbonate, so that the new position of the mounted electrode would be parallel to the distal end of the freed capillary. An extra electrode that would normally be mounted at the proximal end of the capillary (and used as the cathode) was mounted using a nylon screw so that the end of the electrode (now used as the anode) was approximately 0.5 mm above the distal end of the capillary (the same relative position recommended by Applied Biosystems for the proximal end of the capillary). The electrode and capillary are now parallel to each other. Finally, a stand was constructed to support a 1.5-ml Eppendorf tube so that both the electrode and capillary tip would be submersed in 20 μl of 1× capillary electrophoresis buffer. The stand was designed to swivel to permit easy changing of Eppendorf tubes. Excluding the cost of the original ABI block and labor costs, the total cost of supplies to assemble the sorting tool was less than $100.
Precisely Assigned Size and Predictable Flow Rate of DNA Fragments by Capillary Electrophoresis
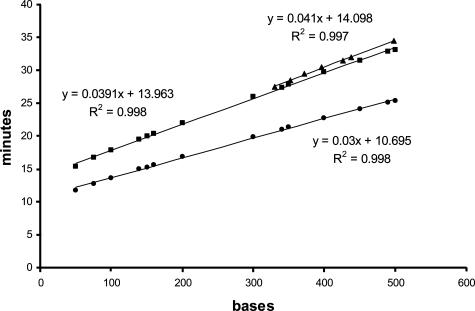
Analyses of 14 independent runs of capillary electrophoresis (using the standard block) suggested that the time needed for the size standard DNA fragments to be detected in the window of the capillary could be reliably estimated from the size of DNA molecules due to a linear relationship between size of molecules and time to detection (R2 = 0.998) (Figure 2, circles). Size standards from Applied Biosystems typically include an internal control fragment that the computer does not use to establish the standard curve. The assigned size of this control fragment was a mean of 245.2 bases, with a range of 244.9 to 245.3 bases and a SD of 0.13 bases. We hypothesized that the velocity at which a molecule travels from the proximal end of the capillary to the window (36 cm) is the same as from the window to the distal end of the capillary (11 cm), despite an expected decrease in temperature after the capillary exits the heating plate. We therefore extrapolated to determine the time needed for the size standards to migrate the entire length of capillary into the collection tube (Figure 2, squares). The extrapolated time (tex) was calculated by multiplying the time-to-window (tw) by the ratio of the total length of the capillary divided by the distance to the window [tex = tw × (47 cm/36 cm)].
Figure 2.
Electrokinetics of capillary electrophoresis. DNA fragments of varying size (size standards) were separated by capillary electrophoresis using the standard block and the time to detection determined. They demonstrate a linear relationship between the size in bases (x axis) and the time in minutes (y axis) needed to migrate to the detection window of the capillary using the standard block (•). We extrapolated these data to predict the time it would take the molecule to reach the end of the capillary (▪). Experimental data from the ITD mixed samples in Figure 3 using the modified block (▴) nearly superimposes on the results predicted by extrapolation. For each line, the slope, y-intercept, and R2 value is calculated using the least-squares method.
Electrokinetics of Capillary Electrophoresis Using the Reconfigured Gel Block
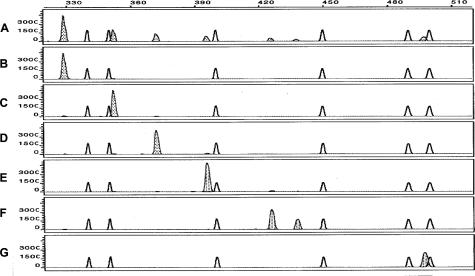
PCR products amplified from DNA samples with a variety of ITD mutations were mixed together and subjected to ABI 310 capillary electrophoresis and fraction collection at 1-minute intervals (Figure 3A). Collected molecules were then reamplified. Capillary electrophoresis of the reamplified PCR products showed wild-type amplicons or mutation-bearing ITD DNA fragments of high purity (Figure 3, B–G) and demonstrated a linear relationship between the size and collection time (Figure 2, triangles, R2 = 0.997). We compared the predicted time for a molecule to travel to the end of the capillary (Figure 2, squares) with that experimentally determined (Figure 2, triangles). The actual time to travel to the end of the capillary is only slightly slower than that predicted by extrapolation. It is consistent and predictable. Furthermore, this demonstrates that the resolving capacity is negligibly affected by interruptions of the instrument. Sequencing of the reamplified PCR products confirmed the presence of wild-type amplicons and mutation-bearing amplicons in separate collection tubes (data not shown).
Figure 3.
Fraction collection of mutation-bearing ITD amplicons of the Flt3 gene using reconfigured gel block. A: An artificial mixture of wild-type amplicons of 330 bases and ITD amplicons with mutations of 352, 372, 396, 426, 438, and 498 bases was constructed and subjected to capillary electrophoresis. At 22 minutes, electrophoresis was stopped, and the reconfigured gel block was installed. To achieve fragments at 25-base intervals, the collection tubes were changed at 1-minute intervals based on the prediction that 25-base intervals would capture the individual molecules and the estimation from the slope in Figure 2 (squares, 0.039 minute/base times 25 bases = 0.98 minutes). We collected 14 tubes. The isolated DNA was reamplified, and the predominant isolated DNA fragment was 330 bases from tube 6 (B), 352 bases from tube 7 (C), 372 bases from tube 8 (D), 396 bases from tube 9 (E), 426 and 438 bases from tube 10 (F), and 498 bases from tube 13 (G). ITD peaks are shaded, and size standard peaks are unshaded. x axis, size in bases. y axis, RFUs.
Isolation of Mutation-Bearing ITDs with Minute Peak Heights
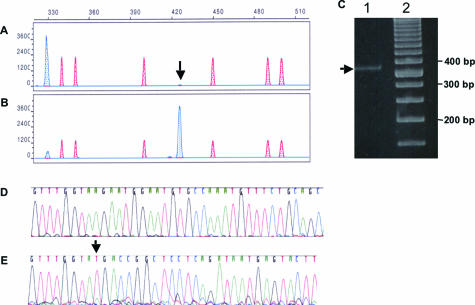
PCR products amplified from a leukemia DNA sample were subjected to capillary electrophoresis, which demonstrated a dominant germline 330-base band of 3898 relative fluorescent units (RFUs) in addition to a minor 426-base ITD peak height of only 110 RFUs (Figure 4A, arrow), which was undetectable by PAGE and ethidium bromide staining (Figure 4C, lane 1). The 426-base mutation represented approximately 2% of the peak area of the total wild-type and mutation-bearing amplicons before isolation and was enriched to 88% in the amplicons after fraction collection and re-amplification (Figure 4B). Successful purification of the ITD mutation-bearing DNA fragment was confirmed by DNA sequencing of the original PCR product demonstrating only the wild-type sequence (Figure 4D) and after fraction collection and reamplification demonstrating the ITD mutation (Figure 4E).
Figure 4.
Isolation of an ITD mutation-containing amplicon with a very small peak height. A: PCR products subjected to capillary electrophoresis demonstrated dominant 330-base wild-type amplicons and minute amounts of a 426-base mutation-bearing ITD amplicon (arrow) with a peak height of 110 RFUs. The reconfigured gel block was installed at 30 minutes. Four tubes were collected at 1-minute intervals. B: A predominant 426-base peak was amplified from the second collection tube. ITD peaks are blue shaded, and size standard peaks are red shaded. x axis, size in bases. y axis, RFUs. C: Ethidium bromide-stained polyacrylamide gel (10%) electrophoresis. Lane 1, germline amplicon of Flt3 gene (330 bases, arrow) and undetected ITD mutation (426 bases with a peak height of 110 RFUs in A). Lane 2, 50-bp DNA ladder (Invitrogen, Carlsbad, CA). Sequencing of the PCR products before fraction collection (D) and after fraction collection and reamplification of the amplicon with the ITD mutation (E). Arrow indicates the insertion site of the ITD.
Isolation of TCR Amplicons That Differ by Only Three Bases
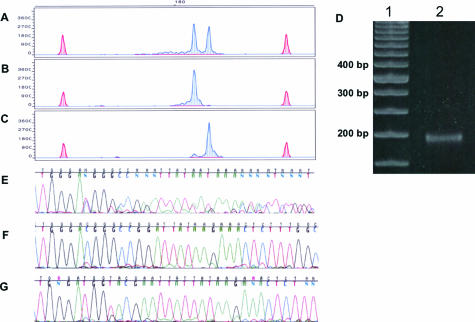
Amplicons of TCR gene rearrangement were subjected to capillary electrophoresis using the standard block and demonstrated two clonal peaks at 183 and 186 bases (Figure 5A), which comigrated as a single band on 10% PAGE (Figure 5D, lane 2). Successful collection of these closely spaced peaks required lowering the voltage of the instrument to 5000 V. Electrophoresis was initiated at 15,000 V and paused at the 16th minute, and the voltage was reduced to 5000 V to determine the interval needed for separation of the two peaks. The two clonal peaks were separated by an interval of 17 seconds. Fraction collection using 5000 V for electrophoresis and 15-second interval collections allowed us to isolate the two dominant peaks in separate collection tubes with greater than 96% purity (Figure 5, B and C). We also successfully purified peaks from a second unrelated sample that also had two clonal TCR peaks, which also differed by only three bases (181 and 184 bases; data not shown). We repeated several samples, and the desired molecules were recovered in the same tubes. Successful purification of these closely spaced peaks was documented by DNA sequencing of the original biclonal sample (Figure 5E) and after purification and reamplification of the individual peaks (Figure 5, F and G). Sequencing of the original sample was uninterpretable, as expected because of superimposition of the sequence, whereas the sequence of the sorted peaks was pure and interpretable. Demonstrating that we can successfully recover TCR molecules that vary by only a few bases indicates that we should be able to recover IgH molecules that have undergone somatic hypermutation involving insertions and deletions.
Figure 5.
Isolation of DNA fragments differing in size by three bases. A: TCR PCR products subjected to capillary electrophoresis with an initial voltage of 15,000 demonstrated a clonal pattern of TCR gene rearrangement presenting with two dominant peaks at 183 and 186 bases and a minute amount of polyclonal background. The reconfigured gel block was installed at 22 minutes, voltage was decreased to 5000 V, and collection tubes were changed at 15-second intervals. Reamplification of the isolated DNA fragments revealed a dominant 183-base peak from tube 10 (B) and a dominant 186-base peak from tube 12 (C). TCR peaks are blue-shaded, and size standard peaks are red-shaded. x axis, size in bases. y axis, RFUs. D: Polyacrylamide gel (10%) electrophoresis. Lane 1, 50-bp DNA ladder. Lane 2, TCR gene rearrangement containing two dominant peaks at 183 and 186 bases by capillary electrophoresis that comigrate as a single band on PAGE. E: Sequencing of the pre-isolated PCR product showing mixed and hence unreadable data as expected in the PCR amplicons. F and G: Sequencing of the reamplified purified fractions documenting that they have been sorted to sufficient purity to obtain a single readable sequence.
Discussion
We considered various strategies for collecting molecules after capillary electrophoresis on the ABI 310. We first considered halting the electrophoresis when the molecule entered the window and then breaking the capillary to recover molecules from the window by centrifugation. However, such an approach was abandoned because it destroys the capillary and might contaminate the lab with PCR products. We next considered running the desired band to the end of the capillary and then trying to expel the polymer containing the desired molecule by inserting critoseal (Oxford, St. Louis, MO) into the proximal end of the capillary. This was unreliable and also resulted in destruction of the capillary. We then considered building an experimental capillary electrophoresis rig, but we abandoned this approach due to safety concerns. Finally, we considered modifying the existing instrument. One advantage of this approach is safety, because the ABI 310 is designed to interrupt the power if the doors are inadvertently opened while the instrument is running. Furthermore, the instrument is capable of generating 15,000 V, and most high-voltage power supplies commonly available in laboratories are incapable of achieving this voltage. The high voltage permits faster migration of the molecules through the capillary, thereby minimizing diffusion of molecules during the time of migration.
In this article, we present a new tool for fraction collection on the ABI 310, a commonly available capillary electrophoresis instrument. We document a linear relationship between the size of the molecule and the time to the detection window and the end of the capillary (Figure 2). This might be considered somewhat surprising because we also considered that molecules might renature after the expected drop in temperature after the capillary exits the heating plate. We demonstrate that this tool can be used to recover molecules that cannot typically be recovered from agarose or PAGE gels either because they cannot be seen (Figure 4) or are so closely spaced that they comigrate as a single band (Figure 5). In the current study, molecules that only differed by 3 bases were easily recovered from two separate samples. We hypothesize that further reduction in voltage would permit recovery of bands that differ in size by only a single base.
Other investigators have reported fraction collectors for protein or DNA molecules based on capillary electrophoresis.10,11,12 However, most of the instruments described are not widely used compared with the ABI 310. High-performance liquid chromatography has also been used for separation and micropreparative DNA fractionation.13,14,15 High-performance liquid chromatography, unlike capillary gel electrophoresis, does not typically have the resolution to permit single base separation.
One can envision future automated DNA analysis instruments capable of separating and characterizing nucleic acid molecules in two or more dimensions. For example, the initial separation could be based on size, where each recovered molecule is then characterized by GC content, in real time. Alternatively, one can envision instruments where molecules are first separated by size and then characterized by base composition or by DNA sequencing. This is reminiscent of multiparameter flow cytometry where specific cell populations can be more distinctly defined according to the expression of multiple antigens. One precedent for sequential analysis in clinical use is the gas chromatograph-mass spectrometer, commonly used in toxicology laboratories. With this instrument, a drug is initially separated by the gas chromatograph and is then bombarded and the fragments analyzed in the MS to produce a “fingerprint.”
In summary, a molecular fraction collection tool was constructed for ABI 310 Genetic Analyzer and was successfully used to easily recover DNA molecules of minute amounts and to purify closely migrating molecules. Further modification might permit automating the fraction collection on this widely available capillary electrophoresis instrument.
Acknowledgments
We acknowledge Dr. Jim Herman, Dr. Anirban Maitra, and Jay Burns (Department of Bioengineering, Johns Hopkins University) for helpful discussions.
Footnotes
Supported by the Sol Goldman Pancreatic Cancer Research Center and by Richard and Nancy Riordan.
References
- Hunkapiller T, Kaiser RJ, Koop BF, Hood L. Large-scale and automated DNA sequence determination. Science. 1991;254:59–67. doi: 10.1126/science.1925562. [DOI] [PubMed] [Google Scholar]
- Heller C. Principles of DNA separation with capillary electrophoresis. Electrophoresis. 2001;22:629–643. doi: 10.1002/1522-2683(200102)22:4<629::AID-ELPS629>3.0.CO;2-S. [DOI] [PubMed] [Google Scholar]
- Gödde R, Akkad DA, Arning L, Dekomien G, Herchenbach J, Kunstmann E, Meins M, Wieczorek S, Epplen JT, Hoffjan S. Electrophoresis of DNA in human genetic diagnostics: state-of-the-art, alternatives and future prospects. Electrophoresis. 2006;27:939–946. doi: 10.1002/elps.200500675. [DOI] [PubMed] [Google Scholar]
- Smith HO. Recovery of DNA from gels. Methods Enzymol. 1980;65:371–380. doi: 10.1016/s0076-6879(80)65048-4. [DOI] [PubMed] [Google Scholar]
- Bjourson AJ, Cooper JE. Band-stab PCR: a simple technique for the purification of individual PCR products. Nucleic Acids Res. 1992;20:4675. doi: 10.1093/nar/20.17.4675. [DOI] [PMC free article] [PubMed] [Google Scholar]
- Wende M, Dorbic T, Wittig B. Novel procedure of elution and concentration of nucleic acids with NACS Prepac minicolumns by electrophoresis. Nucleic Acids Res. 1985;13:9043. doi: 10.1093/nar/13.24.9043. [DOI] [PMC free article] [PubMed] [Google Scholar]
- Murphy KM, Levis M, Hafez MJ, Geiger T, Cooper LC, Smith BD, Small D, Berg KD. Detection of FLT3 internal tandem duplication and D835 mutations by a multiplex polymerase chain reaction and capillary electrophoresis assay. J Mol Diagn. 2003;5:96–102. doi: 10.1016/S1525-1578(10)60458-8. [DOI] [PMC free article] [PubMed] [Google Scholar]
- Berg KD, Glaser CL, Thompson RE, Hamilton SR, Griffin CA, Eshleman JR. Detection of microsatellite instability by fluorescence multiplex polymerase chain reaction. J Mol Diagn. 2000;2:20–28. doi: 10.1016/S1525-1578(10)60611-3. [DOI] [PMC free article] [PubMed] [Google Scholar]
- Lee SC, Berg KD, Racke FK, Griffin CA, Eshleman JR. Pseudo-spikes are common in histologically benign lymphoid tissues. J Mol Diagn. 2000;2:145–152. doi: 10.1016/S1525-1578(10)60630-7. [DOI] [PMC free article] [PubMed] [Google Scholar]
- Berka J, Ruiz-Martinez MC, Hammond R, Minarik M, Foret F, Sosic Z, Kleparnik K, Karger BL. Application of high-resolution capillary array electrophoresis with automated fraction collection for GeneCalling trade mark analysis of the yeast genomic DNA. Electrophoresis. 2003;24:639–647. doi: 10.1002/elps.200390075. [DOI] [PubMed] [Google Scholar]
- Irie T, Oshida T, Hasegawa H, Matsuoka Y, Li T, Oya Y, Tanaka T, Tsujimoto G, Kambara H. Automated DNA fragment collection by capillary array gel electrophoresis in search of differentially expressed genes. Electrophoresis. 2000;21:367–374. doi: 10.1002/(SICI)1522-2683(20000101)21:2<367::AID-ELPS367>3.0.CO;2-1. [DOI] [PubMed] [Google Scholar]
- Müller O, Foret F, Karger BL. Design of a high-precision fraction collector for capillary electrophoresis. Anal Chem. 1995;67:2974–2980. doi: 10.1021/ac00113a036. [DOI] [PubMed] [Google Scholar]
- Oefner PJ, Huber CG, Umlauft F, Berti GN, Stimpfl E, Bonn GK. High-resolution liquid chromatography of fluorescent dye-labeled nucleic acids. Anal Biochem. 1994;223:39–46. doi: 10.1006/abio.1994.1543. [DOI] [PubMed] [Google Scholar]
- Marino MA, Devaney JM, Smith JK, Girard JE. Sequencing using capillary electrophoresis of short tandem repeat alleles separated and purified by high performance liquid chromatography. Electrophoresis. 1998;19:108–118. doi: 10.1002/elps.1150190119. [DOI] [PubMed] [Google Scholar]
- zur Stadt U, Eckert C, Rischewski J, Michael K, Golta S, Muller M, Schneppenheim R, Kabisch H. Identification and characterisation of clonal incomplete T-cell-receptor Vdelta2-Ddelta3/Ddelta2-Ddelta3 rearrangements by denaturing high-performance liquid chromatography and subsequent fragment collection: implications for minimal residual disease monitoring in childhood acute lymphoblastic leukemia. J Chromatogr B Analyt Technol Biomed Life Sci. 2003;792:287–298. doi: 10.1016/s1570-0232(03)00318-0. [DOI] [PubMed] [Google Scholar]


