Abstract
R− cells are 3T3-like fibroblasts generated from mouse embryos nullizygous for a targeted disruption of the genes encoding the type 1 insulin-like growth factor (IGF) receptor (IGF1R). These cells fail to proliferate in serum-free medium supplemented with purified growth factors, in contrast to their wild-type counterparts. However, when R− cells overexpress the insulin receptor from a stably integrated plasmid, R−/IR cells, they become capable of growing in serum-free medium supplemented solely with insulin or IGF-II, but not with IGF-I. Moreover, the introduction into R−/IR cells of an additional plasmid expressing IGF-II causes these cells to proliferate in serum-free medium without growth factor supplementation. From these results, we conclude that IGF-II can stimulate cell proliferation not only through its cognate IGF1R but also through the insulin receptor.
The mitogenic signaling of insulin-like growth factors (IGF-I and IGF-II) is mediated by the type 1 IGF receptor (IGF1R), a heterotetrameric (α2β2) transmembrane glycoprotein with tyrosine kinase activity and a 70% identity to the insulin receptor (IR) (1–3). In mammals, turnover of excess IGF-II is served by the cation-independent mannose 6-phosphate receptor acting as the type 2 IGF receptor (IGF2R) (4–6).
Genetic evidence from gene targeting experiments indicated that, in addition to IGF1R, an unknown signaling receptor (XRe) mediates in part the growth-promoting function of IGF-II during mouse embryonic development (7–9). The existence of XRe was first inferred from the observation that the growth retardation of double mutants lacking both IGF-II and IGF1R (30% of normal birthweight) is more severe than that manifested in either class of single mutants (60% and 45% of normal weight for the Igf2 and Igf1r nullizygotes, respectively). The finding that double mutants lacking both IGF-I and IGF1R do not differ in phenotype from Igf1r nullizygotes indicates that IGF-I must interact exclusively with the IGF1R in embryos. There must therefore be an IGF-II-specific function through a putative XRe. Indeed, in mutants lacking IGF2R, excess of IGF-II in the absence of IGF2R-mediated turnover apparently overstimulates IGF1R and causes overgrowth (140% of normal birthweight) and perinatal lethality due to heart defects. These mutants are completely rescued if they carry a second mutation eliminating either IGF-II or IGF1R. In the latter case, the normal embryonic development of Igf1r/Igf2r double mutants apparently occurs by signaling of IGF-II, being in excess, via XRe, since triple mutants lacking IGF1R, IGF2R, and IGF-II are nonviable dwarfs with 30% of normal size (9).
Recently, genetic evidence from double mutants lacking both IGF1R and the IR indicated that XRe is actually IR (A.L., D. Accili, S. Taylor, and A.E., unpublished results). We sought, therefore, to provide complementary evidence by examining directly the IGF-II/IR interaction in cultured cells.
Previously, using a protocol designed for the generation of 3T3 cells, we developed a fibroblastic cell line lacking IGF1R (R− cells) from mouse embryos nullizygous for a targeted disruption of the Igf1r gene (10, 11). Although these cells grow at a reduced rate in medium containing 10% serum, they are unable to proliferate in serum-free medium (SFM) supplemented with growth factors, in contrast to wild-type embryonic fibroblasts or 3T3 cells expressing the normal number of IGF1Rs (10, 11). Notably, R− cells do not respond appreciably to IGF-II or insulin, although they do express 5,000 IRs per cell. We reasoned, however, that IGF-II added to SFM could potentially exert mitogenic activity if the number of IRs was increased. A unique model to test this hypothesis was provided by R− cells overexpressing IR from stably integrated plasmids, R−/IR cells (12). Because of the absence of IGF1R, the R−/IR cells allowed direct examination of the IGF-II mitogenic effect through IR, which would have been obscured in other cell lines possessing IGF1R. As we show here, IGF-II (but not IGF-I) can indeed stimulate cell proliferation through IR.
MATERIALS AND METHODS
Cell Cultures.
R− cells, lacking IGF1Rs and possessing 5 × 10³ IRs per cell, have been described and characterized previously (10–13). Also available were two R− cell derivatives (R−/IR cells and R−/IR clone 2) expressing 5 × 10⁵ and 105 IRs per cell, respectively, from a stably integrated plasmid carrying human IR cDNA (12). Additional derivatives of R− and R−/IR cells constitutively overexpressing IGF-II (R−/IGF-II and R−/IR/IGF-II cells) were generated by transfecting the cells with a plasmid (kindly provided by Lee Helman, National Cancer Institute, Bethesda), which carries a full-length, wild-type human IGF-II cDNA (14) driven by a simian virus 40 promoter, and also contains the neomycin-resistance gene, for selection of clones in medium containing G418 (1 mg/ml; GIBCO). The transfected plasmid produces pre-pro-IGF-II that can be processed into the mature IGF-II of 67 amino acids (15, 16).
Determination of Cell Growth.
For all experiments assessing proliferative effects, cells were seeded at a density of 2.5 × 10³/cm2 in medium containing 10% fetal bovine serum and allowed to attach for 24 hr. The cultures were then placed in SFM supplemented with 0.1% bovine serum albumin, and 50 μg/ml transferrin and with or without purified growth factors (Sigma, GIBCO/BRL), and cell numbers were determined after 3 days in culture.
DNA Synthesis.
Cells were seeded at 2.5 × 10⁴ per 35-mm dish on coverslips in medium containing 10% fetal bovine serum and allowed to attach for 24 hr. The cultures were then placed into SFM supplemented with 0.1% bovine serum albumin and 50 μg/ml transferrin for 96 hr, to become quiescent prior to the addition of growth factors. Tritiated thymidine (0.5 μCi/ml; 1 μCi = 37 kBq) was added at the same time as growth factors, and the incubations were continued for 24 hr. The cells were then fixed in cold methanol and autoradiographed. The percentage of labeled cells was determined by scoring a total of 1,000 cells.
Transformation Assay.
To determine anchorage-independent growth as described (10, 11), 103 cells were seeded in soft agar and colonies (>125 μm) were counted after 2 weeks in culture.
Immunoprecipitation and Immunobloting.
Cells were incubated in SFM for 48 hr and then stimulated with 50 ng/ml insulin (Sigma), IGF-I, or IGF-II (GIBCO/BRL). Cells lysates (300 μg of protein) were immunoprecipitated with the indicated antibody in HNTG buffer [20 mM Hepes, pH 7.5/150 mM NaCl/0.1% Triton X-100/10% (vol/vol) glycerol/0.2 mM sodium orthovanadate/0.2 mM phenylymethylsulfonyl fluoride/2 μg/ml aprotinin). The immunoprecipitated proteins were resolved on 4–15% gradient polyacrylamide gels containing SDS, and electroblotted onto nitrocellulose filters. For immunoblotting, membranes were blocked with 5% BSA or 5% nonfat milk in TBST buffer (10 mM Tris·HCl, pH 8.0/150 mM NaCl/0.1% Tween 20) overnight at 4°C, and then probed with the indicated antibodies, followed by incubation with anti-rabbit or anti-mouse IgG conjugated with horseradish peroxidase (Oncogene Science). To visualize signal, the blots were developed with the ECL system (Amersham). IR was immunoprecipitated with a monoclonal anti-IR antibody (Ab-3; Oncogene Science) and detected by immunoblotting using a polyclonal antibody against the IR β subunit (Transduction Laboratories). IRS-1 and IRS-2 were immunoprecipitated and detected with corresponding polyclonal antibodies (Upstate Biotechnology, Lake Placid, NY). A polyclonal and a monoclonal anti-Shc antibody (Transduction Laboratories) were used for immunoprecipitation and detection of Shc, respectively. To detect phosphorylation of immunoprecipitated proteins, we used an anti-phosphotyrosine horseradish peroxidase-conjugated antibody (PY20; Transduction Laboratories). The relative level of IGF-II secreted in conditioned medium by various cell lines was assessed by Western analysis as described (9).
Mitogen-Activated Protein (MAP) Kinase Assay.
The level of MAP kinase (p42mapk) activation, analyzed by densitometry with an UltroScan XL apparatus (Pharmacia LKB), was determined as described (17).
RNA Blots.
Total cell RNA was extracted as described (18) and examined by Northern analysis (19). The probe used for detection of Igf2 transcripts was a SacII/BamHI fragment of Igf2 cDNA (14) that was labeled by random priming (20).
RESULTS
IGF-II Stimulates Proliferation of R− Cells Overexpressing the Insulin Receptor.
R− cells (see the introduction and Materials and Methods), which are totally devoid of IGF1Rs (10, 11) and possess only 5 × 10³ IRs per cell (12, 21), are unable to grow in SFM supplemented with growth factors. In contrast, derivatives of R− cells with a stably integrated expression plasmid carrying a human IR cDNA, which possess either 5 × 10⁵ or 105 IRs per cell (R−/IR and R−/IR clone 2 cells, respectively; ref. 12), can grow in SFM supplemented solely with insulin (ref. 21; see also below).
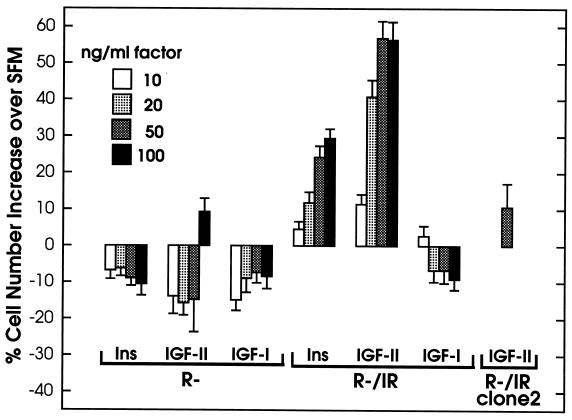
To examine further ligand-dependent mitogenesis mediated by IR, we tested R−/IR cells for their ability to grow in SFM supplemented solely with insulin, IGF-II, or IGF-I, using in parallel R− cells as negative controls. The results were reproducible in four independent experiments performed by three different investigators. A typical example of the data is shown in Fig. 1. We observed that both insulin and IGF-II stimulated the growth of R−/IR cells in a concentration-dependent manner, with the mitogenic effect reaching practically a plateau for either ligand at 50 ng/ml (Fig. 1). Interestingly, at each concentration tested, IGF-II appeared to stimulate growth at least 2-fold better than insulin. As expected, R− cells were not stimulated appreciably, except with the highest IGF-II concentration used (100 ng/ml), suggesting that the relatively small number of IRs (5 × 10³) are capable of mitogenic action when overstimulated. This small effect was comparable in magnitude with that observed with R−/IR cells (5 × 10⁵ IRs), when 10 ng/ml IGF-II or 20 ng/ml insulin was tested. It was also comparable with the effect of 50 ng/ml IGF-II on R−/IR clone 2 cells (105 IRs), further indicating that the response to this factor increased with increasing number of IRs (Fig. 1). IGF-I had no effect on R− cells as expected, but, in contrast to insulin and IGF-II, also failed to stimulate the proliferation of R−/IR cells, even at a concentration of 100 ng/ml (Fig. 1). R− cells and their derivatives do not respond to IGF-I even at concentrations above 200 ng/ml (11). To demonstrate that the particular IGF-I preparation used in these experiments was active, we tested its effect on p6 cells overexpressing IGF1R (22); we found that at a concentration of 20 ng/ml the cell number was increased 2.8-fold over that observed with SFM alone (results not shown).
Figure 1.
Effects of insulin (Ins), IGF-II, and IGF-I on the growth of R− and R−/IR cells. Cells were plated and then stimulated by addition of the indicated ligands at the indicated concentrations. Control cultures in SFM alone were also propagated in parallel, for comparison. Cell numbers were determined after 3 days in culture. The results (averages of triplicate determinations with standard errors) are expressed as percent values of cell numbers over those scored in the corresponding control cultures. Results obtained with a single concentration of IGF-II using cells (R−/IR clone2) with an intermediate number of IRs between those expressed in R− and R−/IR cells are also shown.
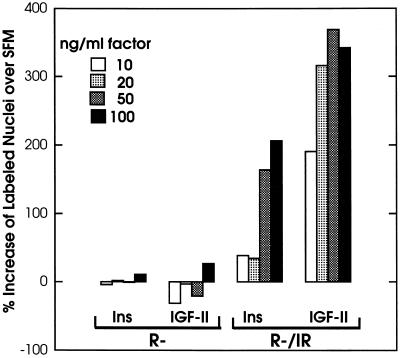
The effects of IGF-II and insulin on growth were correlated with stimulation of DNA synthesis assessed by [3H]thymidine incorporation (Fig. 2). Comparison of the percentages of labeled cells in SFM alone and in the presence of ligands showed stimulation by both factors, except that the observed increase was again higher for IGF-II (approximately 2-fold and 3.5-fold increments for insulin and IGF-II, respectively, at the highest concentrations tested). As expected, the R− cells used as negative controls were insensitive to both ligands (Fig. 2). We tested other clones, overexpressing the IR, for their ability to respond to IGF-II with DNA synthesis. In one of these clones, the percentage of cells labeled by [3H]thymidine (over a period of 24 hr) increased from 3.5% in SFM to 50.2% in SFM supplemented with IGF-II. The same concentration of IGF-II had no effect on R− cells or on R− stably transfected with an empty vector (not shown).
Figure 2.
Effect of insulin and IGF-II on DNA synthesis in R− and R−/IR cells. Quiescent cells were incubated in the presence of [3H]thymidine for 24 hr either in SFM alone (control) or in SFM supplemented with the indicated ligands at the indicated concentrations. The percentage of labeled nuclei in each culture was determined at the end of the incubation. The results (averages of triplicate determinations) represent ratios of the values counted for stimulated and control cells (x100).
IR-Mediated Signaling.
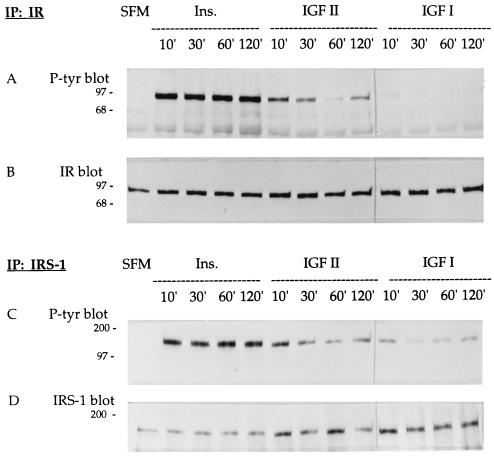
To further examine ligand/receptor interactions, we investigated the autophosphorylation of IR for up to 2 hr after stimulation of R−/IR cells with insulin (50 ng/ml), IGF-II (50 ng/ml) or IGF-I (50 ng/ml). Following immunoprecipitation of IR from cell extracts with a cognate antibody, PAGE fractionation, and blotting, IR was analyzed either with an anti-phosphotyrosine antibody (Fig. 3A), to assess autophosphorylation, or with an anti-IR antibody (Fig. 3B), to ensure that the amount of the receptor was essentially the same in all lanes. We observed that all three tested ligands caused IR autophosphorylation, but IGF-I was much less effective than insulin or IGF-II. This is consistent with previous evidence indicating that the affinity of IGF-II for IR is 5- to 10-fold higher than that of IGF-I (1, 23).
Figure 3.
Phosphorylation of IR and IRS-1 in R−/IR cells. Immunoblot analyses of cell lysates initially immunoprecipitated with an antibody against IR (A and B) or IRS-1 (C and D). The membranes were treated with an anti-phosphotyrosine antibody (A and C), with an anti-IR antibody (B), or with an anti-IRS-1 antibody (D). In all gels, the first lane corresponds to lysates of cells grown in SFM. The other lanes are from lysates of cells stimulated with insulin (50 ng/ml), IGF-II (50 ng/ml), or IGF-I (50 ng/ml) for the indicated number of minutes. Numbers on the left are kDa.
Cell lysates from similar experiments were also immunoprecipitated with an antibody to IRS-1, a major substrate of the IR (24–26). Blots were then analyzed either with an anti-phosphotyrosine antibody (Fig. 3C) or with an anti-IRS-1 antibody (this was a loading control, and does not reflect the absolute amounts of IRS-1 in the lysates; Fig. 3D). All three ligands caused tyrosyl phosphorylation of IRS-1, with insulin being the most effective and IGF-I the least effective. This experiment was repeated several times with brief incubation periods, yielding essentially the same results (not shown).
The same conditions were used for the detection of IRS-2 (27) and Shc proteins (28). We observed that, after stimulation with either insulin or IGF-II for 10 min, the extent of tyrosyl phosphorylation was similar, although neither of these ligands was as effective as epidermal growth factor in inducing phosphorylation of Shc (results not shown).
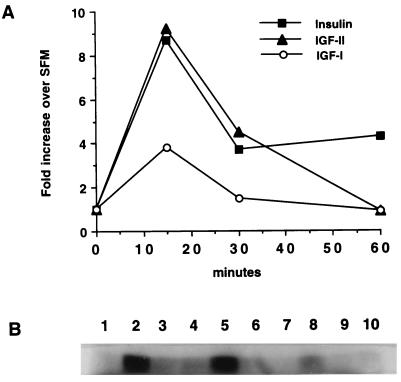
Finally, we determined MAP kinase activity in R−/IR cells stimulated for various time intervals with insulin, IGF-II, or IGF-I, since it was previously reported that sustained activation of the MAP kinases may be necessary for mitogenic stimulation of cells in culture (for a review see ref. 29). All three ligands increased MAP kinase activity at 15 min after stimulation (Fig. 4), but the stimulation by insulin or IGF-II was 2-fold higher than that caused by IGF-I. By 60 min, however, only insulin stimulation continued to result in increased MAP kinase activity, while at 6 hr all values had returned to basal levels (data not shown).
Figure 4.
MAP kinase activity in R−/IR cells after ligand stimulation. Quiescent cells were stimulated with the indicated ligands (50 ng/ml each) for 15, 30, and 60 min or placed in SFM alone (control). After measurement of MAP kinase activity values (B) and densitometric analysis, the increase in each sample relative to the control was plotted (A). The lanes in B are 1, SFM; 2–4, insulin; 5–7, IGF-II; and 8–10, IGF-I.
R−/IR Cells Expressing IGF-II Proliferate in SFM Without Growth Factor Supplementation.
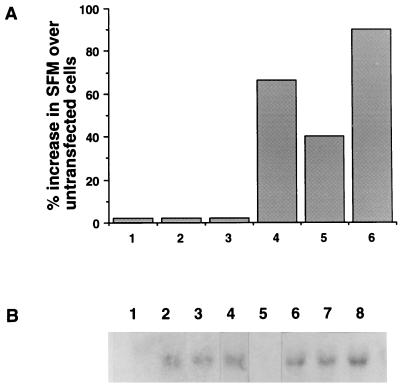
We reasoned that, if IGF-II can stimulate the growth of R−/IR cells, stable transfection into these cells of a plasmid expressing the human IGF-II should allow proliferation in SFM by autocrine action. After generation of several transfected clones, three of them were selected and shown to express substantial levels of IGF2 mRNA (Fig. 5B, lanes 6–8). These clones were able to grow in SFM without growth factor supplementation (Fig. 5A, bars 4–6), confirming that IGF-II can stimulate the proliferation of cells overexpressing IR. In contrast, when the plasmid expressing the IGF2 cDNA was transfected into R− cells, selected clones were unable to grow in SFM alone (Fig. 5A, bars 1–3), although they did express IGF2 mRNA (Fig. 5B, lanes 2–4). Thus, constitutive expression of IGF-II is unable to sustain growth in SFM when the number of IRs is low.
Figure 5.
Growth of R−/IGF-II and R−/IR/IGF-II cells in SFM. (A) The growth of R−/IGF-II and R−/IR/IGF-II cells in SFM was determined 3 days after plating, and is expressed as percent increase over the growth of untransfected cells also placed in SFM. Bars 1–3, R−/IGF-II cells clones 7, 10, and m; bars 4–6, R−/IR/IGF-II cells clones 5, 6, and 7. (B) Northern analysis of Igf2 mRNA expression. Lanes: 1, R− cells; 2–4, clones 7, 10, and m of R−/IGF-II cells; 5, R−/IR cells; 6–8, clones 5, 6, and 7 of R−/IR/IGF-II cells.
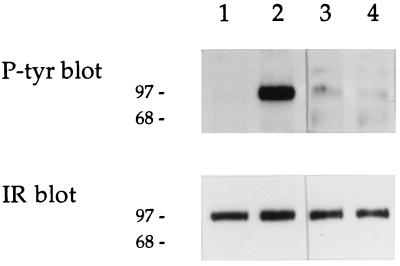
Western analysis to verify directly the presence of secreted IGF-II indicated that the level of this factor was high in conditioned media from R−/IGF-II and R−/IR/IGF-II cells, while the media from control R− or R−/IR cells did not yield a detectable signal (data not shown). To demonstrate further that the IGF-II secreted by R−/IR/IGF-II cells was active, we examined whether medium conditioned by some of these clones could autophosphorylate IRs present on the surface of R−/IR cells, used as reporters. The results were positive (Fig. 6, lanes 3 and 4), although the IR autophosphorylation caused by the conditioned media was not as efficient as that observed using 50 ng/ml IGF-II (Fig. 6, lane 2).The difference is due to the fact that, although the concentrations of IGF-II in the conditioned media varied according to the modalities used, they never went beyond 5 ng/ml.
Figure 6.
Effect of conditioned medium from R−/IR/IGF-II cells on IR autophoshorylation. Conditioned medium from clones 5 and 6 of R−/IR/IGF-II cells was collected and tested for its ability to stimulate IR autophosphorylation in reporter R−/IR cells. Cell lysates were analyzed (Upper and Lower) as described for Fig. 3 A and B, respectively. Lanes: 1, SFM; 2, stimulation with IGF-II (50 ng/ml) for 10 min; 3 and 4, stimulation with conditioned medium from clones 5 and 6 of R−/IR/IGF-II cells, respectively.
Growth in Soft Agar.
R− cells stably transfected with a variety of cellular and viral oncogenes, such as simian virus 40 large T antigen (10), an activated ras (11), and E5 protein of bovine papilloma (30), or overexpressing growth factor receptors (12, 31–33) and IRS-1 (21), are incapable of forming colonies in soft agar. In contrast, 3T3-like cells with a wild-type number of IGF1Rs are readily transformed under all of these conditions.
Although R−/IR cells overexpressing IRs are also incapable of forming a significant number of colonies in soft agar (12), we re-examined their transformation potential under supplementation with growth factors. However, even under these conditions, the number of colonies formed in soft agar was not significantly above background (Table 1). Similar negative results were obtained by testing R−/IR/IGF-II clones (Table 1). In contrast, the control p6 cells overexpressing IGF1R (22), which were used to monitor the procedure, were able to form many colonies. These results reemphasize our previous conclusion that IGF1R, but not IR, plays an important role in the establishment and maintenance of the transformed phenotype (10, 11).
Table 1.
Soft agar growth of R−/IR and R−/IR/IGF-II cells
| Cell line | No. of colonies in soft agar
|
|||
|---|---|---|---|---|
| 10% serum | With insulin | With IGF-II | With IGF-I | |
| R− | 0, 0 | 0, 0 | 0, 0 | 0, 0 |
| R−/IR | 1, 2 | 3, 5 | 5, 8 | 2, 3 |
| R−/IR/IGF-II cl.5 | 0, 0 | |||
| R−/IR/IGF-II cl.6 | 0, 0 | |||
| R−/IR/IGF-II cl.7 | 0, 0 | |||
| p6 | 50, 60 | |||
Colony formation in soft agar was determined as described in the text. Results of duplicate experiments are shown. Growth factors were used at a concentration of 100 ng/ml.
DISCUSSION
Insulin exerts predominantly metabolic effects through IR, while the actions of the IGFs that are mediated by IGF1R are mostly mitogenic. In fact, experiments with chimeric receptors have shown that the β subunit of IGF1R is 10-fold more mitogenic than the β subunit of IR (34). It is well established, however, that insulin in supraphysiological concentrations can stimulate the proliferation of cultured cells by cross-interaction with IGF1R. While the affinity of insulin binding to IGF1R is 1/500 to 1/1000 that of the IGFs, IGF-II can bind to IR quite strongly, with an affinity that is 1/10 that of insulin. The affinity of IGF-I is 1/50 to 1/100 that of insulin (1).
The novel conclusion that can be reached from the evidence that we have presented is that the cross-interaction properties between the IGF and insulin systems is functionally reciprocal, since IGF-II can stimulate cell proliferation by interacting with IR. This observation was made possible by the use of R− cells (10, 11), which are devoid of IGF1Rs. However, neither IGF-II nor insulin itself could stimulate a substantial growth of R− cells possessing a relatively low number of IRs, and IR overexpression (generation of R−/IR cells) became necessary, to demonstrate a measurable mitogenic response. On the other hand, in the absence of IGF1R, the R−/IR cells and their derivatives overexpressing IGF-II remained refractory to transformation and failed to form a significant number of colonies in soft agar, despite the restoration of their proliferative potential. We have previously reported that reintroduction of the IGF-IR into R− cells and their derivatives restores their sensitivity to IGF-I (11, 12).
The evidence supporting our main conclusion can be summarized as follows. First, the mitogenic action of IGF-II on R−/IR cells is mediated by IR, and not another unidentified receptor. If the latter were the case, IGF-II should have been able to also stimulate the R− progenitor cells, even at lower concentrations of the ligand. Only very high concentrations of IGF-II can slightly stimulate R− cells. Second, the response of R−/IR cells to IGF-II increased with increasing number of IRs expressed. Third, several clones of R−/IR responded to IGF-II, while R− cells and R− cells stably transfected with the empty vector did not. Finally, IGF-II acted in an autocrine fashion, and the R−/IR cells carrying a stably integrated plasmid expressing IGF2 were able to grow in SFM alone. While the increase in R−/IR cell numbers promoted by IGF-II was not spectacular, it is important to take into consideration that proliferation under the stringent conditions of SFM supplemented by purified growth factors is always modest. On the other hand, when induction of DNA synthesis was measured by a standard assay, the mitogenic stimulation by IGF-II was 3.5-fold higher than that observed with SFM alone.
Interestingly, in contrast to insulin and IGF-II, IGF-I failed to stimulate the growth of R−/IR cells. This correlates well with the genetic data indicating a lack of IGF-I/IR interaction in embryos (see Introduction), and with the aforementioned relative binding affinities of the ligands for IR, but a causal relationship cannot be established from the available evidence. It remains to be seen whether the inability of IGF-I to elicit a mitogenic effect is related to the consistently observed poor cellular response, in terms of IR autophosphorylation, tyrosyl phosphorylation of IRS-1, and MAP kinase activity, in comparison with insulin and IGF-II. However, while IRS-1 is certainly involved in mitogenic signaling by either insulin or the IGFs (21, 35, 36), our data suggest ligand-dependent differences in downstream signaling events. Thus, IGF-II was less effective than insulin in inducing autophosphorylation of the IR, tyrosyl phosphorylation of IRS-1, and activation of MAP kinase, and yet, its mitogenicity on R−/IR cells was significantly stronger than that of insulin. We do not wish to belabor this last point: the stronger stimulation by IGF-II, with respect to insulin itself, could be due to trivial causes (half-lives of the two peptides, for instance), although more intriguing alternatives (conformational changes?) cannot be ruled out at the present moment.
Our functional assays on cell proliferation, in conjunction with the molecular data that we have presented, provide direct evidence extending the available genetic results (see Introduction), which indicated that the growth-promoting function of IGF-II during mouse embryogenesis is mediated in part by IR. It is not unlikely that the IGF-II/IR interaction revealed from these studies is also important for the level of growth that the short-stature African pygmies can attain. It was recently proposed that decreased IGF1R expression and signaling is involved in the manifestation of the pygmy phenotype (37). Although the IGF1R gene appears to be intact in Efe pygmies, the steady-state level of IGF1R mRNA assayed in lymphoblast cell lines was approximately 2–13% of the control value, while the levels of IR mRNA were normal. Moreover, the number of IGF-I-binding sites per pygmy cell line was 5.5–22% of the control value, and the cells remained unresponsive to high concentrations of IGF-I in clonal proliferation assays (38). In contrast, the pygmy cell lines were growth-stimulated by IGF-II (D. W. Golde, personal communication). It remains to be seen whether this IGF-II action is mediated by IR, as can be hypothesized. Finally, our finding may also explain the observation that certain human cancers overexpressing both IGF-II and the IR seem to be particularly aggressive (39, 40).
Acknowledgments
We thank David Golde for communicating unpublished information and Lee Helman for providing an IGF2-expressing plasmid. This work was supported by Grants CA-53484 to R.B. and HD-34526 to A.E. from the National Institutes of Health.
ABBREVIATIONS
- IGF-I or II
insulin-like growth factor I or II
- IGF1R
type 1 IGF receptor
- IR
insulin receptor
- IGF2R
type 2 IGF receptor
- IRS
insulin receptor substrate
- SFM
serum-free medium
- MAP
mitogen-activated protein
References
- 1.De Meyts P, Wallach B, Christofferson C T, Urso B, Gronskov K, Latus L-J, Yakushiji F, Ilondo M M, Shymco R M. Horm Res. 1994;42:152–169. doi: 10.1159/000184188. [DOI] [PubMed] [Google Scholar]
- 2.LeRoith D, Werner H, Beitner-Johnson D, Roberts C T. Endocr Rev. 1995;16:143–163. doi: 10.1210/edrv-16-2-143. [DOI] [PubMed] [Google Scholar]
- 3.Rubin R, Baserga R. Lab Invest. 1995;73:311–331. [PubMed] [Google Scholar]
- 4.Nissley P, Kiess W, Sklar M. In: Insulin-like Growth Factors: Molecular and Cellular Aspects. LeRoith D, editor. Boca Raton, FL: CRC; 1991. pp. 111–150. [Google Scholar]
- 5.Kornfeld S. Annu Rev Biochem. 1992;61:307–330. doi: 10.1146/annurev.bi.61.070192.001515. [DOI] [PubMed] [Google Scholar]
- 6.Ludwig T, Borgne R, Hoflack B. Trends Cell Biol. 1995;5:202–206. doi: 10.1016/s0962-8924(00)89000-5. [DOI] [PubMed] [Google Scholar]
- 7.Liu J-P, Baker J, Perkins A S, Robertson E J, Efstratiadis A. Cell. 1993;75:59–72. [PubMed] [Google Scholar]
- 8.Baker J, Liu J-P, Robertson E J, Efstratiadis A. Cell. 1993;73:73–82. [PubMed] [Google Scholar]
- 9.Ludwig T, Eggenschwiler J, Fisher P, D’Ercole J P, Davenport M L, Efstratiadis A. Dev Biol. 1996;177:517–535. doi: 10.1006/dbio.1996.0182. [DOI] [PubMed] [Google Scholar]
- 10.Sell C, Rubini M, Rubin R, Liu J-P, Efstratiadis A, Baserga R. Proc Natl Acad Sci USA. 1993;90:11217–11221. doi: 10.1073/pnas.90.23.11217. [DOI] [PMC free article] [PubMed] [Google Scholar]
- 11.Sell C, Dumenil G, Deveaud C, Miura M, Coppola D, DeAngelis T, Rubin R, Efstratiadis A, Baserga R. Mol Cell Biol. 1994;14:3604–3612. doi: 10.1128/mcb.14.6.3604. [DOI] [PMC free article] [PubMed] [Google Scholar]
- 12.Miura M, Surmacz E, Burgaud J L, Baserga R. J Biol Chem. 1995;270:22639–22644. doi: 10.1074/jbc.270.38.22639. [DOI] [PubMed] [Google Scholar]
- 13.Hongo A, D’Ambrosio C, Miura M, Morrione A, Baserga R. Oncogene. 1996;12:1231–1238. [PubMed] [Google Scholar]
- 14.Bell G I, Merryweather J P, Sanchez-Pescador R, Stempien M M, Priestley I, Scott J, Rall U B. Nature (London) 1984;310:773–777. doi: 10.1038/310775a0. [DOI] [PubMed] [Google Scholar]
- 15.Hylka V W, Teplow D B, Kent S B H, Straus D S. J Biol Chem. 1985;260:14417–14420. [PubMed] [Google Scholar]
- 16.Hylka V W, Straus D S. Biochim Biophys Acta. 1990;1051:6–13. doi: 10.1016/0167-4889(90)90167-c. [DOI] [PubMed] [Google Scholar]
- 17.Li S, Resnicoff M, Baserga R. J Biol Chem. 1996;271:12254–12260. doi: 10.1074/jbc.271.21.12254. [DOI] [PubMed] [Google Scholar]
- 18.Chomczynski P, Sacchi N. Anal Biochem. 1987;162:156–159. doi: 10.1006/abio.1987.9999. [DOI] [PubMed] [Google Scholar]
- 19.Thomas P S. Methods Enzymol. 1983;100:255–266. doi: 10.1016/0076-6879(83)00060-9. [DOI] [PubMed] [Google Scholar]
- 20.Feinberg A P, Vogelstein B. Anal Biochem. 1983;132:6–13. doi: 10.1016/0003-2697(83)90418-9. [DOI] [PubMed] [Google Scholar]
- 21.D’Ambrosio C, Keller S R, Morrione A, Lienhard G E, Baserga R, Surmacz E. Cell Growth Diff. 1995;6:557–562. [PubMed] [Google Scholar]
- 22.Pietrzkowski Z, Lammers R, Carpenter G, Soderquist A M, Limardo M, Phillips P D, Ullrich A, Baserga R. Cell Growth Diff. 1992;3:199–205. [PubMed] [Google Scholar]
- 23.Zhang B, Roth R A. J Biol Chem. 1992;267:18320–18328. [PubMed] [Google Scholar]
- 24.Myers M J, Sun X J, Cheatham B, Jachna B R, Glasheen E M, Backer J M, White M F. Endocrinol. 1993;132:1421–1430. doi: 10.1210/endo.132.4.8384986. [DOI] [PubMed] [Google Scholar]
- 25.White M F, Kahn C R. J Biol Chem. 1994;269:1–4. [PubMed] [Google Scholar]
- 26.Keller S, Lienhard G. Trends Cell Biol. 1994;4:115–119. doi: 10.1016/0962-8924(94)90065-5. [DOI] [PubMed] [Google Scholar]
- 27.Araki E, Lipes M A, Patti M E, Bruning J C, Haag B, III, Johnson R S, Kahn C R. Nature (London) 1994;372:186–190. doi: 10.1038/372186a0. [DOI] [PubMed] [Google Scholar]
- 28.Pronk G J, McGlade J, Pelicci G, Pawson T, Bos J L. J Biol Chem. 1993;268:5748–5753. [PubMed] [Google Scholar]
- 29.Marshall C J. Cell. 1995;80:179–186. doi: 10.1016/0092-8674(95)90401-8. [DOI] [PubMed] [Google Scholar]
- 30.Morrione A, DeAngelis T, Baserga R. J Virol. 1995;69:5300–5303. doi: 10.1128/jvi.69.9.5300-5303.1995. [DOI] [PMC free article] [PubMed] [Google Scholar]
- 31.Coppola D, Ferber A, Miura M, Sell C, D’Ambrosio C, Rubin R, Baserga R. Mol Cell Biol. 1994;14:4588–4595. doi: 10.1128/mcb.14.7.4588. [DOI] [PMC free article] [PubMed] [Google Scholar]
- 32.Steller M A, Delgado C H, Zou Z. Proc Natl Acad Sci USA. 1995;92:11970–11974. doi: 10.1073/pnas.92.26.11970. [DOI] [PMC free article] [PubMed] [Google Scholar]
- 33.DeAngelis T, Ferber A, Baserga R. J Cell Physiol. 1995;164:214–221. doi: 10.1002/jcp.1041640126. [DOI] [PubMed] [Google Scholar]
- 34.Lammers R, Gray A, Schlessinger J, Ullrich A. EMBO J. 1989;8:1369–1375. doi: 10.1002/j.1460-2075.1989.tb03517.x. [DOI] [PMC free article] [PubMed] [Google Scholar]
- 35.Waters S B, Yamauchi K, Pessin J E. J Biol Chem. 1993;268:22231–22234. [PubMed] [Google Scholar]
- 36.Rose D W, Satiel A R, Majumdar M, Decker S J, Olefsky J M. Proc Natl Acad Sci USA. 1994;91:797–801. doi: 10.1073/pnas.91.2.797. [DOI] [PMC free article] [PubMed] [Google Scholar]
- 37.Hattori Y, Vera J C, Rivas C I, Bersch N, Bailey R C, Geffner M E, Golde D W. J Clin Endocrinol Metab. 1996;81:2257–2263. doi: 10.1210/jcem.81.6.8964861. [DOI] [PubMed] [Google Scholar]
- 38.Geffner M E, Bersch N, Bailey R C, Golde D W. J Clin Endocrinol Metab. 1995;80:3732–3738. doi: 10.1210/jcem.80.12.8530626. [DOI] [PubMed] [Google Scholar]
- 39.Cullen K J, Lippman M E, Chow D, Hill S, Rosen N, Zwiebel J A. Mol Endocrinol. 1992;69:91–100. doi: 10.1210/mend.6.1.1310798. [DOI] [PubMed] [Google Scholar]
- 40.Steller M A, Delgado C H, Bartels C J, Woodsworth C D, Zou Z. Cancer Res. 1996;56:1761–1765. [PubMed] [Google Scholar]


