Abstract
The first differentiative event in mammalian development is segregation of the inner cell mass and trophectoderm (TE) lineages. The epithelial TE cells pump fluid into the spherical blastocyst to form the blastocyst cavity. This activity is fuelled by glucose supplied through facilitative glucose transporters. However, the reported kinetic characteristics of blastocyst glucose transport are inconsistent with those of the previously identified transporters and suggested the presence of a high-affinity glucose carrier. We identified and localized the primary transporter in TE cells. It is glucose transporter GLUT3, previously described in the mouse as neuron-specific. In the differentiating embryo, GLUT3 is targeted to the apical membranes of the polarized cells of the compacted morula and then to the apical membranes of TE cells where it has access to maternal glucose. In contrast, GLUT1 was restricted to basolateral membranes of the outer TE cells in both compacted morulae and blastocysts. Using antisense oligodeoxynucleotides to specifically block protein expression, we confirmed that GLUT3 and not GLUT1 is the functional transporter for maternal glucose on the apical TE. More importantly, however, GLUT3 expression is required for blastocyst formation and hence this primary differentiation in mammalian development. This requirement is independent of its function as a glucose transporter because blastocysts will form in the absence of glucose. Thus the vectorial expression of GLUT3 into the apical membrane domains of the outer cells of the morula, which in turn form the TE cells of the blastocyst, is required for blastocyst formation.
Keywords: glucose transport, antisense oligonucleotides, compaction, reverse transcription–PCR, immunolocalization
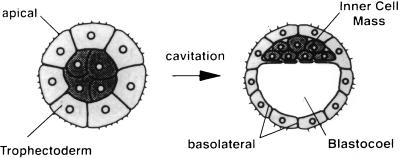
The first embryonic epithelium, or trophectoderm (TE) provides the physical separation of embryonic environments on which subsequent embryonic and extraembryonic differentiations occur. Coincident with the formation of this first epithelium during compaction (about 3 days after fertilization), and blastocyst formation (Fig. 1), the embryo undergoes both qualitative and quantitative changes in energy substrate utilization. Glucose, which cannot support development in vitro prior to this stage, replaces pyruvate and lactate as the preferred energy substrate (2).
Figure 1.
Schematic representation of a compacted morula and blastocyst (adapted from ref. 1). Blastocyst formation is the morphological consequence of cavitation. During this process the newly differentiated epithelial TE cells, with their apical surface facing outward, engage in vectorial fluid transport so that the resultant blastocyst consists of TE cells surrounding a fluid filled cavity (blastocoel) and a small group of totipotent inner cell mass cells eccentrically placed at the side of one pole of the TE.
While evidence for the presence of Na+-linked active glucose carriers is conflicting (3–6), most of the glucose transport activity in early mouse embryos has been attributed to facilitative glucose transporters (GLUTs) (3, 6). Only two of the six known isoforms (GLUT1 and GLUT2) have been identified in the mouse blastocyst (7). GLUT2 was described as being restricted to basal or juxtacoelic membranes of the TE (8), consistent with its reported location in other epithelia (9). GLUT1 however, was “randomly distributed along apical, basolateral and intercellular portions of the plasma membrane” and was proposed to be the transporter on the apical outer surface of TE cells responsible for uptake of maternal glucose into the blastocyst (8).
However this proposal, is implausible for two reasons. First, the Km of blastocyst glucose transport [6.3 ± 0.5 mM for 3-O-methyl glucose (3-OMG) (6)] is much lower than that of GLUT1 [20.1 ± 2.9 mM for 3-OMG (10)], suggesting the presence of a more efficient isoform. Second, in other polarized epithelial cells, GLUT1 is targeted to basolateral, rather than apical membrane domains (11, 12). The GLUT most likely to be expressed in an apical location in TE and therefore responsible for the uptake of maternal glucose was GLUT3. Primarily found in neurons (13–15), this isoform has an apical distribution in other polarized epithelial cells (11, 12) and its extremely low Km [10.6 ± 1.3 mM for 3-OMG (10)], matching that of blastocysts would ensure efficient glucose uptake by the embryo at the low glucose levels prevailing in the uterus (16).
In this study we show that in the mouse, GLUT3 is first expressed around compaction and that GLUT3, rather than GLUT1 is responsible for uptake of maternal glucose by blastocysts. The polarized expression of GLUT3 in TE coincides with the metabolic switch to glucose for energy supply, suggesting that the block to glucose utilization prior to compaction may be partly due to restricted glucose entry into the embryonic cells. Finally, our results with antisense oligodeoxynucleotide blockade suggest that GLUT3 expression is essential for subsequent blastocyst formation, a requirement that appears to be independent of its function as a glucose transporter.
MATERIALS AND METHODS
Reverse Transcription–PCR.
Fertilized eggs, two-cell embryos, four-cell embryos, morulae, and blastocysts were collected [at 24, 48, 60, 72, and 96 hr after 5 units of human chorionic gonadotrophin (hCG) administration at 10:00 hr] from mated, superovulated Quackenbush mice and total RNA obtained using phenol/chloroform extraction and ethanol precipitation (17). RNA was also extracted from mouse brain and 3T3 fibroblast cells, and in these cases, 1 μg of total RNA was used for reverse transcription. RNA was reverse transcribed and amplified by PCR (17) in the presence of specific primers for GLUT3. The primer pair used in the PCR was derived from the murine GLUT3 cDNA sequence (18). Primers were as follows: 5′ primer, 5′-TCATCTTCGCTGCCTTCCTCA-3′; and 3′ primer, 5′-CAGCACTCAGAAGCAGTCCTGGT-3′.
The 284-bp PCR product was resolved on 2% agarose gels containing 0.5 μg/ml ethidium bromide and its identity was confirmed by sequencing on an Applied Biosystems model 373A DNA sequencer. Contamination of cDNA samples with genomic DNA was tested by PCR for mouse β-actin with a primer pair that generates a predicted 243-bp fragment for the cDNA and a 330-bp fragment if contaminating genomic DNA is present (due to presence of an intron) (19). cDNA samples contaminated with genomic DNA were discarded.
Immunolocalization.
The anti-GLUT3 antibody was raised in rabbits against a synthetic C-terminal dodecapeptide of the murine sequence coupled to keyhole limpet haemocyanin through the N-terminal cysteine residue. The antiserum was affinity purified against the peptide (12). The anti-GLUT1 antibody was similarly raised in rabbit against a peptide corresponding to amino acids 480–492 of the rat brain/HepG2 transporter (20). Embryos were fixed in 2% paraformaldehyde in PBS (pH 7.4) for 30 min at 25°C and then washed four times in PBS before placing on Cell-Tak (Collaborative Research) coated coverslips for further processing. Embryos were permeabilized with 0.25% Triton X-100 (Sigma) in PBS for 15 min at 25°C, washed with PBS, neutralized with 0.05 M NH4Cl/PBS for 10 min, washed, and then incubated in a blocking solution containing 10% normal goat serum, 5 g/liter BSA, and 0.01% Tween-20 in PBS (NGS/BSA/Tween/PBS) for 45–60 min. These were then incubated for 2 hr at 25°C with the primary antibody diluted in 5% NGS/BSA/Tween/PBS. Next, embryos were washed in PBS and exposed for 1 hr at 25°C to Texas-red conjugated secondary antibody (goat-anti-rabbit IgG, Calbiochem–Novabiochem, Alexandria, NSW, Australia) diluted 1:100 in PBS. Coverslips were mounted on cavity slides in PBS-buffered glycerol and examined using a Bio-Rad MRC-600 confocal laser scanning microscope mounted on a Zeiss Axioskop equipped with a Zeiss Plan-APOCHROMAT ×63 oil immersion objective.
Immunoblotting.
Eighty embryos were collected in <1 μl BMOC2 medium [ref. 21; modified as described (22)] and solubilized by the addition of 15 μl lysis buffer (10% SDS/1 mM phenylmethylsulfonyl fluoride/125 mM dithiothreitol/20% glycerol/0.002% bromophenol blue/125 mM Tris·HCl, pH 6.8). These were then subjected to SDS/PAGE by use of 10% resolving gel according to the method of Laemmli (23). Proteins were transferred to nitrocellulose membranes (0.45-μm; Protran BA85; Schliecher & Schüll) by the method of Towbin et al. (24). Membranes were blocked for 1 hr at room temperature in 5% milk powder-PBS and then incubated for 1 hr at 37°C with anti-GLUT3 antibody diluted in 1% milk powder-PBS. After three washes of 10 min in PBS-0.1% Tween 20, membranes were incubated at room temperature for 1 hr with a horseradish peroxidase-labeled donkey anti-rabbit secondary antibody (Amersham) diluted 1:10,000 in PBS-0.2% BSA. After three further washes, labeled protein was visualized using the enhanced chemiluminescence detection method (Amersham).
Antisense Oligonucleotides.
Oligonucleotide sequences used were as follows: GLUT3 antisense, 5′-TCA CCT TCG TTG TCC CCA T-3′ (complementary to bases 80–98 of the mouse cDNA sequence); GLUT3 sense, 5′-ATG GGG ACA ACG AAG GTG A-3′ (identical to bases 80–98); GLUT1 antisense, 5′-CTT CTT GCT GCT GGG CTC GAT-3′; and GLUT1 sense, 5′-ATG GAG CCC AGC AGC AAG AAG-3′. Complementary sense oligonucleotides were used to determine nonspecific effects of oligonucleotides in the embryo culture system. An 8-bp sequence (5′-GCG AAA GC-3′) which forms “an extraordinary stable hairpin-like structure” resistant to 3′ exonucleases was included at the 3′ end of all oligonucleotide sequences (25, 26). Oligonucleotide specificity was confirmed by match testing sequences with all gene databases through the Australian National Genomic Information Service.
Embryo Culture.
Two-cell embryos collected 48 hr post-hCG were cultured under mineral oil for 48 hr at 37°C in a humidified atmosphere of 5% CO2, 5% O2, and 90% N2, in BMOC2 medium containing 30 μM sense or antisense oligonucleotides for either GLUT1 or GLUT3. The concentration of 30 μM for the oligonucleotides was chosen as the highest effective concentration that did not adversely affect embryo development in the control (sense) treatment. The effect of antisense treatments on GLUT1 and GLUT3 expression, morphologic development (formation of a blastocoel cavity), and glucose transport were determined.
Glucose Transport.
Glucose transport of individual embryos was measured using uptake of 3-O-methyl-d-[1-3H]glucose ([3H]3-OMG; Amersham) over 3 min at 37°C in 10 μl droplets of glucose-free M2 medium [ref. 27; modified as described (28)], containing 0.3 mM (1 Ci/liter; 1 Ci = 37 GBq) [3H]3-OMG and 25 mM 3-OMG (Sigma). Uptake was stopped by transferring the embryos through four washes of ice-cold glucose-free M2 and their radioactivity determined in a Packard model 2500TL liquid scintillation analyzer at 40% efficiency with a background of 4–5 cpm. statgraphics (version 3.0; Manugistics, Rockville, MD) was used for ANOVA and multiple means range tests using Fisher’s protected procedure.
RESULTS
Expression Studies.
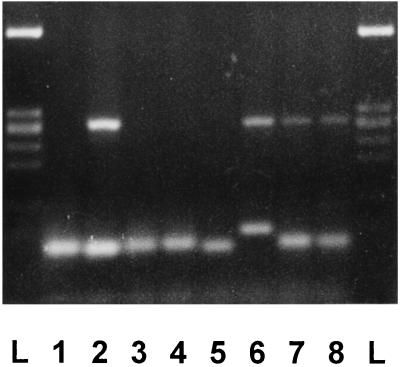
All cDNA samples were tested by PCR for mouse β-actin as specified in Materials and Methods. Ethidium-bromide-stained bands of 284-bp PCR products corresponding to GLUT3 mRNA were detected in brain but not in 3T3 fibroblast cDNA samples. In early mouse embryos, these transcripts were detectable from the four-cell stage and thereafter in morulae and blastocysts (Fig. 2).
Figure 2.
Expression of a 284-bp fragment corresponding to murine GLUT3 mRNA in early mouse embryos. Each embryo lane was produced using a cDNA sample derived from RNA of 10 embryos. Brain and 3T3 fibroblast cell lanes were produced using cDNA derived from ≈20 ng RNA. The RNA preparations were reverse transcribed and amplified by 40 cycles of PCR as described. Lanes: L, DNA ladder (bands from top to bottom: 603, 303, 291/281, 234, and 194 bp); 1, negative control (no cDNA); 2, brain; 3, 3T3 fibroblasts; 4, fertilized eggs; 5, two-cell embryos; 6, four-cell embryos; 7, morulae; 8, blastocysts.
Immunolocalization.
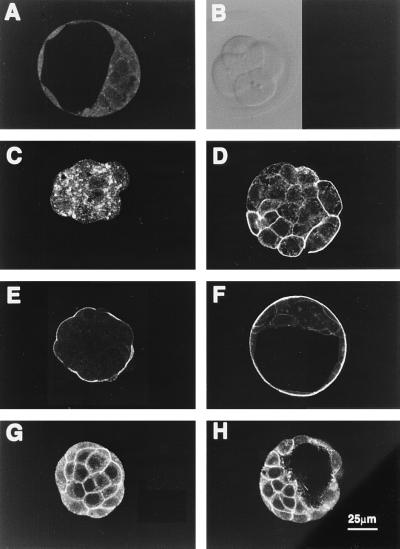
Immunoreactivity for GLUT3 was observed from the late four-cell stage (Fig. 3C) through to the blastocyst (Fig. 3F). There was no immunoreactivity in early four-cell embryos (60 hr post-hCG) (Fig. 3B) but weak staining confined to cytoplasmic vesicles was apparent in late four-cell and six- to eight-cell embryos that were 8–12 hr older. In uncompacted morulae, this staining was uniformally distributed along plasma membranes. As the embryos matured through compaction into blastocysts, the intense immunoreactivity became restricted to apical membranes of the polarized epithelium (TE) (Fig. 3 E and F). Western blot analysis showed an immunoreactive doublet of mobility equivalent to 55,000 Da in both rat brain and mouse blastocyst extracts. This is consistent with GLUT3 (12) and indicative of the high degree of glycosylation characteristic to the GLUTs (29) (see Fig. 7). In contrast, GLUT1 immunoreactivity was present in embryos of all stages, but was confined to basolateral membranes of both morulae and blastocysts (Fig. 3 G and H). There was no detectable apical staining for GLUT1 in these embryos.
Figure 3.
Cellular localization of GLUT3 and GLUT1 during mouse preimplantation development. Confocal images of optical sections of early four-cell, six-cell embryos, early morula, compacted morula, and blastocyst incubated with 10 μg/ml anti-GLUT3 antibody (B–F); morula and blastocyst incubated with anti-GLUT1 antibody (G and H); and blastocyst incubated with pooled nonimmune rabbit serum (A). GLUT3 protein is first apparent at the late four- to six-cell stage (C) when it appears restricted to cytoplasmic vesicles. Note that, as the embryo develops, positive immunoreactivity first appears on plasma membranes then concentrates in the apical surface of the polarizing outer cells of the compacted morula. In blastocysts it is restricted to the apical membranes of TE. This contrasts with GLUT1 expression which is localized in basolateral membranes of both morulae (G) and blastocysts (H).
Figure 7.
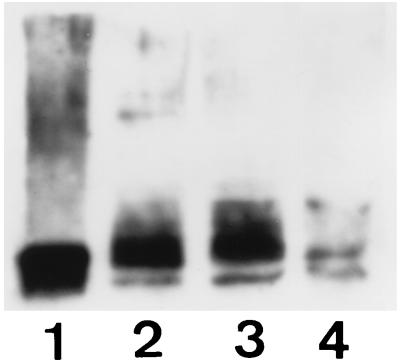
Immunoblot of GLUT3 expression in embryos following antisense oligodeoxynucleotide treatment. Groups of 80 two-cell embryos were cultured over 48 hr in BMOC2 (lane 2) or BMOC2 supplemented with 30 μM of either GLUT3 sense (lane 3) or GLUT3 antisense (lane 4). Resultant embryos were lysed, electrophoresed, and blotted with anti-GLUT3 antibody as described. Rat brain (lane 1), included as a positive control for GLUT3, showed a band at about 55 kDa which was also present in embryos from all treatments. GLUT3 immunoreactivity, however, was markedly reduced in antisense-treated embryos relative to control and sense treatments.
Antisense Experiments.
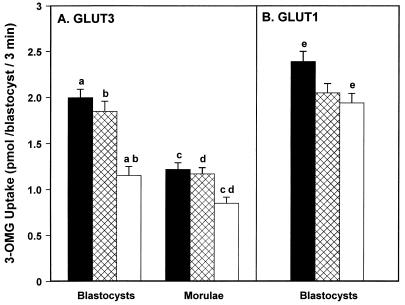
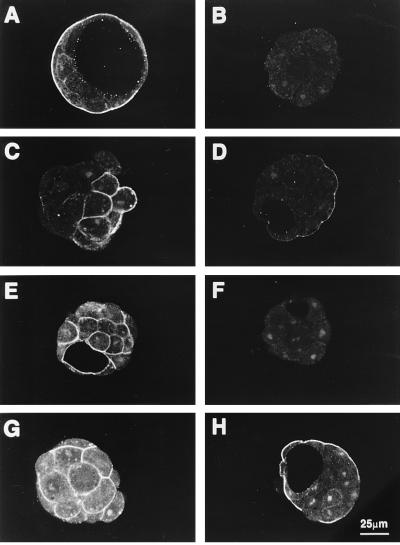
Culture of two-cell embryos in the presence of GLUT3 antisense oligonucleotides dramatically reduced the number of embryos forming blastocysts by 48 hr when compared with sense oligonucleotide and control cultured embryos (Fig. 4, P < 0.001). Most of the embryos in the antisense-treated group remained as morulae. The glucose transport activity of the few resulting blastocysts was reduced by 42% compared with controls (Fig. 5A, P < 0.01). However, immunohistochemical studies of these antisense-treated embryos revealed that 90% of the morulae completely lacked immunoreactive GLUT3 (Fig. 6B), while all of the few blastocysts that formed expressed some GLUT3, albeit at much lower levels (Fig. 6D), consistent with the reduced rate of glucose transport observed. While the glucose transport activity of resultant morulae was also significantly reduced (Fig. 5A, P < 0.01), it was similarly not completely ablated. This probably represents a basal level of transport due to either residual GLUT3 and/or GLUT1 and apparent because of incomplete seal of the epithelial TE at this stage. The inhibition of GLUT3 expression by the antisense treatment was also demonstrated by the marked reduction of GLUT3 protein seen in Western immunoblots of embryos following antisense treatment (see Fig. 7), consistent with the immunohistochemistry results and also showing residual levels of GLUT3 peptide.
Figure 4.
Effect of GLUT3 or GLUT1 antisense oligodeoxynucleotide treatment on blastocyst formation. Development of two-cell embryos cultured for 48 hr in BMOC2 (▪; control) supplemented with either 30 μM sense (⊠) or antisense (□) oligonucleotides for GLUT1 or GLUT3. Each bar represents the percentage of embryos forming blastocysts from three different experiments, each with a minimum of 20 embryos in each of the three treatments (i.e., 162, 256, and 178 embryos in control, antisense, and sense treatments, respectively). χ2 analyses showed a significant difference between treatments for the GLUT3 experiments only (∗∗∗, P < 0.0001). These GLUT3 data were further analyzed using three 2 × 2 contingency tables and individual treatments compared (control vs. sense, χ2 = 1.1452, P = 0.2846; control vs. antisense, χ2 = 29.299, P < 0.0001; sense vs. antisense, χ2 = 18.145, P < 0.0001).
Figure 5.
Effect of GLUT3 (A) and GLUT1 (B) antisense oligodeoxynucleotide treatment during development on embryonic glucose transport activity. Uptake of 25 mM [3H]3-OMG over 3 min at 37°C in either resultant morulae or blastocysts following 48 hr culture in BMOC2 medium (▪; control) supplemented with either 30 μM sense (⊠) or antisense (□) oligodeoxynucleotides. Each bar represents the mean ± SEM of three experiments each containing three to six embryos in each treatment. Means with the same superscript are significantly different by ANOVA: a, b, c, d, P < 0.01; e, P < 0.05. Note that in GLUT1 experiments (B), transport activity of antisense-treated embryos is not significantly different from sense-treated embryos.
Figure 6.
GLUT3 and GLUT1 immunofluorescence following antisense oligodeoxynucleotide treatment. Two-cell embryos developing over 48 hr in BMOC2 and supplemented with 30 μM oligodeoxynucleotides: GLUT3 sense (A), GLUT3 antisense (B, C, D, and G), GLUT1 sense (E), GLUT1 antisense (F and H); and then probed with anti-GLUT3 (A–D and H) or anti-GLUT1 (E–G) as described. GLUT3 immunoreactivity present in sense (A) cultured embryos is abolished by GLUT3 antisense treatment (B). Highly attenuated but not fully abolished GLUT3 immunoreactivity was observed in 10% of morulae (C) and all blastocysts examined (D). The specificity of both the antibodies and the oligonucleotide treatments is shown by the persistence of GLUT1 immunoreactivity in the GLUT3 antisense-treated embryos (G) and GLUT3 immunoreactivity following GLUT1 antisense treatment (H).
In contrast, the inclusion of GLUT1 antisense oligonucleotides in the cultures completely ablated GLUT1 immunoreactivity (Fig. 6F) with no effect on the proportion of embryos forming blastocysts (Fig. 4) or the glucose transport activity of these blastocysts compared with sense treatments (Fig. 5B). The specificity of antisense oligonucleotides was established by (i) the attenuation of immunoreactivity observed in the control and sense-treated embryos (Figs. 6 and 7), and (ii) the persistence of GLUT1 or GLUT3 immunoreactivity in the presence of GLUT3 or GLUT1 antisense oligonucleotides respectively (Fig. 6).
Recovery.
In two experiments each with a total of 280 embryos, removal of embryos from the GLUT3 antisense treatment after 48- to 60-hr exposure increased the number of blastocysts formed over subsequent 12 hr to 79% (n = 120) compared with 84% (n = 160) in the sense treatment. In contrast, only (a maximum of) 44% (n = 120) of the embryos remaining in GLUT3 antisense oligonucleotides formed blastocysts and all of these expressed GLUT3. The remaining embryos degenerated as morulae after 12 to 24 hr and were devoid of GLUT3 immunoreactivity.
DISCUSSION
We examined the hypothesis that GLUT3, not GLUT1, mediates the uptake of maternal glucose by preimplantation mouse blastocysts. This hypothesis was based on the assumption that a high-affinity transporter represents the most efficient and reliable mechanism for the provision, from the maternal milieux of about 1 mM (16), of the large quantities of glucose required by the embryo, to fuel the ATPase ion pumps that drive fluid accumulation and blastocyst formation. The immunohistochemical and functional evidence presented shows that GLUT3, not GLUT1, is indeed the apical glucose transporter in morulae and blastocysts and is responsible for the majority of the uptake of maternal glucose. Furthermore, the results suggest that GLUT3 expression, not simply glucose supply, is essential to blastocyst formation.
The pattern of GLUT3 expression during this phase of development appears to be a manifestation of the blastomeric polarization which commences during compaction and culminates in the formation of the blastocyst. While the inductive signals involved in generating polarity are not understood, the correlation of GLUT3 expression with the generation of the first epithelium provides a functional marker for this process. The apparently random distribution of newly synthesized GLUT3 in the four- and eight-celled embryos and its subsequent restriction to apical membranes during compaction suggest that apical presentation of GLUT3 is achieved by selective stabilization on the apical plasma membrane. This is analogous to the sorting mechanism involved in targeting Na+/K+ ATPase to basolateral domains in Madin–Darby canine kidney cells (30) and may reflect trophectodermal maturation following tight junction formation.
From an embryological perspective, the coincidence of the expression of this highly specialized glucose transporter with the fundamental switch in embryonic metabolism at compaction is highly significant. The inability of glucose as a sole energy source to support development in culture prior to compaction has been the subject of several investigations. While early studies demonstrated a block to glucose utilization at the level of phosphofructokinase (31), they did not rule out a block at the level of glucose transport. It is tempting to speculate that these two events are intimately related and that GLUT3 expression may be important in determining the metabolic priorities of the embryo.
Studies in preimplantation mouse embryos that reported the expression of GLUT1 and GLUT2 did not detect the presence of GLUT3 (7). However, as these authors acknowledged, the human GLUT3 cDNA sequence they used to generate their PCR probes diverges from the murine sequence. In a subsequent morphological study (which did not examine GLUT3 expression) only GLUT2 was reported to have a polarized distribution, being restricted to basal or juxtacoelic membranes of the TE. GLUT1 was ubiquitously distributed along “apical, basolateral and intercellular portions of the plasma membrane” (8). This latter result is in direct contrast to our observations of GLUT1, which was clearly localized to basolateral membranes of the TE, but was distributed evenly on plasma membranes of the apolar ICM cells. Our results support those of GLUT1 expression in rabbit TE (32) and are consistent with GLUT1 targeting to basolateral but not apical membranes of a multitude of cells (11, 12).
Evidence that GLUT3 functions as the apical glucose transporter came from the antisense studies. While ablation of GLUT1 had no effect on glucose uptake, partial ablation of GLUT3 in blastocysts caused a reduction of over 40% in glucose uptake, suggesting that this is the functional transporter of exogenous glucose by the apical TE. In the absence of strong evidence for an apical sodium-linked glucose transport system, it is tempting to speculate that the highly specialized and efficient GLUT3 is responsible for scavenging glucose from the poorly supplied uterine lumen for consumption by the blastocyst. GLUT2, a low-affinity/high-capacity transporter, in keeping with its acknowledged role in other tissues, is presumably responsible for efflux of glucose into the blastocoel cavity, while GLUT1, ubiquitously distributed in the inner cell mass, presumably serves to supply these developing cells from this embryonic extracellular space.
More importantly, however, the greatly reduced rate of blastocyst formation following GLUT3 antisense treatment suggests an integral role for this transporter in development. Embryos remaining as morulae following GLUT3 antisense treatment completely lacked GLUT3 immunoreactivity while all of the few blastocysts formed still expressed some GLUT3, albeit at lower levels. This leads to the conclusion that in the total absence of GLUT3 expression, blastocyst formation was completely inhibited, while expression of even small amounts of GLUT3 was sufficient to permit blastocyst formation. Moreover, upon subsequent removal of the inhibitory oligonucleotides from the culture medium, the formerly inhibited morulae expressed GLUT3 and subsequently formed blastocysts.
The mechanism by which GLUT3 ablation inhibits blastocyst formation is unclear. It cannot be explained on the basis of a high glucose requirement at this stage of development, since mouse embryos can develop to blastocysts successfully in the absence of glucose, provided other energy sources such as pyruvate and lactate are supplied (results not shown and refs. 33 and 34). Rather, GLUT3 expression per se is implicated as essential for blastocyst formation; a requirement that appears to be independent of its function as a glucose transporter. Perhaps GLUT3 acts as a water channel and so facilitates blastocoel formation (35). While it is unlikely that GLUT3 provides the major route by which water enters the blastocoel cavity, it may be responsible for the initiation of the fluid transport process (which does not appear to involve transcellular water flow) by transporting the “seed” water from which the blastocoel develops (36). Alternatively, GLUT3 may be an essential keystone in the structural and/or functional integrity of the apical membrane of the morula. So ablation of GLUT3 expression may interfere with the ability of the presumptive TE cells to manifest their vectorial ion and fluid pumping characteristics which lead to blastocyst formation.
In conclusion, GLUT3 is the transporter targeted to the apical surface of compacted morulae and TE cells and responsible for uptake of maternal glucose by the preimplantation embryo. Its expression correlates with compaction and the coincident metabolic switch to glucose utilization, suggesting that GLUT3 expression may confer glucose dependence on those cells in which it is expressed (e.g., brain). Furthermore, expression of GLUT3, but not GLUT1 or glucose supply, is essential for blastocyst formation. Thus in the mouse, GLUT3 may have a secondary function in blastocyst formation, which is essential for normal embryonic viability and development, but is distinct from its activity in glucose transport.
Acknowledgments
We thank Katrina Chambers for excellent technical assistance and Colin MacQueen for his assistance with confocal laser scanning microscope. M.P. was supported by a Postgraduate Re-entry Research Scholarship from the University of Queensland.
ABBREVIATIONS
- TE
trophectoderm
- GLUT
glucose transporter
- 3-OMG
3-O-methyl glucose
- hCG
human chorionic gonadotrophin
References
- 1.Fleming T P. In: Epithelial Organization and Development. 1st Ed. Fleming T P, editor. London: Chapman & Hall; 1992. pp. 111–130. [Google Scholar]
- 2.Leese H J, Barton A M. J Reprod Fertil. 1984;72:9–13. doi: 10.1530/jrf.0.0720009. [DOI] [PubMed] [Google Scholar]
- 3.Gardner D K, Leese H J. Development (Cambridge, UK) 1988;104:423–429. doi: 10.1242/dev.104.3.423. [DOI] [PubMed] [Google Scholar]
- 4.Chi M M, Manchester J K, Basuray R, Mahendra S, Strickler R C, McDougal D B, Jr, Lowry O H. Proc Natl Acad Sci USA. 1993;90:10023–10025. doi: 10.1073/pnas.90.21.10023. [DOI] [PMC free article] [PubMed] [Google Scholar]
- 5.Manezwala F M, Cragoe E J, Jr, Schultz R M. Dev Biol. 1989;133:210–220. doi: 10.1016/0012-1606(89)90312-6. [DOI] [PubMed] [Google Scholar]
- 6.Gardner H G, Kaye P L. Reprod Fertil Dev. 1995;7:41–50. doi: 10.1071/rd9950041. [DOI] [PubMed] [Google Scholar]
- 7.Hogan A, Heyner S, Charron M J, Copeland N G, Gilbert D J, Jenkins N A, Thorens B, Schultz G A. Development (Cambridge, UK) 1991;113:363–372. doi: 10.1242/dev.113.1.363. [DOI] [PubMed] [Google Scholar]
- 8.Aghayan M, Rao L V, Smith R M, Jarett L, Charron M J, Thorens B, Heyner S. Development (Cambridge, UK) 1992;115:305–312. doi: 10.1242/dev.115.1.305. [DOI] [PubMed] [Google Scholar]
- 9.Thorens B, Cheng Z Q, Brown D, Lodish H F. Am J Physiol. 1990;259:C279–C285. doi: 10.1152/ajpcell.1990.259.2.C279. [DOI] [PubMed] [Google Scholar]
- 10.Gould G W, Thomas H M, Jess T J, Bell G I. Biochemistry. 1991;30:5139–5145. doi: 10.1021/bi00235a004. [DOI] [PubMed] [Google Scholar]
- 11.Harris D S, Slot J W, Geuze H J, James D E. Proc Natl Acad Sci USA. 1992;89:7556–7560. doi: 10.1073/pnas.89.16.7556. [DOI] [PMC free article] [PubMed] [Google Scholar]
- 12.Pascoe W S, Inukai K, Oka Y, Slot J W, James D E. Am J Physiol. 1996;271:C457–C554. doi: 10.1152/ajpcell.1996.271.2.C547. [DOI] [PubMed] [Google Scholar]
- 13.Gould G W, Brant A M, Kahn B B, Shepherd P R, McCoid S C, Gibbs E M. Diabetologia. 1992;35:304–309. doi: 10.1007/BF00401196. [DOI] [PubMed] [Google Scholar]
- 14.Nagamatsu S, Sawa H, Kamada K, Nakamichi Y, Yoshimoto K, Hoshino T. FEBS Lett. 1993;334:289–295. doi: 10.1016/0014-5793(93)80697-s. [DOI] [PubMed] [Google Scholar]
- 15.Maher F, Vannucci S J, Simpson I A. FASEB J. 1994;8:1003–1011. doi: 10.1096/fasebj.8.13.7926364. [DOI] [PubMed] [Google Scholar]
- 16.Edirisinghe W R, Wales R G. Aust J Biol Sci. 1985;38:411–420. doi: 10.1071/bi9850411. [DOI] [PubMed] [Google Scholar]
- 17.Arcellana-Panlilio M Y, Schultz G A. Methods Enzymol. 1993;225:303–328. doi: 10.1016/0076-6879(93)25021-s. [DOI] [PubMed] [Google Scholar]
- 18.Nagamatsu S, Kornhauser J M, Burant C F, Seino S, Mayo K E, Bell G I. J Biol Chem. 1992;267:467–472. [PubMed] [Google Scholar]
- 19.Telford N A, Hogan A, Franz C R, Schultz G A. Mol Reprod Dev. 1990;27:81–92. doi: 10.1002/mrd.1080270202. [DOI] [PubMed] [Google Scholar]
- 20.Piper R C, Hess L J, James D E. Am J Physiol. 1991;260:C570–C580. doi: 10.1152/ajpcell.1991.260.3.C570. [DOI] [PubMed] [Google Scholar]
- 21.Brinster R L. J Reprod Fertil. 1965;10:227–240. doi: 10.1530/jrf.0.0100227. [DOI] [PMC free article] [PubMed] [Google Scholar]
- 22.Pemble L B, Kaye P L. J Reprod Fertil. 1986;78:149–157. doi: 10.1530/jrf.0.0780149. [DOI] [PubMed] [Google Scholar]
- 23.Laemmli U K. Nature (London) 1970;227:680–685. doi: 10.1038/227680a0. [DOI] [PubMed] [Google Scholar]
- 24.Towbin H, Staehelin T, Gordon J. Proc Natl Acad Sci USA. 1979;76:4350–4354. doi: 10.1073/pnas.76.9.4350. [DOI] [PMC free article] [PubMed] [Google Scholar]
- 25.Hirao I, Nishimura Y, Naraoka T, Watanabe K, Arata Y, Miura K. Nucleic Acids Res. 1989;17:2223–2231. doi: 10.1093/nar/17.6.2223. [DOI] [PMC free article] [PubMed] [Google Scholar]
- 26.Khan I M, Coulson J M. Nucleic Acids Res. 1993;21:2957–2958. doi: 10.1093/nar/21.12.2957. [DOI] [PMC free article] [PubMed] [Google Scholar]
- 27.Fulton B, Whittingham D. Nature (London) 1978;273:149–151. doi: 10.1038/273149a0. [DOI] [PubMed] [Google Scholar]
- 28.Hobbs J G, Kaye P L. J Reprod Fertil. 1985;74:77–86. doi: 10.1530/jrf.0.0740077. [DOI] [PubMed] [Google Scholar]
- 29.Baldwin S A. Biochim Biophys Acta. 1993;1154:17–49. doi: 10.1016/0304-4157(93)90015-g. [DOI] [PubMed] [Google Scholar]
- 30.Hammerton R W, Krzeminski K A, Mays R W, Ryan T A, Wollner D A, Nelson W J. Science. 1991;254:847–850. doi: 10.1126/science.1658934. [DOI] [PubMed] [Google Scholar]
- 31.Barbehenn E K, Wales R G, Lowry O H. Proc Natl Acad Sci USA. 1974;71:1056–1060. doi: 10.1073/pnas.71.4.1056. [DOI] [PMC free article] [PubMed] [Google Scholar]
- 32.Robinson P, Smith P, Benos D. J Reprod Fertil. 1990;89:1–11. doi: 10.1530/jrf.0.0890001. [DOI] [PubMed] [Google Scholar]
- 33.Brinster R L. J Exp Zool. 1965;158:59–68. doi: 10.1002/jez.1401580106. [DOI] [PMC free article] [PubMed] [Google Scholar]
- 34.Martin K L, Leese H J. Mol Reprod Dev. 1995;40:436–443. doi: 10.1002/mrd.1080400407. [DOI] [PubMed] [Google Scholar]
- 35.Fischbarg J, Vera J C. Am J Physiol. 1995;268:C1077–C1089. doi: 10.1152/ajpcell.1995.268.5.C1077. [DOI] [PubMed] [Google Scholar]
- 36.Wiley L M. Scanning Microsc. 1987;2:417–426. [PubMed] [Google Scholar]


