Abstract
Replication synchrony within a cell population can be demonstrated by pulse-labeling followed by PCR amplification of immunoprecipitated 5-iodo-2′-deoxyuridine (IdUrd)-labeled DNA from cells of otherwise indeterminant kinetic stages. This replication synchrony–PCR approach may be valuable in understanding the dynamics of human normal tissue or solid tumor replication in situ where access for repeated sampling is severely limited. IdUrd labeling provides a sampling-time-independent method for assessing the replicative status of a cell population at the time when the label was presented. Using genes whose time of replication in S phase is already known, the presence of a cell in early or late S phase can be determined and a qualitative measure made of replication synchrony in the population. This approach was evaluated in synchronous and random cultures of Ej cells using the early replicating PGK-1 gene to identify cells in early S phase at the time of labeling and the late replicating factor IX gene to identify cells that were in late S phase. To test the feasibility of clinical application of this technique, human tumor cells from patients with advanced cancers, given IdUrd therapeutically at specified times of the day, were evaluated. In some patients, replication synchrony–PCR provided evidence of parasynchronous DNA replication in tumor cells. This technique could be appended to existing clinical studies in which BrdUrd or IdUrd is being given to patients either diagnostically or therapeutically.
Keywords: cytokinetics, 5-iodo-2′-deoxyuridine immunoprecipitation, circadian chemotherapy, immunoprecipitation
In proliferative normal tissues of humans and animal model systems, DNA replication is parasynchronous and entrained by the host circadian rhythm (1–5). Parasynchronous circadian gating of DNA synthesis simply means that while not all cells in the population replicate each day, those that replicate do so as a synchronous cohort with circadian stage dependence. Recently, several laboratories have found evidence for parasynchronous daily bursts in DNA replication in human solid tumors (6–8) and non-Hodgkins lymphomas in vivo (9, 10). Significantly, in these studies, tumor cell proliferation appeared to be out of phase with proliferation in some proliferative normal tissues (6, 10). For example, Smaaland et al. (1, 10) found the maximum S phase fraction in the lymphoma cells of 16 non-Hodgkins lymphomas patients at 2 a.m., whereas S phase fractions of the proliferative cells of the bone marrow in 16 healthy volunteers increased in the midmorning and declined again in the late afternoon or early evening. Such differences in the time of maximum DNA replication between normal tissues and tumors might be exploited in chemotherapeutic regimens to optimize toxicity/efficacy relationships. What has been lacking is a rapid qualitative assay for synchrony or asynchrony in human tumors in situ.
Verification of synchronous circadian gating of DNA replication in rodent model systems has been demonstrated through the use of around-the-clock sampling combined with analysis of S phase fractions, labeling indices, or mitotic indices (2–4). Except in very rare instances (6), such access to tumor tissue for frequent sampling is not possible in patients undergoing treatment for malignancies, and thus the difficulty in obtaining adequate cell samples for kinetic analysis becomes a critical limitation to the application of cytokinetic-based treatment. Often in the clinical setting, only a single tumor sample, perhaps prelabeled with one or several treatments with 5-iodo-2′-deoxyuridine (IdUrd) or BrdUrd at diagnostic levels, can be obtained (9). How, given these constraints, could the degree of synchrony or asynchrony in the tumor or dose-limiting normal tissues be determined?
In mammals, the order in which genes are replicated within the nominal S phase is tightly regulated in the cell and may play an important role in determining whether a gene is expressed (11–16). Except in the special case of “reversed replication timing” (17), replication early in S appears to be a necessary if not sufficient condition for gene expression. The replication synchrony technique reverses the logic used previously by researchers interested in the relationship between a gene’s expression and its time of replication within S-phase (16–19). Replication synchrony–PCR (RS–PCR) uses the known time of replication of a panel of genes to specify precisely where within the S-phase a cell or population of cells was when the IdUrd or BrdUrd was incorporated. Because IdUrd is cleared with a half-life of 20 min and is stably incorporated only into the DNA of cells actively replicating, it can be used to define the replication status of a cell at the time the drug was given, even when the tissue sample is obtained many hours after treatment. This attribute of the drug can be exploited by flow cytometric studies as well, but unless the sample is obtained very soon after treatment, the redistribution of cells into G1 means that flow cytometry can be used only to tell whether a cell was somewhere in S phase. Because S phase can be quite long in vivo, with the possibility of complex initiations and pauses within the nominal S phase (11, 20, 21), temporal resolution by analysis of labeling fraction from a single sample is inadequate.
Using synchronous cells in culture, it was possible to verify by RS–PCR that a population was in early or late S phase when the drug was given, even if the cells were collected and DNA isolated many hours to days after labeling. This technique has been applied to selected samples of tumor cells from patients with advanced ovarian or other gastrointestinal cancers. In this limited sample, the results are consistent with our earlier findings where DNA replication was shown to be parasynchronous in a significant fraction of the patient population (6). The feasibility of applying the RS–PCR approach to clinical samples is thus established here, and these findings offer a unique kinetics-based mechanism for the application of timing strategies to the dynamic analysis and treatment of human cancer.
METHODS
Cell Culture and Synchrony.
The human male adenocarcinoma-derived cell line Ej was grown under standard laboratory conditions: in McCoy’s 5A medium, supplemented with 10% fetal bovine serum, and passaged every other day at a split ratio of 1:6. Synchrony was accomplished by mitotic selection from roller bottles as described previously (11). Freshly prepared IdUrd was added at 150 μmol for 1 h at hourly intervals after mitotic selection. For the chase experiment, the IdUrd was washed out after the hour label, conditioned medium added, and the cells were grown for an additional 24 h. Cells to be run in flow were resuspended in complete media at 106 cells per ml and fixed by adding 7 vol of high citric acid fix at pH 2.35 to 1 vol of cells and later resuspended in high citric acid fix at pH 4.5 and stored at 4°C as described previously (7).
Immunofluorescent Staining and Flow Cytometric Analysis of Incorporated IdUrd.
Flow cytometric analysis of IdUrd incorporation was performed using the Cytomation Modular Flow Cytometer. Typically, 105 cells were analyzed using dual laser excitation with scatter signal from a He/Ne laser at 633 nm used as the trigger followed by propidium iodide and fluorescein dye excitation at 488 nm from a 6-watt Ar ion laser, and the data were collected in list mode. Two-dimensional DNA (propidium iodide) vs. immunofluorescent IdUrd histograms are shown in this study. Immunofluorescent staining of IdUrd-labeled cells was accomplished by resuspension of approximately 106 high citric acid fix-fixed cells in 0.5 ml of isotonic Hepes with 0.1% BSA (HBSA). An equal volume of 3 M HCl was added to the suspension, and the cells were incubated at room temperature for 30 min. After washes in 0.1 M borate and HBSA, the cells were resuspended in 1 ml of 0.01× standard saline citrate and incubated for an additional 30 min at room temperature. The cells were resuspended in HBSA before the addition of 150 μg of RNase A (DNase-free) and allowed to incubate for 30 min at 37°C. The cells were then stained with anti-IdUrd (Becton Dickinson), followed by fluorescein isthiocyanate-labeled goat anti-mouse (Boehringer Mannheim). Cells were stained in 5 mg/ml of propidium iodide overnight at room temperature in the dark.
Preparation and Analysis of Patient Samples.
IdUrd (2,500 to 3,750 mg/m2) was delivered as a daily i.p. infusion (2-h infusion, 4-h dwell) for 4 days every 3 weeks (Investigational Review Board no. 90131). The patient population included patients with malignancies that were principally confined to the peritoneal space, for whom no standard therapy existed, or patients whose tumors were refractory to primary therapy. Samples of peritoneal fluids were obtained 3–4 times per day for the duration of treatment and immediately fixed in high citric acid fix. Monoclonal antibodies against EMA (E-29, Dako, an anti-milk fat globule protein) and TAG-72 (B72.3, Signet) were used to identify tumor antigen positive cells in flow. Leukocytes present in the peritoneal washes were identified using the surface markers CD-15 and CD-45. Patient samples chosen for further analysis by this technique were those obtained within the first 48 h after the first IdUrd treatment, and only samples from the first course of IdUrd treatment were used.
DNA Extraction and Immunoprecipitation.
DNA was extracted from tissue culture cells and patient samples that had been pulsed with IdUrd. Between 1 million and 5 million cells were lysed in isolation buffer (10 mM Tris·HCl, pH 8.0/200 mM NaCl/40 mM EDTA/0.5% SDS/0.2 mg/ml proteinase K) and digested overnight at 55°C. RNase was added the next day, and digestion was continued for 1 h at 37°C. The sample was then phenol-extracted twice, chloroform-extracted, and ethanol-precipitated. Before immunoprecipitation, the DNA was digested with a restriction enzyme, sonicated for 15 sec, and denatured at 95°C for 3 min. After cooling and adjusting the buffer to 10 mM phosphate, pH 7.5/0.14 M NaCl/0.05% Triton X-100, an excess of antibody directed against IdUrd was added, and the samples were incubated for 20 min, with constant rocking, at room temperature. Secondary antibody (Sigma or Chemicon rabbit anti-mouse) was added, and the reaction continued for another 20 min at room temperature. The precipitates were collected by centrifugation, the supernatant carefully removed, and the pellets resuspended in a buffer containing 50 mM Tris·HCl at pH 8.0, 10 mM EDTA, 0.5% SDS, and 0.25 mg/ml proteinase K at 37°C overnight. An additional 100 ml of lysis buffer was added, and the samples were incubated for 1 h at 50°C. These samples were phenol-extracted twice, chloroform-extracted, and ethanol-precipitated before PCR amplification.
The PCR amplification reactions were conducted as described (18). For PGK-1, the primers used were C2 5′-gggttggggttgcgcctttccaa-3′ and D2 5′-acgccgcgaaccgcaaggaacct-3′ (223 bp), at 0.2 mmol; for Chinese hamster adenine phosphoribosyl transferase gene, HAPRT-1 5′-gagccagaaatccaaaagggtgc-3′ and HAPRT-2 5′-tcagcaggctggggtcatacca-3′, (282 bp) used at 0.2 mmol; and for human factor IX, IXU5 5′-aggcctcactcttgctagttcct-3′ and IXU5R 5′-tggtgtttgggatgcctctccat-3′, (463 bp) used at 0.5 μmol under standard PCR reaction conditions. Between 30 and 40 cycles were necessary to obtain bands that could be visualized by ethidium bromide. PCR products were run on standard agarose gels, stained with ethidium bromide, and quantitated using the Molecular Dynamics Fluorimager.
RESULTS
Immunoprecipitation of IdUrd-Labeled DNA from Synchronous Cultures.
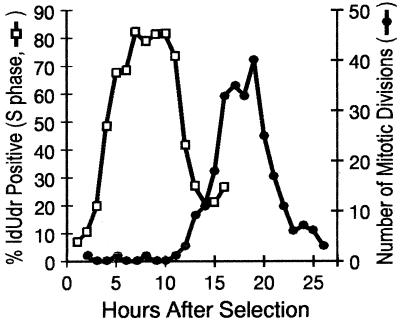
The times of replication within S phase of the factor IX gene (F9) and PGK-1 are known for a number of cell lines (13, 16, 17). Our purpose in repeating these studies was to show that one could use this information to gain a qualitative assessment of synchrony dependent only upon the time of labeling or treatment. Synchrony in the adenocarcinoma-derived cell line Ej cells was established using mitotic selection and monitored by pulse labeling with IdUrd at hourly intervals. In addition, continuous digital time-lapse microscopy was used to score the occurrence of mitotic figures in the second and subsequent division waves. These measures of synchrony are shown in Fig. 1 and Table 1. In Ej cells, S phase begins 4 h after mitosis and continues for approximately 11 h. Anaphase frequency is maximal 16–18 h after mitotic selection.
Figure 1.
Synchrony in human Ej cells. Three 75-cm2 flasks of mitotically selected cells were labeled with IdUrd for 1 h at hourly intervals through the cell cycle, and the IdUrd-positive and bead-standardized fluorescence intensity were determined for each of 17 time points. The IdUrd-positive fraction was determined by gating from the bivariate histograms obtained from flow analysis of pulse labeled samples (□). A flask was reserved for digital time-lapse analysis and subsequently scored for the occurrence of mitoses (•).
Table 1.
Replication timing in synchronous Ej cells
| Ej cells | PGK-1 | F9 |
|---|---|---|
| Early | + | − |
| Late | − | + |
| Random | + | + |
| Early chase | + | − |
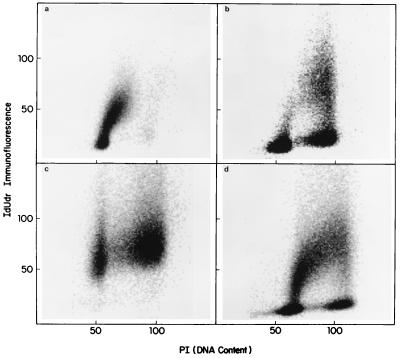
Our method for assessing synchrony is based on the ability to amplify PGK-1 (a housekeeping gene known to replicate in early S phase) in immunoprecipitated DNA from cells labeled in early S phase, and F9, a late replicating gene, in DNA from cells labeled in late S phase. Flow cytometric analyses of the cell cycle distributions of the populations selected for analysis are shown in Fig. 2. Here the IdUrd histograms show that in the culture labeled between 5 and 6 h after mitotic shake-off, the label is contained predominantly in early S phase cells (Fig. 2a), whereas labeling between 14 and 15 h after selection labels primarily late S phase, but with limited incorporation as well into early S DNA (Fig. 2b). The randomly pulsed sample used in this series of experiments, which shows uniform label incorporation throughout S phase, is shown in Fig. 2d for comparison.
Figure 2.
Bivariate flow cytometry of synchronous samples used for replication timing analysis. Cells 5–6 h (a) and 14–15 h (b) after mitotic selection were used for PCR analysis along with randomly growing cells similarly pulsed (d). A flask pulsed at 4–5 h was chased for an additional 24 h before being fixed for flow analysis (c). Two-dimensional histograms of IdUrd immunofluorescence versus propidium iodide are shown for these samples.
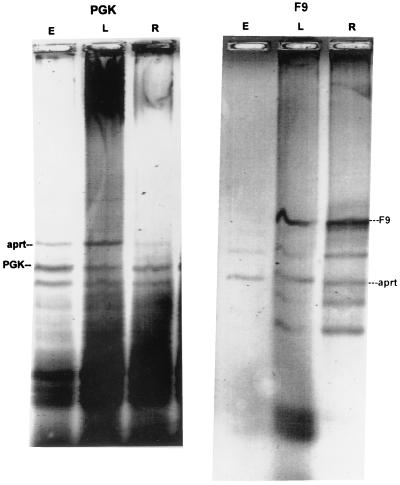
Fig. 3 shows the results of immunoprecipitation of PGK-1 and F9 from synchronous Ej cells, labeled early, late, and randomly in the cell cycle. An identical amount of an unrelated DNA was added to each PCR reaction to provide a measure of the efficacy of the amplification reaction. In this case, Chinese hamster DNA was added, and the HAPRT gene was amplified. Ratios of the PGK-1 and F9 band to the Chinese hamster band were determined by quantitating fluorimaged ethidium-stained gels. Approximately the same ratio of PGK-1/HAPRT was obtained from DNA isolated from cells labeled randomly as from cells labeled in early S phase (2.73 and 2.68, respectively), whereas the PGK-1/HAPRT ratio was roughly four times lower in DNA extracted from cells labeled in late S phase (0.62). Similarly, the ratio of F9/HAPRT is higher in random cells (2.0) and cells labeled in late S phase (1.3) than it is in cells labeled in early S phase (0.42).
Figure 3.
Analysis of PCR products of immunoprecipitated DNA from synchronous Ej cultures. Immunoprecipitated DNA from Ej cultures pulsed for 1 h with IdUrd in early S phase (lane E) and late S phase (lane L) as well as randomly labeled cells (lane R) were subjected to PCR for PGK-1 (Left) and F9 (Right).
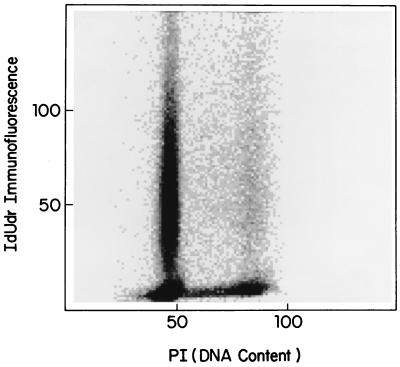
Cell cycle phase redistribution in the hours after a pulse–chase experiment in culture, or after treatment in the clinic, results in the bulk of the antigen positive cells resting in G1. This situation makes it difficult to assess the degree of synchrony or asynchrony in the population by flow cytometry. To make the cytokinetic circumstances as similar as possible to those of samples taken under the IdUrd clinical protocol the label was removed from the synchronous cultures after 1 h, and the cells were allowed to grow for an additional 24 h to confluency before harvesting (Fig. 2c). This pulse–chase procedure yielded a flow pattern similar to those seen in patient samples obtained 24 h after the first IdUrd treatment (compare Figs. 2c and 4). When DNA was prepared from cells labeled in early S phase and then chased in this manner, PGK-1 was still detectable in the immunoprecipitated DNA, though at a somewhat reduced intensity (data not shown).
Figure 4.
Bivariate flow cytometry of IdUrd-positive tumor cells. IdUrd positive and negative cells in tumor antigen cell positive washings from patient ML with ovarian cancer given IdUrd at a dose of 3,750 mg/m2 are shown. Cells were collected and fixed 24 h after beginning treatment.
Immunoprecipitation of IdUrd-Labeled DNA from Patient Samples.
Diagnostic and phase I intraperitoneal studies at City of Hope have demonstrated that IdUrd, administered directly into the peritoneal space, or intravenous administration of BrdUrd, result in labeled tumor cells in peritoneal samplings within 2–4 h of beginning treatment (7, 8). In a given patient, treatment was started at the same time of day, either 11 a.m. or 8 p.m., each day for 4 days at 3-week intervals, and labeling fraction and intensity were determined by flow cytometric analyses. Timing of treatment to late morning yielded the greater labeled fraction (the fraction of cells incorporating any IdUrd) in the tumor-positive populations (8), whereas treatment later in the afternoon resulted in greater IdUrd fluorescence intensity per cell (replication rate). The cells and tumor fragments obtained from peritoneal washes were checked first for the presence of tumor cells by labeling with EMA and TAG-72, which mark tumors of epithelial origin.
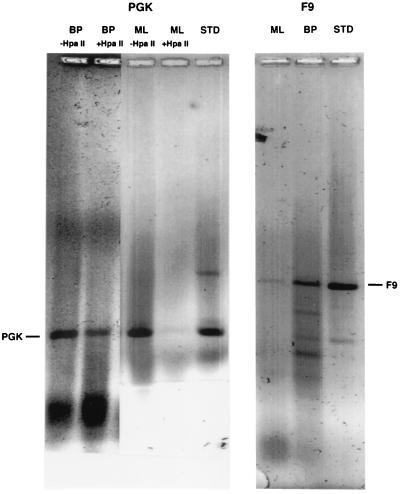
Only 3 of 25 patients enrolled in the protocol received IdUrd at 8 p.m.; those 3 patients were matched to 3 patients given the drug at similar concentrations at 11 a.m. As was done with cultured cells, DNA was extracted and immunoprecipitated with anti-IdUrd antibody, followed by PCR of PGK-1 and F9 to determine if the tumor cells were in early or late S, or randomly distributed in S at the time of labeling. In the case of cells from female patients, the difference in sensitivity of the early replicating PGK-1 versus the late replicating, hypermethylated allele of this gene to methylation-sensitive restriction enzymes can be used as an additional measure of whether the cells were in early or late S phase when labeled. (The late replicating PGK-1 is hypermethylated and therefore resistant to HpaII (19). As Table 2 shows, 2 of the 3 patients treated with IdUrd at 11 a.m. gave a pattern expected for cells labeled only in early S phase, HpaII-sensitive PGK-1, and low or undetectable amounts of F9, when amplified after immunoprecipitation. The third patient (AD) appears to have both early and late replicating DNA labeled (this patient was a male, so presumably the only PGK-1 present would be early replicating). PCR amplification of DNA from all patients treated with IdUrd starting at 8 p.m. yielded a positive F9 signal, and in 2 of the 3, some or all HpaII digestion-resistant PGK-1, suggesting that these tumor cells were primarily in late S phase when the label was present. At the amplification used, the late replicating PGK-1 was considerably harder to detect that either its early replicating counterpart or F9. We speculate that this may be ascribed to a lower efficiency of amplification due to hypermethylation of the late replicating allele. This differential in amplification efficiency is seen as well in the results from other laboratories (17). Fig. 5 shows the results of the PCR analysis for a representative patient from each group.
Table 2.
Replication timing in patient adenocarcinoma cells
| Patient | Time of labeling | % IdUrd- positive | PGK-1 | HpaII response | F9 |
|---|---|---|---|---|---|
| LJ ♀ | 11 a.m. | 4.2 | + | Sensitive | − |
| ML ♀ | 11 a.m. | 2.9 | + | Sensitive | − |
| AD ♂ | 11 a.m. | 8.6 | + | NA | + |
| BP ♀ | 8 p.m. | 0.5 | + | Resistant | + |
| YJ ♀ | 8 p.m. | 0.6 | + | Both | + |
| VA No. 2 ♀ | 8 p.m. | 0.3 | − | NT | − |
| VA No. 3 ♀ | 8 p.m. | 2.9 | − | NT | + |
NA = not applicable. NT = not tested.
Figure 5.
Analysis of PCR products of immunoprecipitated DNA from patient samples. Immunoprecipitated DNA from patient samples labeled at 11 a.m. (patient ML) and at 8 p.m. (patient BP) were subjected to PCR for PGK-1, with and without previous HpaII digestion (Left) and F9 (Right). Lanes marked STD are standards for the PCR reactions.
DISCUSSION
In the majority (4/6) of the patients examined here, only early or late genes, but not both, were found to be labeled in samples taken after the first few days of treatment. If a cell population is replicating asynchronously, then all stages of the cell cycle would be expected to be represented at any point in time, and both early and late replicating genes should be labeled by a brief exposure to IdUrd, whereas a cell population that is replicating synchronously would be expected to yield only early or late genes after PCR amplification of a single IdUrd pulse. As shown in Table 2, it is also possible to have no, or insufficient, numbers of IdUrd-labeled gene sequences, either due to timing (no S phase cells) or, as is more likely in this instance, because the labeling fraction is too low. In Table 2, patient VA, who was negative in the early sample taken (No. 2), became positive in sample No. 3. Between the two samples from this patient, the percentage of labeled cells increased from only 0.3% IdUrd positive cells to 2.9% positive. In patient YJ, both HpaII-sensitive and insensitive PGK-1 and F9 were detected, suggesting that DNA replication was not parasynchronous or that there were two replicating cell populations in the sample. Studies are currently underway to resolve this question in peritoneal samples containing mixtures of cell types using physical separation of the cell populations by flow sorting.
To a first approximation, circadian rhythms in DNA replication, and other measures of cell proliferation, can be represented as sinusoidal functions with time. Unless amplitudes are very large, this means that there will always be some cells in the population that are out of phase with the majority. It was our aim to take advantage of the geometric nature of PCR amplification to effectively threshold away the minor subpopulations and thus present an all or none measure of the peak time of early replication in the tumor or normal tissue cells. However, as the sensitivity of the assay is increased (by raising the cycle number for example), minor populations may begin to show up in the amplified products.
The data of Fig. 4 best illustrate the motivation for developing this technique. The cells from the patient shown in Fig. 4 are almost certainly in the prereplicative (G1) portion of the cell cycle. In these bivariate flow histograms, there is no means for making distinctions between early S and G1 arrest. The cell cycle of tumor cells in vivo is usually in the range of 100–120 h, even though S phase is typically between 12 and 24 h. This means that a cell that divides on day 1 after labeling will not reenter S phase again until day 4–7 after labeling. We were able to show this directly in a small number of patients given a diagnostic dose of BrdUrd just before surgery (7, 22). All flow histograms taken between day 1 and 5 looked exactly like that shown in Fig. 4. Only on day 5 did one again begin to see the reappearance of cells in S phase with incorporated BrdUrd. Nevertheless, on each day between days 1 and 5 a new cohort of parasynchronous cells entered S phase (6, 7, 23).
Both our basic understanding of cancer and, more parochially, improvement of chemotherapeutic strategies by timing of treatment using DNA replication specific drugs is dependent upon the ability to assess the dynamics of tumor growth and specifically the degree of cytokinetic synchrony in human tumors and normal tissues in situ. Such analyses have been confounded by the limited access for repeated sampling from the tumor. Because clinical studies are based on single samples taken without regard to biological time, the possibility exists that human tumors, like many transplantable rodent tumors, replicate synchronously (23).
It is widely agreed that proliferating cells are more sensitive to chemotherapeutic agents than are nonproliferating cells, and that S phase, in particular, represents a large cytotoxic target. With DNA replication-dependent drugs such as IdUrd and BrdUrd, only those cells actively replicating DNA would be expected to be killed, so that the ability to target S phase cells becomes even more critical. Though the total IdUrd positive fraction of the population is also a sampling time-independent measure of the fraction of cells replicating DNA when the label was present, the fact that most if not all expressed genes in a particular cell type, particularly oncogenes, are early replicating in S phase (13, 24), and the fact that cytotoxicity from repeated IdUrd treatments is maximal in early S phase in synchronous cells in culture means that the cytotoxic target may be further refined by the careful timing of these DNA replication-dependent drugs.
Conventional treatment strategies generally assume some stochastic, steady-state process is responsible for bringing cells into S phase. Circadian chemotherapeutic timing strategies already have proven to be of benefit in reducing toxicity based on an agent’s pharmacologic properties alone (25). A kinetic gating strategy would exploit the fact that a significant fraction of cells are gated into S phase each day at the same time of day, to treat that population at the most susceptible time to gain a therapeutic advantage. The low proliferative fraction, relative to the dose-limiting normal tissues, commonly seen in solid tumors becomes less important than the degree of synchrony within the proliferating cells and the phase relationship between peak proliferation in the tumor versus that in the dose-limiting tissues. In the case where the two are out of phase, an even greater therapeutic advantage may be gained by careful timing of drug delivery. In this optimal case of clear temporal segregation of normal and tumor cell proliferation, daily treatment at doses just sufficient to produce cytotoxicity in the relatively small fraction of replicating tumor cells might permit longer courses of treatment. Such a strategy is quite contrary to standard practice.
Though the sampled patient population is too small to permit any conclusion regarding the generality of synchrony in human solid tumors, it is notably the case that at least 4/6 of the patients yield results consistent with synchronous proliferation.
Additional work will be required to resolve the frequency with which parasynchronous replication occurs in human solid or hematopoietic cancers.
ABBREVIATIONS
- RS–PCR
replication synchrony–PCR
- IdUrd
5-iodo-2′-deoxyuridine
References
- 1.Smaaland R, Laerum O D, Lote K, Sletvold O, Sothern R B, Bjerknes R. Blood. 1991;77:2603–2611. [PubMed] [Google Scholar]
- 2.Scheving L E, Haus E, Kühl J F W, Pauly J E, Halberg F, Cardoso S. Cancer Res. 1976;36:1133–1137. [PubMed] [Google Scholar]
- 3.Clausen O P F, Kirkhus B, Pedersen S, Bolund L. Cell Tissue Kinet. 1985;18:445–455. doi: 10.1111/j.1365-2184.1985.tb00674.x. [DOI] [PubMed] [Google Scholar]
- 4.Scheving L E, Tsai T H, Scheving L A, Feuers R J. Ann NY Acad Sci. 1991;618:182–227. doi: 10.1111/j.1749-6632.1991.tb27246.x. [DOI] [PubMed] [Google Scholar]
- 5.Buchi K N, Hrushesky W J M, Sothern R B, Rubin N H, Moore J G. Gastroenterology. 1991;101:410–415. doi: 10.1016/0016-5085(91)90019-h. [DOI] [PubMed] [Google Scholar]
- 6.Klevecz R R, Shymko R M, Blumenfeld D, Braly P S. Cancer Res. 1987;47:6267–6271. [PubMed] [Google Scholar]
- 7.Klevecz R R, Braly P S. Ann NY Acad Sci. 1991;618:165–183. doi: 10.1111/j.1749-6632.1991.tb27248.x. [DOI] [PubMed] [Google Scholar]
- 8.Klevecz R R, Brown L P, Morgan R J, Carroll M. J Infusional Chemotherapy. 1995;5:26–30. [PubMed] [Google Scholar]
- 9.Smaaland R, Sothern R B. In: Circadian Cancer Therapy. Hrushesky W J M, editor. Boca Raton, FL: CRC; 1994. pp. 119–163. [Google Scholar]
- 10.Smaaland R, Lote K, Sothern R B, Laerum O D. Cancer Res. 1993;53:3129–3138. [PubMed] [Google Scholar]
- 11.Klevecz R R, Keniston B A, Deaven L. Cell. 1975;5:195–203. doi: 10.1016/0092-8674(75)90027-6. [DOI] [PubMed] [Google Scholar]
- 12.Furst A, Brown E H, Braunstein J D, Schildkraut C L. Proc Natl Acad Sci USA. 1981;78:1023–1027. doi: 10.1073/pnas.78.2.1023. [DOI] [PMC free article] [PubMed] [Google Scholar]
- 13.Goldman M A, Holmquist G P, Gray M C, Caston L A, Nag A. Science. 1984;224:686–692. doi: 10.1126/science.6719109. [DOI] [PubMed] [Google Scholar]
- 14.Hatton K S, Dhar V, Brown E H, Iqbal M A, Stuart S, Didamo V T, Schildkraut C L. Mol Cell Biol. 1988;8:2149–2158. doi: 10.1128/mcb.8.5.2149. [DOI] [PMC free article] [PubMed] [Google Scholar]
- 15.Vassilev L T, Burhans W C, DePamphilis M L. Mol Cell Biol. 1990;10:4685–4689. doi: 10.1128/mcb.10.9.4685. [DOI] [PMC free article] [PubMed] [Google Scholar]
- 16.Hansen R S, Canfield T K, Lamb M M, Gartler S M, Laird C D. Cell. 1993;73:1403–1409. doi: 10.1016/0092-8674(93)90365-w. [DOI] [PubMed] [Google Scholar]
- 17.Hansen R S, Canfield T K, Gartler S M. Hum Mol Genet. 1995;4:813–820. doi: 10.1093/hmg/4.5.813. [DOI] [PubMed] [Google Scholar]
- 18.Vassilev L, Johnson E M. Nucleic Acids Res. 1989;17:693–7705. doi: 10.1093/nar/17.19.7693. [DOI] [PMC free article] [PubMed] [Google Scholar]
- 19.Singer-Sam J, Grant M, LeBon J M, Okuyama K, Chapman V, Monk M, Riggs A D. Mol Cell Biol. 1990;10:4987–4989. doi: 10.1128/mcb.10.9.4987. [DOI] [PMC free article] [PubMed] [Google Scholar]
- 20.Aarnaes E, Clausen O P, Kirkhus B, DeAngelis P. Cell Proliferation. 1993;26:205–219. doi: 10.1111/j.1365-2184.1993.tb00020.x. [DOI] [PubMed] [Google Scholar]
- 21.Fainsod A, Goitein R, Marcus M. Exp Cell Res. 1984;152:77–90. doi: 10.1016/0014-4827(84)90231-3. [DOI] [PubMed] [Google Scholar]
- 22.Klevecz R R, Braly P S. In: Circadian Cancer Therapy. Hrushesky W J M, editor. Boca Raton, FL: CRC; 1994. pp. 165–183. [Google Scholar]
- 23.Echave Llanos J M, Nash R E. J Natl Cancer Inst. 1970;44:581–585. [PubMed] [Google Scholar]
- 24.Iqbal M A, Chinsky J V, Kidamo, Schildkraut C L. Nucleic Acids Res. 1987;15:87–103. doi: 10.1093/nar/15.1.87. [DOI] [PMC free article] [PubMed] [Google Scholar]
- 25.Hrushesky W J M. Science. 1985;228:73–75. doi: 10.1126/science.3883493. [DOI] [PubMed] [Google Scholar]


