

Abstract
Cytochrome P450 3A4 (CYP3A4) is involved in the metabolism of a majority of drugs. Heterotropic cooperativity of drug binding to CYP3A4 was examined with the flavanoid, α-naphthoflavone (ANF) and the steroid, testosterone (TST). UV-vis and EPR spectroscopy of CYP3A4 show that ANF binding to CYP3A4 occurs with apparent negative cooperativity and that there are at least two binding sites: 1) a relatively tight spin-state insensitive binding site (CYP●ANF) and 2) a relatively low affinity spin-state sensitive binding site (CYP●ANF●ANF). Since binding to the spin-state insensitive binding site is considerably tighter for ANF than TST, the spin-state insensitive binding site could be occupied by ANF, while titrating TST at the other site(s). The spin-state insensitive binding site of ANF appears to compete with the spin-state insensitive binding site of TST. The formation of the spin-state insensitive CYP●ANF complex is strongly temperature dependent, when compared to the formation of the CYP●TST complex, suggesting that the formation of the CYP3A4●ANF complex leads to long-range conformational changes within the protein. When the CYP●ANF complex is titrated with TST, the formation of CYP●ANF●TST is favored by 3:1 over the formation of CYP●TST●TST, suggesting that there is an allosteric interaction between ANF and TST. A model of heterotropic cooperativity of CYP3A4 is presented, where the spin-state insensitive binding of ANF occurs at the same peripheral binding site of CYP3A4 as TST.
Keywords: binding, thermodynamics, CYP, allosterism, drug-interactions, CYP3A4, EPR, Cooperativity plot, testosterone, α-naphthoflavone
Introduction
Cytochrome P450 3A4 (CYP3A4) is an enzyme found in the liver and intestine and is responsible for the phase I metabolism of a majority of known drugs [1–3]. CYP3A4 exhibits non-hyperbolic steady-state kinetics and complex ligand-binding behavior in vitro [2]. The non-hyperbolic kinetics suggests that there is simultaneous binding of more than one ligand and that there is cooperativity between bound ligands [4]. Cooperativity can occur between ligands of the same (homotropic) or different (heterotropic) molecular species, leading to stimulation or inhibition of catalytic activity. Unfortunately, these interactions are not well understood [5–10].
There are three prevailing models of cooperativity for cytochrome P450s (CYPs): the multi-substrate binding site model [11–13], the peripheral effector binding site model [14–16], and the conformational heterogeneity model [17–19]. With the multi-substrate binding model, multiple substrates are bound at unproductive binding sites within the active site that can modulate the apparent Km, kcat and Vmax of substrate that transiently occupies a metabolically productive position. In this model, the CYP enzyme will eventually metabolize all bound substrates. In contrast, the peripheral effector binding site model has an effector binding site that lies outside of the active site. Substrates bound at the effector binding site do not undergo metabolism directly, but they affect the kinetic parameters of the substrate in the active site by long-range interaction. Finally, in the conformational heterogeneity model, there are discrete, persistent populations of cytochrome P450s that have differential affinities for substrates and inhibitors. However, since this model is not mutually exclusive, it will not be addressed in this study. Notably, however, published data support each of these models, and it is likely that all contribute, depending on the specific ligands and the specific conditions of the assay.
The recently solved x-ray crystal structures of CYP3A4 have shed some light on the molecular basis of the first two models [20–22]. One structure of the enzyme showed that CYP3A4 has a large active site with a peripheral progesterone binding site, which would be consistent with the peripheral effector binding site model, although no progesterone occupied the active site [21]. Another structure shows two ketoconazole drug molecules bound in the active site of CYP3A4 simultaneously, which would be consistent with the multi-substrate binding model and was observed previously in the CYP3A4 homolog, cytochrome P450 eryF (P450eryF) [20, 23]. Neither structure provides conclusive evidence for the mechanism of cooperativity, since either the substrate was absent from the active site, the ligand was inhibitory, or the concentrations used can not be extrapolated to the solution experiments.
Despite these x-ray crystal structures, no consensus has emerged on the number of ligand binding sites within the enzyme. CYP3A4 has been modeled with two [11, 12, 14, 15, 24–26], three [16, 27–29], and more ligand [13] binding sites. Since the x-ray crystal structures of CYP3A4 and P450eryF have at most 2 ligands bound simultaneously [20, 23], the data in this study were modeled with two ligand binding sites.
TST and the flavanoid, α-naphthoflavone (ANF) are known as ‘type 1’ ligands of CYP3A4 because their binding increases the fraction of high spin (HS) heme by, presumably, displacing the heme bound water (Figure 1). These compounds exhibit both homotropic and heterotropic cooperativity in steady state kinetic assays and optical equilibrium binding assays [14, 15, 25, 28, 30–36]. Therefore, these compounds are ideally suited for studying the mechanism of heterotropic and homotropic cooperativity. Here, UV-vis and EPR spectroscopy of CYP3A4 were used to study the cooperative binding events between these compounds. A model based on simulations is presented that is consistent with heterotropic and homotropic cooperativity for these ligands and is correlated to the known structural and kinetic aspects of ANF and TST binding to CYP3A4.
Figure 1.
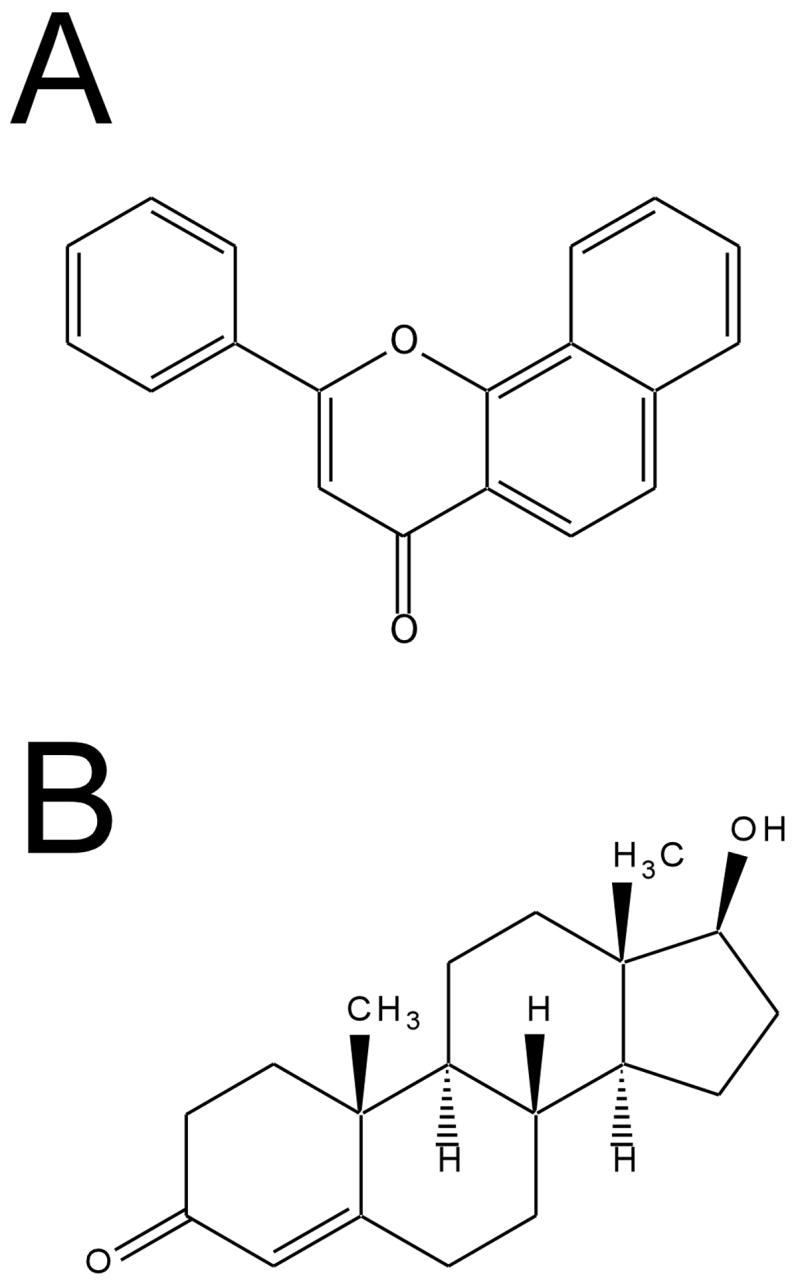
Structures of A) α-naphthoflavone (ANF) and B) testosterone (TST).
Materials and Methods
Absorbance spectroscopy
The absorbance experiments with CYP3A4 were performed using a Cary 3E absorbance spectrophotometer (Varian Scientific Instruments, Inc., Lake Forest, CA) or an Olis Modernized Aminco® DW–2 (Olis, Inc., Bogart, GA) as previously described [37–39]. All samples contained 100 mM phosphate (pH 7.4, 25°C) and were titrated with ligand dissolved in ethanol to a maximum co-solvent concentration of 2%.
Estimation of HS and LS by absorbance spectroscopy
Absorbance spectra were deconvoluted into their LS and HS components and the broad δ-band using the multiple peak fitting package of Igor Pro 5.0 (Wavemetrics, Inc., Lake Oswego, Oregon) in a similar fashion as described for P450CAM, P450eryF and CYP3A4 [15, 40, 41]. The relative areas under these peaks were previously calculated and compared to a low spin (LS) reference spectra to estimate percentages of LS and HS [15, 41].
If the ligands of CYP3A4 have a strong effect on the extinction coefficients of the LS Soret band, then the method described above will not work [41]. The LS and HS Soret of the ligand-bound CYP3A4 can be compared to the LS and HS Soret peaks of CYP3A4 with known percentages of LS and HS (e.g. CYP3A4 without ligands). Therefore, the areas of Soret peaks of CYP3A4 with known percentages of HS and LS were compared with the areas of the corresponding peaks in CYP3A4 with saturating ligand. This method was used for the estimation of spin state with 9-aminophenanthrene (9AP) bound to P450eryF [41].
Normalized absorbance difference spectroscopy
Normalized absorbance difference was previously used to examine the affect of TST on the spin state of CYP3A4 [15]. The absorbance changes observed by this method are directly related to the spin-state equilibrium constant, KSPIN. The absorbance of the HS or LS Soret band (e.g. LS Soret band at 420 nm in this case) is first normalized. Then absorbance changes are observed for the other Soret band (e.g. HS Soret band at 390 nm). A value related to ΔKSPIN can then be determined by subtracting the normalized absorbance of CYP with ligand from CYP without ligand.
| (Eq. 1) |
This is related to ΔKSPIN by:
| (Eq. 2) |
where is the normalized absorbance at 390 nm.
This method of analysis has some advantages over other methods (i.e. simple absorbance difference, second derivative analysis, curve fitting, or direct measurement of the apparent absorbance bands [40, 42–45]) because it is not dependent on the extinction coefficients and it is insensitive to protein concentration and solvent artifacts. However, line width of Soret bands are not taken into account and the Soret bands are assumed to have similar extinction coefficients. Therefore, values obtained from this method should be considered approximate. Details of this method are provided in [15].
EPR spectroscopy
Electron paramagnetic resonance (EPR) spectroscopy was performed on a Bruker EMX x-band (Bruker-Biospin, Billerica, MA) EPR spectrometer in liquid nitrogen (77K), using a liquid nitrogen dewar insert (Wilmad-Labglass, Buena, NJ). The EPR samples were prepared in 100 mM phosphate with 20% glycerol as a cryoprotectant (pH 7.4). TST in ethanol was titrated into 90–180 μM CYP3A4 and the final concentration of ethanol was kept < 2%. The EPR parameters are shown in the figure legends and were obtained under conditions of non-saturating microwave power.
Simulations of the EPR and absorbance data
The changes in the absorbance spectra were fitted, using the computer program GEPASI [46–48]. Using GEPASI, the data were fit with the sequential ordered binding model with two binding sites [15, 27]:
| (Eq. 3) |
| (Eq. 4) |
The actual concentrations of [CYP], [CYP●L], [CYP●L●L], and [L] were determined using the rate equations with GEPASI below, rather than with equilibrium equations, such as the Adair-Pauling equation. The rate equations allow accurate determination of concentrations, even when [CYP]>[L]. Below are the rate equations that were used to determine the steady-state concentrations of [CYP], [CYP●L], [CYP●L●L], and [L]:
| (Eq. 5) |
| (Eq. 6) |
| (Eq. 7) |
The effects of two ligands on the spin-state of CYP3A4 are not expected to be identical. Therefore, the changes in the absorbance spectra are likely to have this relationship:
| (Eq. 8) |
(Abbreviations: A = amplitude of the absorbance change; σ1 = spin coefficient of [CYP●L]; σ2 = spin coefficient of [CYP●L●L])
The spin coefficients are related to the fractional change in the spin-state. To be consistent, a positive spin coefficient (σ̣ > 0) represents a shift to the HS state, whereas a negative spin coefficient (σ̣ < 0) represents a shift to the LS state. The fractional change of spin state can be determined with:
| (Eq. 9,10) |
where fs1 and fs2 = fractional change in spin-state by the first ligand and second ligand, respectively. Using these equations, the GEPASI computer program fitted the data using the evolutionary algorithm until the best fit was achieved.
Calculating %HS and KSPIN from curve-fitting and normalized absorbance difference
Both curve-fitting and normalized absorbance difference provide quantitative information on the coupling between spin-state and binding. The relationship between KSPIN at a given [L] (i.e. KSPIN([L])) and is as follows:
| (Eq. 11) |
where CYP●L●L and CYP represent CYP in the presence and absence of saturating L.
This can then be easily converted to the %HS at a given [L] by:
| (Eq. 12) |
Thus, we can directly determine the effect of a ligand on the %HS.
Results
UV-vis spectroscopy was used to monitor changes in the spin-state equilibria of CYP3A4 in the presence of ANF and TST. Absorbance spectroscopy has been used previously to monitor the change in spin-state in both CYPs [15, 37, 40, 42–45]. Ligand-induced absorbance changes of heme absorbance bands of CYPs can be monitored by a variety of methods, including: simple absorbance difference, normalized absorbance difference, second derivative analysis, curve fitting, and the direct measurement of the apparent absorbance bands [15, 37, 40, 42–45]. With simple absorbance difference method, the absorbance of the CYP in the presence of ligand is subtracted from the absorbance without ligands present. As long as the ligand does not affect the extinction coefficient of the heme absorbance significantly, the difference will reflect a change in spin state. On the other hand, in cases where the extinction coefficients of the heme absorbance bands are affected by ligand, a simple difference will not reflect only changes to spin state. In this case, the normalized absorbance difference method can be used. In the normalized absorbance difference method, the absolute absorbance spectra are normalized in the HS (~390 nm) or LS (~420 nm) Soret regions, thereby eliminating the effect of ligand on the extinction coefficients of the absorbance bands. Then, the normalized CYP spectrum in the absence of ligands is subtracted from the normalized absorbance spectrum of CYP with ligand. The amplitude of the difference reflects a change in KSPIN [15]. This method was useful previously in examining the binding and change in spin-state equilibria induced by TST on CYP3A4 [15].
Figure 2A shows the absorbance difference of ANF binding to 1 μM CYP3A4. Fitting the curve shown in Figure 2B with the Hill equation results in a KS and n-value of 6.0 ± 0.3 μM and 1.23 ± 0.07, respectively. These values are consistent with KS = 5.3–5.7 μM and n = 1.7 that were obtained previously [28, 49]. However, in these titrations there appeared to be significant interference from the ANF absorbance shown as a rise at 350 nm [cf. Figures 2A and 2B (closed squares) with Figures 3, B and D, respectively, of ref. 28]. In order to minimize the interference from ANF, the negative amplitude at 425 nm was monitored as a function of [ANF] and is shown in Figure 2B (open circles) and fit with the Hill equation. Although the n value was quite similar to the previous analysis (i.e. n=1.21 ± 0.03), the KS was significantly increased to 11 ± 0.5 μM. Therefore, the ANF absorbance overlap with the heme Soret bands of CYP3A4 clearly interferes with measurement of KS. Despite significant effort, the ANF absorbance could not be completely subtracted out at this [CYP] because small subtraction or titrating errors would lead to significant ANF absorbance artifacts in the 300–400 nm region.
Figure 2.

UV-visible titration of ANF with 1 μM CYP3A4 at 25°C, showing interference from the ANF absorbance in the 300–400 nm region. A) Absorbance difference of (CYP+L)-(CYP) in the Soret region (350–450 nm). B) Absorbance amplitude between 390 nm and 420 (closed squares) and the magnitude of the negative amplitude at 425 nm (open circles).
Figure 3.

UV-visible titration of ANF with 5 μM CYP3A4 at 25°C. A) Absolute absorbance of CYP3A4 Soret region (300–500 nm) in the presence of various concentrations of ANF. B) The difference of the absolute absorbance spectra in A between (CYP+L)-(CYP). C) The amplitude (solid squares) and Hill equation fit (solid line) of the absorbance difference at A390–A417. D) The absorbance spectra of A normalized at 420 nm. E) The difference of the normalized absorbance spectra in E. F) The amplitude of 390 nm as a function of [ANF] with 0–20 μM [ANF] shown in the inset.
To compensate for the overlapping ANF absorbance, absorbance experiments were performed at significantly higher concentration of CYP3A4 than previously [28]. Furthermore, in order to avoid artifacts introduced by baseline subtraction of difference spectra and to identify the ANF absorbance from heme absorbance, the absolute absorbance spectra were taken.
Figure 3A shows the absolute UV-vis absorbance spectra of 5 μM CYP3A4 at several different concentrations of ANF with the background ANF signal subtracted out. The experiments were performed within an hour of putting CYP3A4 into solution and there was no detectable precipitation of the CYP3A4 protein. There is an apparent decrease at 420 nm, which would be consistent with a shift to the HS-state. There is also a decrease in the absolute intensity of the HS Soret region at ~390 nm. Therefore, ANF most likely affects the extinction coefficient of the CYP3A4 heme.
Figure 3B shows the difference plot of Figure 2A, where the absorbance spectra of CYP with ligands is subtracted from the spectrum of CYP without ligands (i.e. CYP+L − CYP). The difference plot appears asymmetric with a trough at 417 nm. In other words, there is a greater decrease in the absorbance at 417 nm than increase in the absorbance at 390 nm, which has been observed previously [cf. Figure 2B with Figure 2A of ref. 49]. The asymmetry observed with ANF further suggests that there are decreases in the molar extinction coefficients of the heme absorbance bands in addition to the shifts in the spin state equilibria. The trough mirrors the decreases in the absolute absorbance spectra observed in Figure 3A (cf. Figure 3A and B). This observation brings to light that the absorbance difference spectra do not necessarily have symmetric derivative line shapes. Figure 3C is a plot of the absorbance difference between 417 nm and 390 nm versus ANF concentration. The absorbance curve shows sigmoidal curvature with saturation of CYP3A4 at greater than 100 μM ANF.
Fitting Figure 3C with the Hill equation results in KS and n-values of 50 ± 3 μM and 1.39 ± 0.08, respectively, which differ considerably from values obtained previously (i.e. KS = 5.3–5.7 μM and n=1.7 [28, 49]). One culprit is the relatively high protein concentration that was used in the experiment which would skew values obtained by curve fitting with the Hill equation, since [E] would no longer be significantly less than [S]. The other culprit is obviously the interference from the ANF absorbance. A similar discrepancy exists between the results previously obtained for steady-state turnover of ANF [11, 28, 50]. Hosea and coworkers report KS values for formation of 5,6-epoxide of ~8 μM [28], while Shou and coworkers report KS values between 48.8 μM and 132.8 μM [11, 50]. The source of the discrepancy is unclear, but our values for equilibrium binding appear to correlate well with the steady-state kinetic values determined from Shou and coworkers [11, 50].
As mentioned earlier, ligand induced changes in the extinction coefficients of the heme absorbance bands of CYP3A4 do not necessarily reflect ligand induced spin-state changes. Normalized absorbance difference can be used to ameliorate the affect of ligand on extinction coefficient in the absorbance difference. Figure 3D–F shows the normalized absorbance difference of CYP3A4 in the presence of ANF. In Figure 3D, the absolute absorbance spectra are normalized at 420 nm, where the LS-associated Soret band overlaps little with the HS-associated Soret absorbance band [15]. Figure 3E shows the difference between normalized spectra of CYP3A4 with ligands subtracted from the normalized spectra without ligands. At <370 nm, there is still a significant contribution from ANF absorbance that is difficult to completely eliminate. There is also a small increase at 435 nm, which is indicative of a small shift of the LS Soret peak and there is also an increase at 390 nm, which would be expected for a “type I” ligand. The increases at 390 nm observed in Figure 3E do not overlap significantly with the ANF absorbance between 300–400 nm. Therefore, the amplitude at 390 nm should primarily represent the shift of the spin-state equilibrium of CYP3A4 to the HS-state. In Figure 3F, the amplitude of 390 nm was measured and plotted as a function of [ANF]. There is very little change in spin-state when the concentration is less than 1 equivalent ANF (see Figure 4F (inset)). After 1 equivalent, the CYP3A4 heme shifts to the HS state. This behavior is very similar to the behavior observed for binding of TST to CYP3A4 [15], suggesting that ANF has qualitatively similar effects on the CYP3A4 heme.
Figure 4.

Peak fitting of the HS and LS Soret bands at 25°C. Curve fitting of the absolute absorbance spectra of CYP3A4 with ANF and TST. A) 1 μM CYP3A4 without ligands B) 5 μM CYP3A4 with saturating (256 μM) ANF. C) 5 μM CYP3A4 with close to saturating (640 μM) TST. D) 5 μM CYP3A4 with close to saturating (640 μM) TST and 1 equiv. (5 μM) ANF. The independent peak fits are shown as dotted lines and the solid lines are the sum of the fits
Estimation of low spin and high spin concentration of CYP3A4 in the presence of ANF and TST
Curve fitting has been used previously to determine the %LS and %HS in CYPs [15, 40, 41]. Determining the fraction of LS and HS can provide insight into the coupling between spin state and ligand binding [15]. The absorbance bands of CYP3A4 between 300–500 nm reflect the spin-state state equilibria between the LS and HS-states of the bound heme. There are three overlapping absorbance bands that are found in this region: δ-band, HS and LS Soret bands. The HS and LS Soret bands are obviously associated with the HS and LS heme, respectively, while the δ-band has not been ascribed to a specific property of the heme in the literature. These bands can be deconvoluted by curve fitting as previously described [15, 40]. From the areas of the Soret peaks, the relative concentration of HS and LS can be calculated with respect to suitable controls.
Originally, the %LS and %HS were determined with CYP3A4 in the presence of saturating aniline as a LS reference [15, 41]. However, this could be problematic if the extinction coefficients of the CYP3A4 heme Soret bands are reduced in the presence of ANF, as suggested by the spectral results. Therefore, the %LS and %HS will be calculated as described for P450eryF in the presence of 9AP [41] and in the materials and methods. CYP3A4 without ligands was used to determine the %LS and %HS of CYP3A4 with ligands that yield known spin state at saturation [15].
Figure 4 shows curve fitting in the presence and absence of ANF and TST. Figure 4A shows the absolute UV-vis absorbance spectrum in the absence of ligands with curve fitting shown as dotted lines. The δ-band, HS and LS Soret bands are found at 375 nm, 396 nm, and 419 nm, respectively. The %LS and %HS were 83% and 17%, respectively, as shown previously [15].
Figure 4B shows the absolute absorbance spectrum and curve fitting in the presence of saturating (256 μM) ANF. The δ-band, LS and HS Soret bands were found at 365 nm, 396 nm, and 419 nm, respectively. The ratios of the LS and HS Soret bands were compared against the corresponding bands of CYP3A4 as described in the materials and methods. The KSPIN′ and %LS were 0.587 and 63%, respectively. This is very close to the value determined by Tsalkova and coworkers of 64% [29].
Figure 4C is the absolute absorbance spectrum with 70% saturation (i.e. 640 μM) of TST bound to CYP3A4. The δ-band and the HS and LS Soret peaks were found at 372 nm, 392 nm, and 418 nm, respectively. Again, the ratio method was employed. The KSPIN′ was 0.667 and the corresponding %LS =60%. By extrapolating to 100% TST, the %LS would be close to 50% as previously observed using the LS as a reference instead of the ratio method [15].
Figure 4D shows the absolute absorbance spectrum of 640 μM TST with 1 equivalent (5 μM) ANF. The δ-band, HS, and LS Soret bands were found at 375 nm, 396 nm, and 419 nm, respectively. The KSPIN′ and %LS were 0.818 and 55%, respectively, which is close to the value determined for TST alone [15].
Gepasi simulations of calculated %HS of CYP3A4 in the presence of ANF and TST
Simulations can provide useful insight into the binding behavior of ligands to CYP3A4. In Figure 5, using the normalized absorbance difference and the fraction of HS and LS in the presence and absence of ligands, the %HS was calculated in the presence of ANF, TST, and TST with 1 equivalent ANF. The curves were then fit with GEPASI and are shown as solid lines.
Figure 5.
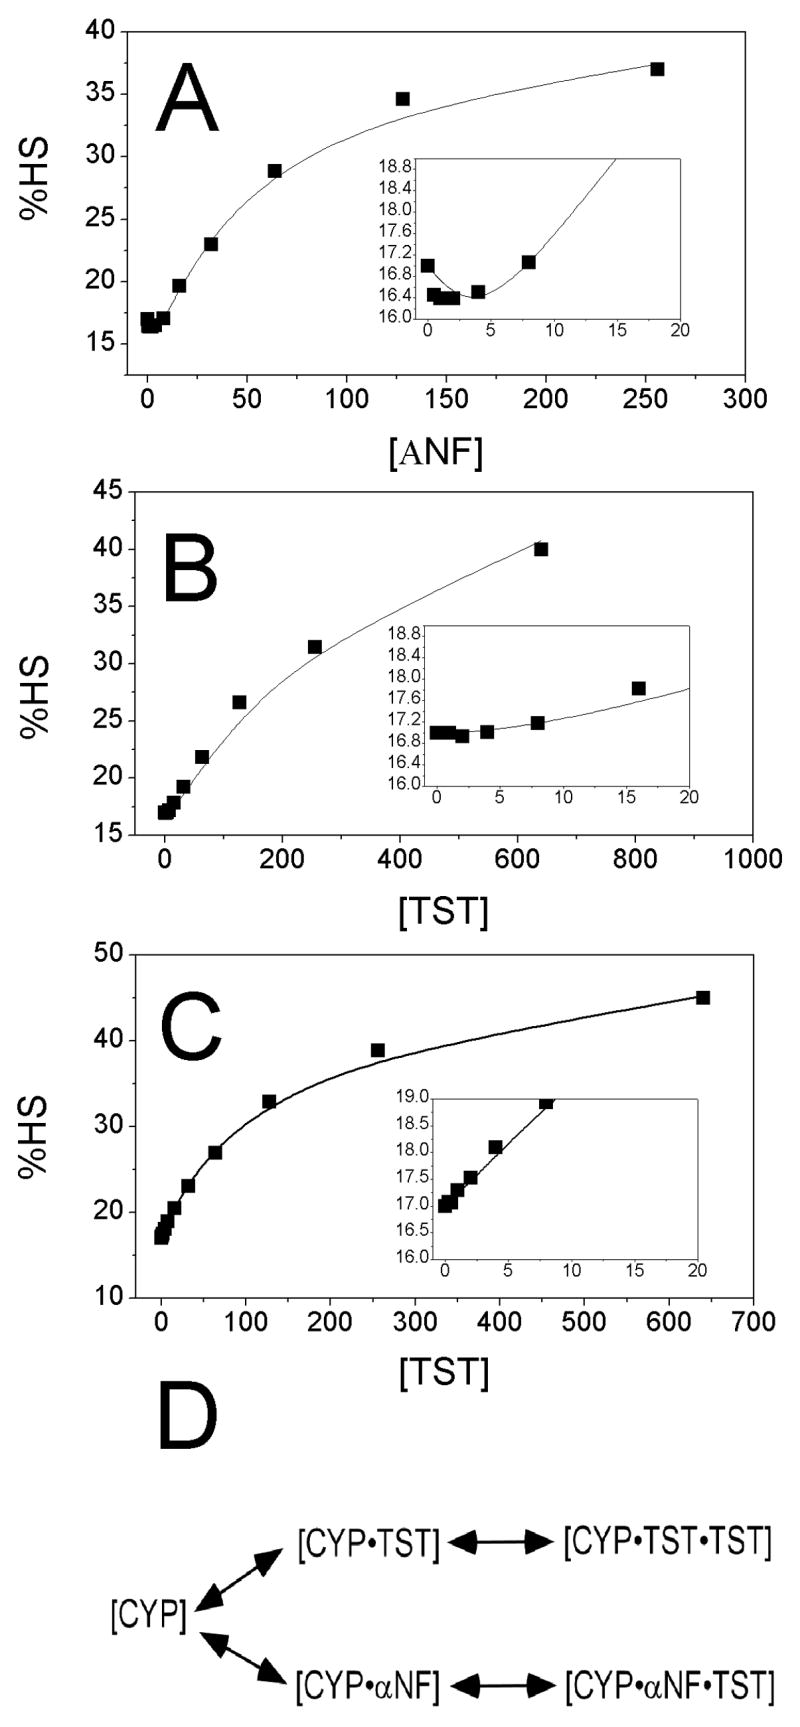
Change in %HS in the presence of ANF and TST calculated from normalized absorbance difference and curve fitting. Change in %HS in the presence of A)ANF, B) TST, and C) TST in the presence of 1 equivalent ANF with the 0–20 μM regions enlarged in the inset. D) Equilibria between TST and ANF used to fit C)
Figure 5A shows the affect of ANF on the %HS. At low concentrations of ANF, there are very little changes in spin state. A break occurs at one equivalent ANF followed by a shift to the HS state. Fitting this curve with GEPASI results in a KD(L1) and KD(L2) of 1 ± 0.5 μM, and 55 ± 3 μM, respectively. The fs1 and fs2 from this fitting were 7% and 93%, respectively.
This is compared with the effects of binding TST to CYP3A4 as shown in Figure 5B. No significant changes are observed in the CYP3A4 heme Soret bands until > 1 equivalent TST [15]. This is followed by an increase to the HS state that qualitatively mirrors the affects of ANF. Analysis with GEPASI produced KD(L1) and KD(L2) values of 20 ± 13μM and 400 ± 37μM, respectively, which were very similar to previously determined values [15]. The fractional spin state changes of the two binding sites were fS1=~0% and fS2=100%, indicating that the spin-state shift primarily occurs with the formation of the CYP●TST●TST complex.
Figure 5C show a TST titration of CYP3A4 in the presence of 1 equivalent ANF. A TST titration performed in the presence of 1 equivalent ANF was a hyperbolic curve instead of a sigmoidal curve. Similar effects on the TST titration curves in the presence of ANF were observed in a fluorescently-labeled CYP3A4 mutant, CYP3A4(C58,C64)-BADAN [29]. The disappearance of the apparent lag phase from the sigmoidal titration curve in the presence of 1 equivalent ANF suggests that the spin-state insensitive binding site of TST is the same as the spin-state insensitive binding site of ANF. Since the binding of ANF is about 20 fold tighter than TST at this spin-state insensitive site, ANF will not be displaced at low [TST]. However, as the [TST] is increased to greater than 100 μM (i.e. (KD(L1) for TST)/(KD(L1) for ANF)*[ANF] = (20 μM)/(1 μM)*(5 μM) =100 μM), TST will begin to compete with the bound ANF, displacing it from this binding site. Eventually, at saturating TST, the ANF will be completely displaced, leading to the formation of the CYP3A4●TST●TST complex. In order to accurately assess the affect of ANF on the binding of TST to the spin-state sensitive binding site, the competition of ANF and TST must be taken into consideration.
Simulation of the curve using the equilibria shown in Figure 5D leads to a KD(L2) for TST in the presence of 1 equivalent ANF of 132 ± 6 μM. This value is tighter than the value determined by fitting the curve with a single exponential with a τ of 155 μM (data not shown), which would be expected since the single exponential fit does not take competition of TST and ANF into account. This value is also about 3-fold tighter than the binding of TST in the absence of ANF. It is clear that occupancy of the high affinity spin state-insensitive ANF binding site causes TST to preferentially occupy its spin state-sensitive binding site even at low TST concentrations. This is consistent with the previously observed “lack” of competition observed between ANF and TST, since they only analyzed the spin-state sensitive binding in their study [29]. Therefore, the high affinity and spin-state insensitive binding sites of TST and ANF are competitive.
EPR spectroscopy CYP3A4 in the presence of ANF and TST
EPR spectroscopy can be a useful tool for probing the electronic environment of the P450 heme [e.g. 15, 51, 52]. In principle either the LS or HS EPR signals can be used to examine the effect of ligand binding on spin state. However the HS and LS EPR signals can not be directly compared against each other because they have totally different saturation and temperature dependence. For example, the HS EPR signal is essentially absent above 20K, while the LS EPR signal can be observed as high as 90K. Another complicating factor is that the HS EPR signal overlaps with the LS EPR signal [53]. In order to calculate the fraction of HS or LS for either EPR signal, suitable controls need to be used and conditions need to be used that avoid overlap between the HS and LS EPR signals. Aniline was found to convert CYP3A4 primarily to LS [15] and is therefore a suitable LS control. However, no comparable ligand was found to convert CYP3A4 completely to HS. Once the fraction of LS or HS is determined, the fraction of the other spin state can be easily calculated, since the CYPs are completely oxidized.
At 77K, the LS EPR absorbance displays three transitions, gz, gy, gx, which roughly correspond to the axes of the heme [54]. Fortuitously, there is little interference from the HS EPR signal at this temperature, which would complicate the measurement. The amplitudes of the LS transitions directly reflect a change in [LS] without interference from overlapping ligand absorbances, which plagued the absorbance titrations. Since the temperature dependence of spin state is small for isolated CYP3A4 [15], experiments performed at this temperature can provide insight into the temperature dependence of ligand binding. In this study, EPR was used to examine the temperature dependence of ANF and TST binding to CYP3A4.
Figure 6 shows the LS heme EPR spectra and double-integration in the presence of ANF and, for comparison, TST and aniline. Figure 6A show the LS heme EPR spectra in the presence of 0 and 19 equivalents of ANF. The LS EPR spectra of CYP3A4 in the absence of ligands show transitions at gz=2.41, gy=2.23, and gx=1.87 with 84% LS and 16% HS as previously observed [15]. With the addition of 0.5 equivalents of ANF, the amplitude of the g-transitions increased, which is consistent with the observed increases in the normalized absorbance difference spectra. No shifts in the g-transitions were observed with the first equivalent ANF. At close to saturating ANF (~2 mM), there is a significant decrease in ANF amplitude of the LS EPR signal, indicating a shift of the equilibrium to the HS-state, which would be expected for “type I” ligands. In addition, there is also a very small shift of the gz transition to gz=2.408. However, ANF never completely saturated CYP3A4 as observed in the UV-Vis titration, suggesting that the binding of ANF to CYP3A4 is considerably weaker at 77K than 298K.
Figure 6.

EPR spectra of CYP3A4 in the presence of ANF at 77K. A) LS EPR spectra in the presence of various concentrations of ANF. B) Double integrated intensity of the LS EPR as a function of ANF concentration. The LS EPR signal with saturating aniline (~22 mM). C) Amplitude of the double integration as a function of ANF (solid squares) and TST (open circles). EPR parameters are as follows: temperature = 77K, modulation amplitude = 16 gauss, microwave frequency = ~9.4 GHz, microwave power = 6.32 mW, conversion time = 1310.72 ms, time constant = 81.92 ms.
Figure 6B shows the double integration of the LS EPR signals plotted as a function of [ANF] as described in [15]. The amplitude of the double integration is shown in Figure 6C (closed squares). The double integrated amplitude increases somewhat to about 2.5 equivalents. After 2.5 equivalents, the amplitude decreases to about 60% LS. Quantitative measurements of ANF binding were made by fitting the data in Figure 5C to the sequential ordered binding model with the GEPASI computer program. For ANF binding to CYP3A4, the dissociation constants determined from this simulation were KD(L1)=1000 ± 386 μM and KD(L2) = 680 ± 263 μM.
The double integrated amplitude of CYP3A4 in the presence of TST from [15] were also plotted on Figure 5C (open circles). As observed previously, there is very little change in spin state until the [TST] is greater than 1 equivalent. Then the %LS decreases until about 50%. The fitted dissociation constants for this ligand were KD(L1)=72 ± 35 μM and KD(L2) = 844 ± 72 μM.
Qualitatively, ANF and TST both exhibit the strongest effects on the spin state of CYP3A4 after 1 equivalent of the corresponding ligands, while exerting only minute or no effects below 1 equivalent. In other words, binding of ANF and TST appear to have similar effects on the CYP3A4 LS heme EPR signal.
Thermodynamics ANF and TST binding to CYP3A4
Previously, we showed that the binding thermodynamics of TST could be deconvoluted because of apparent negative cooperativity of the ligand and relatively high [CYP3A4] [15]. In this study, both ANF and TST appear to bind with similar apparent negative cooperativity and they have qualitatively similar effects on the UV-vis and EPR spectra. There are, however, significant differences in the binding affinities of ANF and TST to CYP3A4. This property was used to probe the heterotropic cooperativity between ANF and TST bound to CYP3A4.
Thermodynamic analysis can be useful for examining the energetic relationships between binding and spin-state. Because thermodynamic parameters are compared on a logarithm scale, thermodynamic values are only sensitive to dramatic changes in the KD. In other words, this type of analysis is insensitive to moderate experimental errors from using UV-vis and EPR spectroscopies.
One can graphically visualize the thermodynamic relationship by plotting the free energy of binding (i.e. ΔG) as a function of occupancy as shown in Figure 7 [41]. A line segment can then be used to represent the relative cooperativity between CYP●L and CYP●L●L. The slope of the line segment and the difference in ΔG’s between CYP●L and CYP●L●L defines the coupling free energy (ΔΔG), which is a quantitative measurement of cooperativity [15, 41]. Negative coupling free energy, which has a negative slope in the plots, reflects positive cooperativity between CYP●L and CYP●L●L (i.e. KD(L2)<KD(L1)). In contrast, positive coupling free energy, which has positive slope in the plots, is indicative of apparent negative cooperativity (i.e. KD(L2)>KD(L1)).
Figure 7.

Free energy of binding and temperature dependence of ANF binding to CYP3A4. Cooperativity plots of A) ANF and B) TST at 25°C (closed squares) and 77K (open circles). C) Cooperativity plot of the formation of CYP●TST●TST versus CYP●ANF●TST.
Figure 7A and B shows the ΔG of binding at different temperatures. The temperature dependence of ligand binding to CYP3A4 is not well documented, and we observed a remarkable difference in the temperature dependence of TST versus ANF binding. Because of the weak temperature dependence of spin state in isolated CYP3A4 [15], strong temperature dependent binding would suggest a ligand-induced temperature-dependent conformational change [e.g. 55, 56, 57]. A critically important feature of this ligand-dependent temperature effect is that it emphasizes that the putative conformational change is also ligand-dependent. Not all ligands that bind at the peripheral site necessarily induce the same conformational change.
Figure 7A shows the binding of ANF at 77K and 25°C. We showed that binding of ANF has a KD(L1) and KD(L2) at 25oC of 1 μM and 55 μM, respectively. This translates into ΔG(L1) and ΔG(L2) of −8.3 kcal mol−1 and −5.9 kcal mol−1, respectively (ΔG = 1.376 kcal mol−1 log (KD)). The ΔΔG(25°C) of this binding was +2.4 kcal mol−1, showing that it behaves in a negatively cooperative fashion. This is in contrast to binding at 77K, where the KD(L1) and KD(L2) are 1000 μM and 680 μM, respectively. The ΔG(L1), ΔG(L2), and ΔΔG(77K) are −4.1 kcal mol−1, −4.4 kcal mol−1, and −0.3 kcal mol−1, respectively, which represents weakly positive cooperative binding of ANF to CYP3A4.
The temperature dependence of ANF binding could result from a temperature dependent change in solubility. The observed weaker binding for ANF at 77K would indicate that there was an increase in solubility at 77K than at 298K. In other words, ANF concentration would be higher in the bulk aqueous phase than bound to the protein. However, the effect of solubility on the binding constants should be similar, since solubility would only affect exchange into the bulk aqueous phase. Therefore, the ΔΔGs between 25°C and 77K should not show significant differences in this case. Instead, there is a significant difference between the ΔΔGs at 25°C and 77K (i.e. ΔΔG(25°C)-ΔΔG(77K)=2.4 kcal mol−1-(−0.3 kcal mol−1)=2.7 kcal mol−1). These results suggest that formation of CYP3A4●ANF and CYP3A4●ANF●ANF are not solely due to solubility. Therefore, the formation of CYP3A4●ANF and CYP3A4●ANF●ANF may be coupled to the temperature-dependent conformations of CYP3A4.
Figure 7B shows the binding thermodynamics of TST at 77K and 25°C, using data from [15]. The KD(L1) and KD(L2) of TST at 25oC to CYP3A4 of 20 μM and 400 μM, respectively. This is quite similar to the KD(L1) and KD(L2) of TST at 77K of 72 μM and 844 μM, respectively, by analysis with GEPASI. These values can be represented as ΔGs with ΔG(L1) and ΔG(L2) at 25°C of −6.5 kcal mol−1 and −4.7 kcal mol−1. At 77K, the ΔG(L1) and ΔG(L2) are −5.7 kcal mol−1 and −4.2 kcal mol−1, which differs little from the values at 25°C. The ΔΔG of the binding at 25°C and 77K is 1.8 kcal mol−1 and 1.5 kcal mol−1, respectively, which is only a 0.3 kcal mol−1 difference in ΔΔG between the two temperatures.
Figure 7C shows the affect of ANF on the formation of the CYP●ANF●TST and CYP●TST●TST. Formation of CYP●TST●TST complex (i.e. KD(L2) for TST) had a KD(L2) and ΔG(L2) of 400 μM and −4.7 kcal mol−1, respectively. On the other hand, formation of the CYP●ANF●TST complex had a KD and corresponding ΔG(L2) of 132 μM and −5.3 kcal mol−1, respectively. The difference in ΔG between formation of CYP●TST●TST and CYP●ANF●TST (i.e. ΔΔG) was −0.6 kcal mol−1 or a 3-fold difference in the KD. Therefore, ANF binding has a positively cooperative effect on the formation of CYP●ANF●TST as shown by the negative slope in the cooperativity plot.
Discussion
The binding of TST and ANF to CYP3A4 have been studied by several labs and the heterotropic interactions between these ligands are well appreciated. However, no detailed analysis of the energetics of the cooperativity has been reported. From our current study at high [CYP3A4], we were able to deconvolute the individual binding events of TST and ANF. By combining the individual parameters for the various binding events, we are able to produce a working model of heterotropic cooperativity.
The formation of CYP●ANF or CYP●TST leads to very little change in spin-state of the heme. This spin-state insensitive binding reveals itself as a lag phase in the TST and ANF titrations of CYP3A4. However, in the presence of 1 equivalent ANF, the lag phase disappears in the TST titration of CYP3A4, resulting in a “hyperbolic” titration curve. In terms of cooperativity measured by Hill analysis, this would appear as a decrease in the Hill coefficient. This correlates well with the fluorescently-labeled CYP3A4 mutant, CYP3A4(C58,C64)-BADAN, where the n-value reduced to 1 in the presence of ANF and TST [49]. Also, the kinetics of 6β-hydroxylation of TST, which showed a marked decrease in the apparent cooperativity from n=1.3 to 1.1 in the presence of ANF [14]. Another study looked at the effect of ANF on rabbit CYP3A6 and human CYP3A4 steroid metabolism and a decrease in cooperativity was also observed [32]. These studies suggested that ANF reduced the cooperativity of binding and steroid metabolism [14, 32, 49]. A simpler explanation is that the ANF competes with TST for the same spin-state insensitive binding site as shown in our study.
The fact that this site induces very little change in spin-state might suggest that the ligand is relatively far from the heme. In fact, the x-ray crystal structure of CYP3A4 with progesterone bound suggested that there is a progesterone binding site that is 17 Å from the heme [21]. Due to the structural similarities between TST and progesterone, we previously asserted that TST was bound at this site [15]. Since ANF and TST appear to compete for the same spin-state insensitive binding site, we propose ANF also binds at this peripheral binding site.
In the thermodynamic analysis of the TST titrations of CYP3A4 in the presence of 1 equivalent ANF, ANF appeared to increase TST’s affinity for the spin state sensitive binding site. The 3-fold increased binding affinity of TST in the presence of ANF would correlate well with the 2–3 fold stimulation of the metabolism of TST by ANF [25]. Cooperativity between two ligand binding sites can occur by direct interaction between ligands or by indirect interaction through the protein. The x-ray crystal structure of 9-aminophenanthrene (9AP) and androstenedione with P450eryF is one example of positive cooperativity by direct interaction of one ligand to another [23]. In this case, one ligand binds to the heme, forming the tight binding site for the second ligand. For 9AP, the two molecules that form the P450●9AP●9AP complex appear to induce similar effects on the spin-state of the heme, which is not surprising considering their close proximity to the heme [41]. Taking steric considerations into account implies that the “first” 9AP binds closest to the heme [23]. Using the x-ray crystal structure of P450eryF bound with either 9AP or androstenedione as a model for ANF and TST binding, the tight binding site would be at the heme, forming the weak binding site for the other ligand. The tight binding site for both ANF and TST induces little change in spin-state of CYP3A4 suggests that it is not bound close to the heme. In fact, the x-ray crystal structure of CYP3A4 with progesterone bound shows that there is a tight binding site peripheral to the active site that lies 17 Å from the heme [21]
Cooperativity by indirect interaction (i.e. allosteric interaction) has been classically demonstrated in hemoglobin [58–60]. The idea of structurally distinct populations or conformational changes of CYP3A4 has been suggested previously [16, 28, 61]. From this study, there are a couple of lines of evidence that support allosteric interaction of TST metabolized at the heme from a remote site in CYP3A4 with ANF. First, the binding of ANF at the spin-state insensitive binding site leads to positive cooperativity toward the spin-state sensitive binding site of TST. Second, the binding of ANF at the spin-state insensitive site is highly temperature dependent with a 1000 fold decrease in binding affinity from 298K and 77K, suggesting a protein conformational transition concomitant with ANF binding to the spin state-insensitive binding site.
Further evidence for the possibility of long range allosteric interactions comes from mutations performed previously on the “substrate site recognition” residues of CYP3A4 (i.e. F108, S119, I120, I210, F213, F215, I301, L373 and L479 in [13] and the double mutant L211 and D214 in [25]) and are now reviewed in the context of the recently solved x-ray crystal structure of CYP3A4 with progesterone [21], which is shown in Figure 8. The residues are color coded according to their effect on ANF modulation of progesterone and TST metabolism with red, yellow, and green, indicating strongest to weakest effect. The residue F213, which is in direct contact with the progesterone molecule, and residue 479, which lies close to the progesterone binding niche, are found to have a moderate affect on ANF modulation of progesterone metabolism [13]. The residues corresponding to the double mutant, L211 and D214, which also are close to the progesterone molecule, induce very strong effects on both modulation of TST and progesterone metabolism by ANF [25]. Both of these results support the proposal that ANF binds at this peripheral binding site. In addition, there are several other residues that do induce significant changes in the interaction and lie far from the binding site (i.e. I210 and L373). Therefore, this distribution of amino acids strongly suggests that a long conformational changes occur between the ANF binding site, which we propose is the progesterone binding site, and the active site near the heme.
Figure 8.
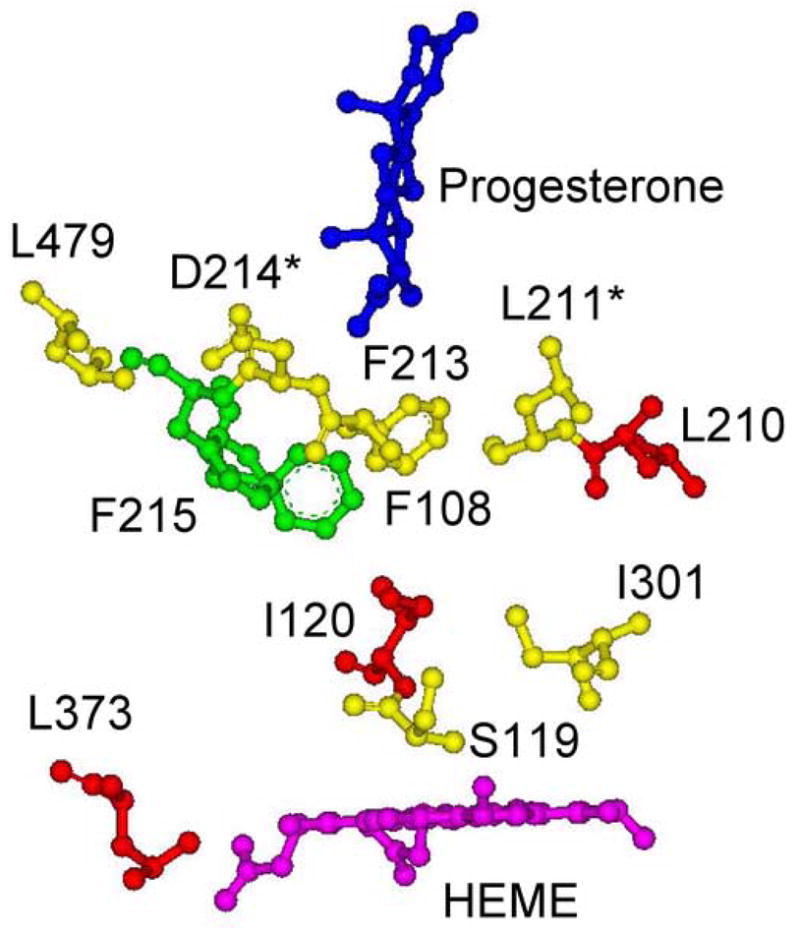
X-ray crystal structure of CYP3A4 with progesterone-bound, showing mutated residues that had effects on ANF modulation of progesterone metabolism. The residues F108, S119, I120, I210, F213, F215, L373 and L479 from [13] and residues L211 and D214 from [25] are color coded according to their effect. Residues colored red have greater than 2 fold affects on ANF modulation of progesterone or TST metabolism. Residues colored yellow have between 1 fold and 2 fold affects on ANF modulation of progesterone or TST metabolism. Residues colored green show between 0 and 1 fold affect on ANF modulation of progesterone or TST metabolism.* Denotes the residues that correspond to the double mutant (i.e. L211 and D214) of [25].
The working model of heterotropic cooperativity observed between TST and ANF is shown in Figure 9. Figure 9A and B show binding of TST in the absence and presence of 1 equivalent ANF, respectively. Figure 9A shows the binding of TST at the peripheral binding site leads to very little conformational changes in the heme active site. A conclusion made by the apparent weak temperature dependence of TST binding to CYP3A4 (Figure 7B). This is supported by the x-ray crystal structure of CYP3A4 with [21] and without [22] progesterone, which showed that there are only very minor differences between these two structures (data not shown). Figure 9B shows the binding affect of ANF on TST binding. The peripheral (distal) or spin-state insensitive binding site of CYP3A4 is occupied by ANF, while the proximal or spin-state sensitive binding site can be occupied by TST. In this case, the ANF induces significant conformational changes to CYP3A4, leading to approximately a 3-fold increase in the affinity for TST binding to the proximal binding site. The ANF molecule locks the CYP3A4 into a conformation that is distinct from the conformation without ligands. This is followed by the metabolism of TST at the proximal binding niche that is near the heme, leading to stimulation of TST metabolism and the TST metabolic profile that was previously observed [25]. Finally, Figure 9 is somewhat similar to a model proposed by Isin et al. [16], in which the ligand, bromocriptine, binds first at a peripheral site and conformational changes occur at active site. Although our work does not address kinetic aspects of the individual sites, the two models are generally consistent with each other, and the current model provides a thermodynamic basis for heterotropic effects in CYP3A4.
Figure 9.

Working model of binding of ANF and TST to CYP3A4. A) Binding of TST occurs in a sequential fashion, where the “first” TST binds to a distal peripheral binding site. Once this site is occupied by TST, a “second” TST can bind near the heme, where it is metabolized. B) The binding of ANF competes with TST for the peripheral binding niche. The binding of ANF leads to a conformational change in the CYP3A4. TST then preferentially binds near the heme with higher affinity toward this binding site than in the absence of ANF.
Acknowledgments
This work was supported by National Institutes of Health Grants, GM32165 and T32 07750, and the Center for Ecogenetics and Environmental Health from the National Institute of Environmental Health Sciences, University of Washington center grant #P30ES07033.
Footnotes
Publisher's Disclaimer: This is a PDF file of an unedited manuscript that has been accepted for publication. As a service to our customers we are providing this early version of the manuscript. The manuscript will undergo copyediting, typesetting, and review of the resulting proof before it is published in its final citable form. Please note that during the production process errors may be discovered which could affect the content, and all legal disclaimers that apply to the journal pertain.
References
- 1.Guengerich FP. Annu Rev Pharmacol Toxicol. 1999;39:1–17. doi: 10.1146/annurev.pharmtox.39.1.1. [DOI] [PubMed] [Google Scholar]
- 2.Ortiz de Montellano PR. Cytochrome P450: Structure, Mechanism, and Biochemistry. Plenum Publishing; New York: 2004. [Google Scholar]
- 3.Guengerich FP. In: Cytochrome P450: Structure, Mechanism, and Biochemistry. Ortiz de Montellano PR, editor. Plenum; New York: 1995. [Google Scholar]
- 4.Atkins WM. Drug Discovery Today. 2004;9:478–484. doi: 10.1016/S1359-6446(04)03072-7. [DOI] [PubMed] [Google Scholar]
- 5.Egnell AC, Houston B, Boyer S. 2003;305:1251–1262. doi: 10.1124/jpet.102.047530. [DOI] [PubMed] [Google Scholar]
- 6.Egnell AC, Houston JB, Boyer CS. J Pharmacol Exp Ther. 2005;312:926–937. doi: 10.1124/jpet.104.078519. [DOI] [PubMed] [Google Scholar]
- 7.Hutzler JM, Frye RF, Korzekwa KR, Branch RA, Huang SM, Tracy TS. Eur J Pharm Sci. 2001;14:47–52. doi: 10.1016/s0928-0987(01)00144-0. [DOI] [PubMed] [Google Scholar]
- 8.Lasker JM, Huang MT, Conney AH. Science. 1982;216:1419–1421. doi: 10.1126/science.7089530. [DOI] [PubMed] [Google Scholar]
- 9.Lasker JM, Huang MT, Conney AH. J Pharmacol Exp Ther. 1984;229:162–170. [PubMed] [Google Scholar]
- 10.Tang W, Stearns RA, Kwei GY, Iliff SA, Miller RR, Egan MA, Yu NX, Dean DC, Kumar S, Shou M, Lin JH, Baillie TA. 1999;291:1068–1074. [PubMed] [Google Scholar]
- 11.Shou M, Grogan J, Mancewicz JA, Krausz KW, Gonzalez FJ, Gelboin HV, Korzekwa KR. Biochemistry. 1994;33:6450–6455. doi: 10.1021/bi00187a009. [DOI] [PubMed] [Google Scholar]
- 12.Korzekwa KR, Krishnamachary N, Shou M, Ogai A, Parise RA, Rettie AE, Gonzalez FJ, Tracy TS. Biochemistry. 1998;37:4137–4147. doi: 10.1021/bi9715627. [DOI] [PubMed] [Google Scholar]
- 13.Domanski TL, He YA, Khan KK, Roussel F, Wang Q, Halpert JR. Biochemistry. 2001;40:10150–10160. doi: 10.1021/bi010758a. [DOI] [PubMed] [Google Scholar]
- 14.Ueng YF, Kuwabara T, Chun YJ, Guengerich FP. Biochemistry. 1997;36:370–381. doi: 10.1021/bi962359z. [DOI] [PubMed] [Google Scholar]
- 15.Roberts AG, Campbell AP, Atkins WM. Biochemistry. 2005;44:1353–1366. doi: 10.1021/bi0481390. [DOI] [PubMed] [Google Scholar]
- 16.Isin EM, Guengerich FP. J Biol Chem. 2006;281:9127–9136. doi: 10.1074/jbc.M511375200. [DOI] [PubMed] [Google Scholar]
- 17.Koley AP, Buters JT, Robinson RC, Markowitz A, Friedman FK. J Biol Chem. 1995;270:5014–5018. doi: 10.1074/jbc.270.10.5014. [DOI] [PubMed] [Google Scholar]
- 18.Koley AP, Buters JT, Robinson RC, Markowitz A, Friedman FK. J Biol Chem. 1997;272:3149–3152. doi: 10.1074/jbc.272.6.3149. [DOI] [PubMed] [Google Scholar]
- 19.Smith SV, Koley AP, Dai R, Robinson RC, Leong H, Markowitz A, Friedman FK. Biochemistry. 2000;39:5731–5737. doi: 10.1021/bi000129l. [DOI] [PubMed] [Google Scholar]
- 20.Ekroos M, Sjogren T. Proc Natl Acad Sci U S A. 2006;103:13682–13687. doi: 10.1073/pnas.0603236103. [DOI] [PMC free article] [PubMed] [Google Scholar]
- 21.Williams PA, Cosme J, Vinkovic DM, Ward A, Angove HC, Day PJ, Vonrhein C, Tickle IJ, Jhoti H. Science. 2004;305:683–686. doi: 10.1126/science.1099736. [DOI] [PubMed] [Google Scholar]
- 22.Yano JK, Wester MR, Schoch GA, Griffin KJ, Stout CD, Johnson EF. J Biol Chem. 2004;279:38091–38094. doi: 10.1074/jbc.C400293200. [DOI] [PubMed] [Google Scholar]
- 23.Cupp-Vickery J, Anderson R, Hatziris Z. Proc Natl Acad Sci U S A. 2000;97:3050–3055. doi: 10.1073/pnas.050406897. [DOI] [PMC free article] [PubMed] [Google Scholar]
- 24.Shou M, Mei Q, Ettore MW, Jr, Dai R, Baillie TA, Rushmore TH. Biochem J. 1999;340( Pt 3):845–853. [PMC free article] [PubMed] [Google Scholar]
- 25.Harlow GR, Halpert JR. Proc Natl Acad Sci U S A. 1998;95:6636–6641. doi: 10.1073/pnas.95.12.6636. [DOI] [PMC free article] [PubMed] [Google Scholar]
- 26.Fernando H, Halpert JR, Davydov DR. Biochemistry. 2006;45:4199–4209. doi: 10.1021/bi052491b. [DOI] [PMC free article] [PubMed] [Google Scholar]
- 27.Baas BJ, Denisov IG, Sligar SG. Arch Biochem Biophys. 2004;430:218–228. doi: 10.1016/j.abb.2004.07.003. [DOI] [PubMed] [Google Scholar]
- 28.Hosea NA, Miller GP, Guengerich FP. Biochemistry. 2000;39:5929–5939. doi: 10.1021/bi992765t. [DOI] [PubMed] [Google Scholar]
- 29.Denisov IG, Baas BJ, Grinkova YV, Sligar SG. J Biol Chem. 2007;282:7066–7076. doi: 10.1074/jbc.M609589200. [DOI] [PubMed] [Google Scholar]
- 30.Wang RW, Newton DJ, Liu N, Atkins WM, Lu AY. Drug Metab Dispos. 2000;28:360–366. [PubMed] [Google Scholar]
- 31.Galetin A, Clarke SE, Houston JB. Drug Metab Dispos. 2003;31:1108–1116. doi: 10.1124/dmd.31.9.1108. [DOI] [PubMed] [Google Scholar]
- 32.Schwab GE, Raucy JL, Johnson EF. Mol Pharmacol. 1988;33:493–499. [PubMed] [Google Scholar]
- 33.Shimada T, Guengerich FP. Proc Natl Acad Sci U S A. 1989;86:462–465. doi: 10.1073/pnas.86.2.462. [DOI] [PMC free article] [PubMed] [Google Scholar]
- 34.Yun CH, Wood M, Wood AJ, Guengerich FP. Anesthesiology. 1992;77:467–474. doi: 10.1097/00000542-199209000-00011. [DOI] [PubMed] [Google Scholar]
- 35.Raney KD, Shimada T, Kim DH, Groopman JD, Harris TM, Guengerich FP. Chem Res Toxicol. 1992;5:202–210. doi: 10.1021/tx00026a009. [DOI] [PubMed] [Google Scholar]
- 36.Ueng YF, Shimada T, Yamazaki H, Guengerich FP. Chem Res Toxicol. 1995;8:218–225. doi: 10.1021/tx00044a006. [DOI] [PubMed] [Google Scholar]
- 37.Jefcoate CR. Methods Enzymol. 1978;52:258–279. doi: 10.1016/s0076-6879(78)52029-6. [DOI] [PubMed] [Google Scholar]
- 38.Hildebrandt A, Remmer H, Estabrook RW. Biochem Biophys Res Commun. 1968;30:607–612. doi: 10.1016/0006-291x(68)90555-x. [DOI] [PubMed] [Google Scholar]
- 39.Omura T, Sato R. J Biol Chem. 1964;239:2379–2385. [PubMed] [Google Scholar]
- 40.Jung C, Ristau O, Rein H. Biochim Biophys Acta. 1991;1076:130–136. doi: 10.1016/0167-4838(91)90229-s. [DOI] [PubMed] [Google Scholar]
- 41.Roberts AG, Díaz MD, Lampe JN, Shireman LM, Grinstead JS, Dabrowski MJ, Pearson JT, Bowman MK, Atkins WM, Campbell AP. Biochemistry. 2006;45:1673–1684. doi: 10.1021/bi0518895. [DOI] [PubMed] [Google Scholar]
- 42.Ristau O, Rein H, Greschner S, Janig GR, Ruckpaul K. Acta Biol Med Ger. 1979;38:177–185. [PubMed] [Google Scholar]
- 43.Shkumatov VM, Smettan G, Ristau O, Rein H, Ruckpaul K, Chaschin VL, Akhrem AA. Chem Biol Interact. 1988;68:71–83. doi: 10.1016/0009-2797(88)90007-5. [DOI] [PubMed] [Google Scholar]
- 44.Guengerich FP. Biochemistry. 1983;22:2811–2820. doi: 10.1021/bi00281a007. [DOI] [PubMed] [Google Scholar]
- 45.Dawson JH, Andersson LA, Sono M. J Biol Chem. 1982;257:3606–3617. [PubMed] [Google Scholar]
- 46.Mendes P, Kell D. Bioinformatics. 1998;14:869–883. doi: 10.1093/bioinformatics/14.10.869. [DOI] [PubMed] [Google Scholar]
- 47.Mendes P. Trends Biochem Sci. 1997;22:361–363. doi: 10.1016/s0968-0004(97)01103-1. [DOI] [PubMed] [Google Scholar]
- 48.Mendes P. Comput Appl Biosci. 1993;9:563–571. doi: 10.1093/bioinformatics/9.5.563. [DOI] [PubMed] [Google Scholar]
- 49.Tsalkova TN, Davydova NY, Halpert JR, Davydov DR. Biochemistry. 2007;46:106–119. doi: 10.1021/bi061944p. [DOI] [PMC free article] [PubMed] [Google Scholar]
- 50.Shou M, Dai R, Cui D, Korzekwa KR, Baillie TA, Rushmore TH. J Biol Chem. 2001;276:2256–2262. doi: 10.1074/jbc.M008799200. [DOI] [PubMed] [Google Scholar]
- 51.Cammer W, Schenkman JB, Estabrook RW. Biochem Biophys Res Commun. 1966;23:264–268. doi: 10.1016/0006-291x(66)90539-0. [DOI] [PubMed] [Google Scholar]
- 52.Jefcoate CR, Gaylor JL. Biochemistry. 1969;8:3464–3472. doi: 10.1021/bi00836a050. [DOI] [PubMed] [Google Scholar]
- 53.Peisach J, Blumberg WE. Proc Natl Acad Sci U S A. 1970;67:172–179. doi: 10.1073/pnas.67.1.172. [DOI] [PMC free article] [PubMed] [Google Scholar]
- 54.Taylor CP. Biochim Biophys Acta. 1977;491:137–148. doi: 10.1016/0005-2795(77)90049-6. [DOI] [PubMed] [Google Scholar]
- 55.Kensch O, Restle T, Wohrl BM, Goody RS, Steinhoff HJ. J Mol Biol. 2000;301:1029–1039. doi: 10.1006/jmbi.2000.3998. [DOI] [PubMed] [Google Scholar]
- 56.Urbanova M, Pancoska P, Keiderling TA. Biochim Biophys Acta. 1993;1203:290–294. doi: 10.1016/0167-4838(93)90096-a. [DOI] [PubMed] [Google Scholar]
- 57.Allen B, Blum M, Cunningham A, Tu GC, Hofmann T. J Biol Chem. 1990;265:5060–5065. [PubMed] [Google Scholar]
- 58.Wyman J., Jr J Biol Chem. 1939;127:1–13. [Google Scholar]
- 59.Royer WE, Jr, Knapp JE, Strand K, Heaslet HA. Trends Biochem Sci. 2001;26:297–304. doi: 10.1016/s0968-0004(01)01811-4. [DOI] [PubMed] [Google Scholar]
- 60.Hill AV. Biochem J. 1913;7:471–480. doi: 10.1042/bj0070471. [DOI] [PMC free article] [PubMed] [Google Scholar]
- 61.Davydov DR, Halpert JR, Renaud JP, Hui Bon Hoa G. Biochem Biophys Res Commun. 2003;312:121–130. doi: 10.1016/j.bbrc.2003.09.247. [DOI] [PubMed] [Google Scholar]