

Abstract
For 50 years, physiologic studies in Candida albicans have associated fermentation with filamentation and respiration with yeast morphology. Analysis of the mitochondrial proteome of a C. albicans NDH51 mutant, known to be defective in filamentation, identified increased expression of several proteins in the respiratory pathway. Most notable was a 15-fold increase in pyruvate dehydrogenase complex protein X (Pdx1), an essential component of the pyruvate dehydrogenase complex. In basal salts medium with 100 mM glucose as carbon source, two independent pdx1 mutants displayed a filamentation defect identical to ndh51; reintegration of one PDX1 allele restored filamentation. Concentrations of glucose ≤100 mM did not correct the filamentation defect. Expanding on previous work, these studies suggest that increased expression of proteins extraneous to the electron transport chain compensates for defects in the respiratory pathway to maintain yeast morphology. Mitochondrial proteomics can aid in the identification of C. albicans genes not previously implicated in filamentation.
Keywords: Candida albicans, filamentation, proteomics, pyruvate dehydrogenase complex (PDC), mitochondria, respiration, PDX1, NDH51
Introduction
The human fungal pathogen Candida albicans is particularly noted for its ability to adopt a variety of morphological forms, ranging from unicellular budding yeast cells (blastoconidia) to chains of elongated yeast forms (pseudohyphae) to filamentous forms such as germ tubes or hyphae (Sudbery et al., 2004; Cole et al., 1991). The correlation between filamentous growth and pathogenicity has been recently reviewed (Gow et al., 2002).
Upon initiation of filamentous growth, landmark proteins such as Int1, Rsr1, and Bud2, all localized to the cell wall, establish polarity and are thought to influence signaling pathways that mediate filamentous growth (Gale et al., 1998; Hausauer et al, 2005). Positive regulators include the transcription factors Efg1 (cAMP-dependent protein kinase pathway), Cph1 (the mitogen-activated protein kinase pathway), Rim101 (pH response), and Tec1 (Stoldt et al., 1997; Liu et al, 1994; Ramon et al, 1999; Schweizer et al., 2000), among others. Negative regulation is mediated by Rbf1 and by Tup1 via Rfg1 and Nrg1 (Sharkey et al., 1999; Braun and Johnson, 1997; Kadosh and Johnson, 2001; Murad et al., 2001).
Enhanced filamentation occurs in the presence of quorum-sensing molecules such as tyrosol (Chen et al., 2004), at temperatures ≥ 37° C (Lee et. al., 1975) and at pH 8 (Bensen et al., 2004) In addition, basal salts medium (Torosantucci et al., 1984) with glucose and proline concentrations at 5mM and 10mM, respectively (Vidotto et al., 1996; Land et al., 1975 (1)), 1mM N-acetyl-D-glucosamine (Simonetti et al., 1974), and serum inducers including D-glucose and a non-dialyzable component (Hudson et al., 2004) also influence a shift toward filamentous forms in C. albicans. Filamentation is handicapped by temperature ≤30° C, acidic pH (4.6), high osmolarity (Alex et al., 1998), and nutritionally rich media (Odds, 1988).
In contrast, the influence of the metabolic status of the cell on filamentation has been less well studied. Several early studies in S. cerevisiae and C. albicans showed that organisms with an intact respiratory pathway preferentially maintained yeast morphology (Fisher and Stern, 1942; Nickerson, 1954, 1963; Chattaway et al., 1968, 1973). Conversely, blockade of respiration was associated with increased filamentation (Land et al., 1975 (1); Land et al., 1975 (2)). Surprisingly, disruption of both alleles of C. albicans NADH dehydrogenase (CaNdh51), the 51 kDa major subunit of complex I of the electron transport chain (Nosek and Fukuhara, 1994), generated a mutant unable to display any degree of filamentation in a basal salts medium (Torosantucci et al., 1984) supplemented with a wide range of glucose concentrations (1 mM to 200 mM) as sole carbon source (McDonough et al., 2002). Reintegration of one copy of NDH51 restored filamentation.
In subsequent studies, measurement of intracellular ATP, mitochondrial membrane potential and lipid analysis showed no significant differences between the reference strain (wild type for NDH51) and the ndh51 mutant (Gygax and Hostetter, unpublished). However, treatment with rotenone, a plant isoflavonoid that inhibts the transfer of electrons from Fe-S centers in complex I to ubiquinone (Degli, 1998), converted the reference strain to a non-filamenting phenotype identical to the ndh51 mutant. These results suggested that the ndh51 mutant was somehow “compensating” for the inhibition of respiratory function in order to maintain intracellular ATP, mitochondrial membrane potential, and yeast phenotype.
The introduction of fluorescent 2D differential gel electrophoresis (DIGE) has made it possible to detect and quantitate differences between experimental pairs of samples resolved on the same 2D gel (Unlu et al., 1997). In order to understand what other alterations in the respiratory pathway might be implicated, we analyzed the mitochondrial proteome of the reference strain and the ndh51 mutant under conditions conducive to filamentation. Interestingly, increased expression of mitochondrial proteins was seen only in the ndh51 mutant, predominantly in proteins that function in the respiratory pathways (Fig. 1). In addition to the two- to four-fold increases in the three catalytic core components of the pyruvate dehydrogenase complex (PDC), the magnitude of the 15-fold increase in complex protein X (Pdx1, the structural component of the PDC), prompted us to generate independent pdx1 mutants and to analyze their phenotype; these mutants also displayed defective filamentous growth, regardless of glucose concentration. Figure 1 illustrates the position of the ndh51 mutation in the respiratory pathway and the role of the PDC complex in producing acetyl CoA for entry into the TCA cycle. Under normal conditions, NADH enters the electron transport chain at complex I. In the ndh51 mutant, NADH cannot be converted into ATP because complex I is disabled; rather, FADH2 enters the electron transport chain at complex II.
Figure 1. Schematic diagram of the positions of NDH51 and PDX1 in the respiratory pathway.

The ndh51 mutation (black box) involves a component of complex I of the electron transport chain. The pyruvate dehydrogenase complex (PDC black box) contains several proteins, including Pdx1, and generates acetyl CoA from pyruvate. In the ndh51 mutant, NADH cannot enter the electron transport chain at complex I: rather, FADH2 enters the electron transport chain at complex II.
2. Materials and methods
2.1. Strains, plasmids, media and growth conditions
All C. albicans strains used in this study are derived from the reference strain BWP17 (Wilson et al., 1999); their genotypes are presented in Table 1. E. coli DH5α was purchased from Life Technologies (Gibco BRL) and TOP10 from Invitrogen. pRS-ARG4ΔSpeI, pGEM-URA3 and pGEM-HIS1 were obtained from Aaron Mitchell (Wilson et al., 1999) while pCR2.1-TOPO was purchased from Invitrogen.
Table 1.
Primer sequences and Candida albicans strains
| Primer | Sequencea | Purposeb | |
|---|---|---|---|
| PDX1F | CAATTGTTTTTATCTATTCATTATAATTAATATGCTTAGGGCAGCTTTCACCAGAAGAACAGTTTTCCCAGTCACGACGTTG | Disruption of PDX1 | |
| PDX1R | CTAGTTCTCACTCCCCCGTTGTCCGTTTCCTTTAGTTTGTGATCTTTAACTTGTTGGCTGGTGTGGAATTGTGAGCGGATAA | Disruption of PDX1 | |
| PDX11F | TCTCTACCATCGGACATGTAGTTCCTG | Detection of PDX1 alleles | |
| PDX11R | TTGTTGAGTTTGATGGTGGTGGCTACC | Detection of PDX1 alleles | |
| PDX12F | GAGTGTATAGTGGTCATAAGAGTTTGC | Amplification of PDX1 gene | |
| PDX12R | ATCAGTCACTAATATTGAATGTGCCTC | Amplification of PDX1 gene | |
| Strain | Genotype | Relevant genotypec | Source |
| BWP17 | ura3:: imm434/ura3:: imm434 his1::hisG/his1::hisG arg4::hisG/arg4::hisG | PDX1/PDX1,NDH51/NDN51 | Wilson (1999) |
| BWP17wt | as BWP17 plus arg4::ARG4::URA3/his1::hisG::His1 | PDX1/PDX1, NDH51/NDN51 | Wilson (1999) |
| BWP17AU | as BWP17 plus arg4::hisG::ARG4::URA3 | PDX1/PDX1, NDH51/NDN51 | This work |
| JM02 | as BWP17 plus ndh51::ARG4/ndh51::URA3 | PDX1/PDX1, ndh51/ndh51 | McDonoug(2002) h |
| JM02P | as JM02 plus his::hisG::HIS1 | PDX1/PDX1/ndh51/ndh51 | McDonough (2002) |
| PDX1-2 | as BWP17 plus pdx1::ARG4 | PDX1/pdx1, NDH51/NDH51 | This work |
| PDX1-29 | as PDX1-2 plus pdx1::URA3 | pdx1/pdx1, NDH51/NDH51 | This work |
| PDX1-29R | as PDX1-29 plus his1::hisG::HIS1-PDX1 | pdx1/pdx1/PDX1,NDH51/NDH51 | This work |
| PDX1-29P | as PDX1-29 plus his1::hisG::HIS1 | pdx1/pdx1/NDH51/NDH51 | This work |
Sequences are 5′ to 3′; bold sequences in PDX1F and PDX1R primers are segments that anneal to plasmids pGEM-ARG4 and pGEM-URA3
Relevant use of primer in this study
status of PDX1 and NDH51 only
Colonies of the desired C. albicans strain were inoculated at 30°C on synthetic complete medium agar plates (CM: 0.17% Difco yeast nitrogen base, 0.5% NH4SO4, 2% glucose, 1.5% Bacto-agar, supplemented with appropriate amino acids and, when necessary, 50μg/ml uridine) (Adams et al., 1998). After thawing from glycerol stocks, strains were maintained at 30°C on CM agar plates containing the appropriate supplements; except where noted, single colonies of the desired strain were inoculated into one of two liquid media as indicated: YPD (2% Bacto-peptone, 1% yeast extract, 100mM glucose) or basal salts medium (0.5% NH4SO4, 0.02% MgSO4, 0.5% NaCl, 0.25% K2HPO4, 0.001% biotin, pH 6.5, supplemented with 50ug/ml uridine and/or histidine when necessary to satisfy auxotrophic growth requirements) (Torosantucci et al., 1984) and grown at 30° C with shaking. The carbon source used in the basal salts medium was either glucose (5–100mM) or 100mM potassium acetate. Basal salts medium was supplemented with 80 μg/ml rotenone (Sigma) where indicated.
DH5α and TOP10 cells were grown at 37°C in Luria broth (LB: 1% Bacto tryptone, 0.5% Bacto-yeast extract, 1% NaCl) and on LB plus 1.5% Bacto-agar, supplemented with 50ug/ml ampicillin, when necessary.
For transformations, cells were obtained from overnight cultures grown at 30°C in YPD, sub-cultured at 30°C to OD600 ~ 0.5 in YPD and processed as described under transformations. For filamentation assays, cells were initially grown overnight at 30°C in YPD or basal salts medium (with appropriate supplements and carbon source), washed and diluted to OD600 ~ 0.05 in fresh medium, respectively, and allowed to grow at 30°C to exponential phase before shifting to 37°C for 1 or 2h, as indicated. To compare growth rates, cells were cultured identically as described for filamentation assays and maintained at 30°C over an 8h period, measuring the OD600 at regular intervals. The doubling time was calculated as g = t/[(log N − log N0)/log 2], where t is time in hours, and N and N0 are two different OD600 readings taken in mid-exponential phase over the time interval ‘t’ (Madigan et al., 1997).
2.2 Growth and filamentation in the presence of rotenone
C. albicans strain BWP17wt (prototrophic match for JM02p) was grown overnight at 30°C in YPD, sub-cultured to OD600 ~ 0.05 in basal salts medium, to which was added 80μg/ml rotenone (50mg/ml stock in 100% chloroform). This concentration of rotenone was determined to be the maximum that is not inhibitory to cell growth. For measuring doubling times, cells were grown for 8h at 30°C with OD600 readings at 1h intervals; the doubling time was calculated as described above. Filamentation was assessed by microscopic analysis (brightfield) after 5h growth at 37°C. In cultures grown without rotenone, chloroform was added to a final concentration of 0.16%.
2.3. Sub-cellular fractionation and isolation of C. albicans mitochondrial proteins
For protein purification and subsequent 2D-DIGE analysis, BWP17wt and JM02p were grown overnight at 30°C in YPD, inoculated in 1 liter basal salts medium with 100mM glucose to OD600 = 0.02–0.04 and allowed to grow at 30°C to OD600 ≤ 0.5 before shifting to 37°C for 1 h for hyphal induction and subsequent harvesting by centrifugation at 2000g/4°C/10min. Cells were washed once in cold, sterile H2O and processed as previously described (Cavalheiro et al., 2004). Briefly, cells were washed again in buffer A (1M sorbitol, 10mM MgCl2 and 50mM Tris-HCl, pH 7.8) and wet pellets were weighed, resuspended in buffer A (3 ml/g of cells) containing 30mM dithiothreitol and incubated for 15min at room temperature. Cells were harvested after centrifugation at 4000g/RT/10min, resuspended in buffer A containing 1mg lyticase/g cells (Sigma), 1mM DTT and incubated at 30°C for 1h. The reactions were stopped with an equal volume of ice-cold buffer A and spheroplasts were centrifuged at 1000g/4°C/10min and washed twice at 4°C in buffer A. The supernatants were removed, spheroplasts were resuspended in 3ml cold buffer B1 (0.6M mannitol, 1mM EDTA, 0.5% BSA, 10mM Tris-HCl, pH 7.4 and 1x Complete-mini protease inhibitor cocktail (Roche) and broken mechanically by 15 strokes on ice using a manual Potter-Elvehjem homogenizer, followed by centrifugation at 1000g/4°C/10min to remove cell debris and any unlysed cells. Mitochondria were collected from the supernatants by centrifugation at 12,000g/4°C/10min and washed with buffer B2 (0.6M mannitol, 1mM EDTA, 1% BSA, 10mM Tris-HCl, pH 7.0 and protease inhibitor cocktail). The supernatants were carefully removed, the mitochondria washed in buffer B2 without BSA and the pellet was resuspended in 30mM Tris-HCl, 7M Urea, 2M Thiourea, 4%(w/v) CHAPS, pH 8.5 @ 4°C. Protein concentrations of the mitochondrial fractions were measured with the 2-D Quant Kit (Amersham Biosciences). Mitochondrial fractions from the reference strain and the ndh51 mutant were electrophoresed on 7.5% SDS-PAGE and silver-stained (Supplemental Fig. A); a rabbit anti-bovine NAHD dehydogenase-51Kda polyclonal antibody detected Ndh51 in the reference strain but not in the ndh51 mutant (enlarged in Supplemental Fig. B).
2.4. 2D-DIGE analysis of C. albicans mitochondrial proteins
Duplicate samples of proteins from the mitochondrial fraction of both strains were submitted to the W.M. Keck Foundation Biotechnology Resource Laboratory (Yale University) for Cy labeling, 2D-differential imaging gel electrophoresis, and analysis. (i) Cy labeling: Protein samples were precipitated by using a Clean-up kit (GE Healthcare-part number 80-6484-51). Precipitates were solubilized in lysis buffer (7 M urea, 2 M thiourea, 4% CHAPS {3-[(3-cholamidopropyl)-dimethylammonio]-1-propanesulfonate}, 30 mM Tris) at pH 8.6, at 4°C, and the concentration was measured by using a 2D Quant kit (GE Healthcare-part number 80-6483-56). 100μg of the mitochondrial protein fraction from BWP17wt were labeled with 400 pmol of Cy3, and 100μg of the mitochondrial protein fraction from JM02p were labeled with 400 pmol of Cy5. Labeling was performed for 30 min on ice in the dark, after which the reactions were quenched with the addition of 1 μl of 10 mM lysine. The quenched Cy3- and Cy5-labeled samples from BWP17wt and JM02p were then combined, after which an equal volume of 2x rehydration buffer (8 M urea, 4% CHAPS, 13 mM dithiothreitol and 1% pH 3-10 ampholite) was added. As a control for preferential labeling, the labeling procedure was reversed (BWP17wt labeled with Cy5 and JM02p labeled with Cy3), and duplicate gels were run. (ii) Two-dimensional gel electrophoresis and imaging: The pair-labeled samples were passively rehydrated in 24-cm 3-10 IPG strips (GE Healthcare) for 2 h at 0 V and 12 h at 30 V, followed by isoelectric focusing using a IPGphor II (GE Healthcare) for a total of 65.5 kVh (held at 500 V for 1 h, held at 1,000 V for 1 h, and held at 8,000 V for 8 h). The cysteine sulfhydryls were reduced and carbamidomethylated, while the proteins were equilibrated into the second-dimensional loading buffer by incubating the focused strips in equilibration buffer (30% glycerol, 6 M urea, 2% SDS, 20 mM Tris, pH 6.5, trace bromophenol blue) supplemented with 0.5% dithiothreitol for 10 min at room temperature, followed by 4.5% iodoacetamide in fresh equilibration buffer for an additional 10 min of room temperature incubation. IPG strips were then placed on top of 12% homogeneous polyacrylamide gels that were precast with low-fluorescence glass plates using an Ettan-DALT caster (GE Healthcare). The glass plate was presilanized (Bind-silane; GE Healthcare) to affix the polymerized gel to only one of the glass plates, thereby preventing gel swelling/shrinkage between data acquisition and protein excision. The second-dimensional SDS-polyacrylamide gel electrophoresis (PAGE) was then carried out under the following conditions: 40 mA/gel; ~130 V starting voltage for 14 h. The Cy3 and Cy5 components of each gel were individually imaged using excitation/emission wavelengths of 532/580 nm for Cy3 and 633/670 nm for Cy5 using a Typhoon 9400 (GE Healthcare). After being imaged for Cy dye components, the nonsilanized glass plate was removed, and the gels were fixed in 10% methanol, 7.5% acetic acid overnight and then washed in wash solution (2.94 g of sodium hydrogen carbonate and 31.8 g of sodium carbonate in 750 ml water brought to 1 liter with water) for 30 min and then incubated in Deep Purple solution (GE Healthcare; 1 in 250 dilution) in the dark for 1 h at room temperature. This poststain visualizes ca. 95% of the unlabeled protein and ensures accurate protein excision, as the molecular weights and hydrophobicity of Cy dyes can influence protein migration during SDS-PAGE. The Deep Purple image was acquired on the same imager using 532/560-nm wavelengths, as well as re-imaging post excision to ensure accurate protein excision. (iii) Data analysis. DeCyder software (GE Healthcare) differential in-gel analysis was used for simultaneous comparison of abundance changes for pairwise comparisons of individual Cy3 and Cy5 samples. The entire signal from each Cy dye channel was normalized prior to the co-detection of protein spot boundaries and the calculation of the volume ratio for each protein spot pair. The fold change for each protein spot was reported. Proteins of interest were robotically excised in a 96-well plate format using Ettan Spot Picker (GE Healthcare). The excised gel spots were dehydrated and robotically digested with 100ng trypsin in 10mM NH4HCO3 (GE Healthcare Etttan Digester). After incubation at 37°C for 16 hours, the digests were speedvac dried and re-dried twice from 20μl of water. The digests were re-dissolved in 0.8μl of alpha-cyano-4-hydroxy cinnamic acid matrix (3.0mg/ml in 0.05% TFA, 50% acetonitrile) containing 5 fmols of Bradykinin and 10 fmols of ACTH clip as internal standards. A total of 0.6μl was loaded onto a MALDI-MS target plate for analysis on an Applied Biosystems 4700 MALDI-Tof/Tof mass spectrometer. 1250 laser shots were acquired to obtain the MS spectra, and up to 15 peptides were automatically selected for MS/MS analysis (up to 10,000 laser shots used for each MS/MS). The data were analyzed using the Applied Biosystems GPS Explorer software with Mascot analysis against the NCBInr database, and a combined peptide mass fingerprint/MS/MS search was done. The results were loaded into the Yale Protein Expression Database which combines the DeCyder Cy5/Cy3 ratios, with the gel spot number, and the Mascot/GPS Explorer protein identification results. Proteins listed in Table 2 were chosen based on three criteria: (1) the same protein had to be identified in both analyses; (2) the fold change in abundance must be ≥ 2; and (3) the Mascot score had to reach statistical significance (www.matrixscience.com/help/scoring_help.html). In the event of multiple identifications of the same protein, the highest score was chosen, regardless of the fold change.
Table 2.
Increased expression of mitochondrial proteins in the ndh51 mutant
| Classification | Protein abbreviation | MWa/pI | Analysis1 Cy5:C3b | Analysis2 Cy3:Cy5b | Mascot scoresc |
|---|---|---|---|---|---|
| Pyruvate Dehydrogenase Complex | |||||
| complex protein X | Pdx1 | 46.0/5.3 | +15.5 | +14.5 | 438/311 |
| dihydrolipoamideacetyltransferase | Lat1 | 50.0/5.7 | +4.0 | +11.2 | 475/283 |
| dihydrolipoamide dehydrogenase | Lpd1 | 52.8/6.6 | +3.5 | +3.1 | 1170/798 |
| pyruvate dehydrogenase E1 α-subunit | Pda1 | 44.1/8.3 | +3.5 | +2.7 | 605/429 |
| pyruvate dehydrogenase E1 β-subunit | Pdb1 | 41.2/5.3 | +3.5 | +2.5 | 125/202 |
| TCA cycle | |||||
| isocitrate dehydrogenase | Idh2 | 39.8/6.9 | +3.9 | +5.8 | 478/398 |
| aconitate hydratase | Aco1 | 85.9/6.1 | +2.8 | +3.8 | 449/1060 |
| malate dehydrogenase | Mdh1 | 33.8/7.0 | +2.2 | +2.0 | 699/228 |
| succinate dehydrogenase | Sdh1 | 70.1/6.7 | +2.8 | +3.6 | 351/1030 |
| Electron transport chain | |||||
| fumarate reductase | Osm2 | 70.4/7.9 | +5.4 | +7.0 | 470/303 |
| succinate dehydrogenase | Sdh1 | 70.1/6.7 | +2.8 | +3.6 | 351/1030 |
| F1F0 ATP synthase | Atp2 | 55.7/4.9 | +2.2 | +2.0 | 1250/1300 |
| ubiquinol cyt-c reductase | Qcr7 | 14.4/5.7 | +2.9 | +3.5 | 479/269 |
| ubiquinol cyt-c reductase | Qcr2 | 39.5/5.4 | +2.9 | +2.3 | 103/412 |
| Amino acid metabolism | |||||
| isomeroreductase | Ilv5 | 44.8/6.3 | +3.3 | +3.2 | 1050/1020 |
| homoisocitrate dehydrogenase | Lys12 | 44.8/5.7 | +2.7 | +2.3 | 663/414 |
| Mitochondrial structural proteins | |||||
| aldehyde dehydrogenase | Ald5 | 53.9/5.6 | +5.6 | +7.4 | 752/718 |
| heat shock protein 60 | Hsp60 | 60.1/5.1 | +5.0 | +5.5 | 547/831 |
| import protein | Tomp1 | 69.7/5.2 | +3.2 | +6.1 | 653/1010 |
| porin | Por1 | 29.7/8.6 | +4.7 | +3.9 | 776/877 |
| heat shock protein 78 | Hsp78 | 91.6/6.6 | +2.5 | +4.6 | 386/755 |
approximate MW in kDa
volume ratios of spots chosen from 2D-DIGE; analysis 1, Cy5 = mt, analysis 2, Cy3 = mt
highest score when identical protein identified two times in analysis 1/analysis 2
2.5. PCR, plasmid constructions and transformations
All DNA manipulations were performed according to established protocols (Sambrook et al, 1989). The pdx1::ARG4 and pdx1::URA3 disruption cassettes were generated by PCR amplification of plasmids pRS-ARG4ΔSpeI and pGEM-URA3, respectively, with Vent DNA polymerase (New England Biolabs) and knockout primer set PDX1F and PDX1R (spans the 5′ and 3′ UTR/ORF of PDX1, respectively). Genomic DNA from reference strain BWP17 and the subsequent PDX1 mutant was obtained by glass bead disruption (Hoffman and Winston, 1987), and genotyped by PCR with Taq DNA polymerase (Invitrogen) and primer set PDX11F and PDX11R. The PDX1 gene (ORF 19.5021, http://www.candidagenome.org/) from BWP17 was PCR amplified with Taq DNA polymerase and primer set PDX12F and PDX12R. The PCR conditions in all cases were as follows: 94°C for 1 min, 55°C for 1 min, 72°C for 3 min for 30 cycles, followed by a final extension at 72°C for 10 min in the appropriate buffer containing 1.5mM MgCl2, 400μM dNTPs, 0.4μM primers and 0.5 units Vent or Taq DNA polymerase. All PCR fragments for analytical or preparative purposes were electrophoresed on 1% agarose/TBE gels and stained with ethidium bromide.
The PDX1 transcriptional unit containing the promoter, ORF and polyadenylation signal was PCR amplified, as described above, and TA-cloned into pCR2.1TOPO, followed by transformation into TOP10 cells under ampicillin selection, resulting in pCR2.1PDX1. Automated DNA sequencing of the entire insert was performed to detect any PCR errors. Following sequence confirmation, the PDX1 gene from pCR2.1PDX1 was excised with EcoRI, blunt-ended with the Klenow fragment of DNA polymerase I, gel purified and ligated into pGEM-HIS1 digested with MluI, blunt ended and gel purified as above. Following transformation into DH5α cells and selection on ampicillin, pGEM-HIS1-PDX12 was created. All miniprep DNA and gel fragments were purified using the Qiaquick miniprep Kit and Qiaquick Gel Fragment Kit (Qiagen), respectively. Transformations of all E. coli cells were according to the manufacturer’s recommendations.
For the generation of the C. albicans PDX1 mutant series (Table 1), the lithium acetate transformation protocol was performed (Wilson et al., 1999). For the disruptions of the first PDX1 allele, the pdx1::ARG4 disruption cassette was transformed into BWP17, followed by selection on CM agar minus arginine. The resultant heterozygote was designated PDX1-2. With respect to the second PDX1 allele, PDX1-2 was transformed with the pdx1::URA3 disruption cassette, followed by selection on CM agar minus arginine and uridine, resulting in the homozygote PDX1-29. In order to generate the reintegrant and prototroph, PDX1-29 was transformed with SwaI linearized pGEM-HIS1-PDX1 and pGEM-HIS1 respectively, selected on CM agar minus arginine, uridine, and histidine and designated PDX1-29R and PDX1-29P, respectively. Subsequently, all strains were PCR genotyped with primer set PDX11F and PDX11R and ARG4, URA3 and HIS1 specific primers where appropriate (data not shown).
2.6. Filamentation assays and microscopy
After overnight growth at 30°C in YPD or basal salts medium (as indicated), C. albicans strains were sub-cultured and grown to mid-exponential phase in the same medium, diluted 1:10 in pre-warmed (37°C) medium, and dispensed, in duplicate, as 1 ml aliquots into a 12-well tissue culture plate (Becton Dickinson, Falcon # 35-3043). For induction of filamentous growth, plates were incubated without shaking for 1 or 2h (as indicated) at 37°C. Microscopic analysis (brightfield) of cells was performed with an Olympus IX70 microscope using a 40X objective lens. Digital images were captured with an Optronics Engineering Camera (DEI-750) and Image-Pro Plus 5.0 software. For quantitative assessment of filamentous growth after 1 h at 37°C, approximately 50–100 cells were analyzed microscopically on a 10 × 10 grid in triplicate and scored by the cell shape measurement criteria previously described (Sudbery and Berman, 2004). In brief, cells were visually scored as positive for filamentation if the length of the filament was ≥ 2 times the diameter of the mother cell, the sides of the elongated structure were parallel, and the width of the filament was 50% of the approximate diameter of the mother cell. All images taken were representative of cell morphologies after visually scanning the entire well.
2.7. SDS-PAGE Electrophoresis and Western blot analysis
C. albicans mitochondrial proteins (5μg) were denatured under reducing conditions and electrophoresed on a 10% SDS-PAGE gel as previously described (Laemmli, 1970). For qualitative assessment of proteins generated from sub-cellular fractionation, gels were stained with the Silver-Express Kit (Invitrogen), according to manufacturer’s instructions. For Western blot analysis of Ndh51, proteins were transferred to a nitrocellulose membrane (Bio-Rad) which was blocked with TBS (50mM Tris-HCl, 150mM NaCl, pH 7.5) containing 0.1% Tween 20 and 10% skimmed milk powder and incubated at 4°C for 16h with a rabbit anti-bovine NADH dehydrogenase (51 kDa) polyclonal antibody (the kind gift of Sir John Walker) diluted 1:250 in TBS containing 0.1% Tween/3% skimmed milk powder (TBS-MT). The blot was washed with TBS/0.1% Tween 20 (TBST) and incubated at 25°C for 2h with HRP-conjugated donkey anti-rabbit IgG antibody (Amersham-Life Science) diluted 1:5000 in TBS-MT. Following a further wash with TBST, the membrane was developed with SuperSignal West Pico (Pierce), as recommended by the manufacturer, and exposed to Kodax BioMax MR film.
3. Results
3.1 Rotenone treatment inhibits filamentation in wild type Candida albicans
A C. albicans mutant lacking both alleles of NDH51 (JM02p) displayed a severe defect in filamentation at 37°C in a basal salts medium conducive to filamentous growth (McDonough et. al., 2002). Treatment of BWP17wt (wild type for NHD51; prototrophic match for JM02p) with 80 μg/ml rotenone inhibited filamentation in the identical medium. In the absence of rotenone, 100% of organisms underwent filamentous growth, while a 5 hour incubation with rotenone decreased this percentage to 25%. Doubling times were not affected (1.6 hours in the absence of rotenone; 1.7 hours in the presence of rotenone). This experiment confirmed that the filamentation defect observed in the ndh51 mutant was ascribable to inhibition of the respiratory pathway and not to impaired growth.
3.2 Candida albicans cells lacking NDH51 demonstrate increased expression of the pyruvate dehydrogenase complex and other mitochondrial proteins
To compare the repertoire of mitochondrial proteins induced by temperature shift in BWP17wt and the isogenic ndh51 mutant after growth in basal salts medium, 2D-DIGE analyses were performed (Fig. 2). Fifty-eight percent of protein spots subjected to MALDI mass spectophotometry were identified in the NCBI database; 90% of identified proteins showed a twofold or greater increase in abundance (Table 2). Twenty-one mitochondrial proteins exhibited increased expression in the ndh51 mutant as compared to BWP17wt. Of these, 62% are involved directly in respiratory functions, while the remaining proteins are indirectly involved by virtue of their participation in mitochondrial structural dynamics and amino acid biosynthesis. No mitochondrial proteins were decreased in expression in the ndh51 mutant.
Figure 2. Two-dimensional gel electrophoresis of mitochondrial protein fractions.
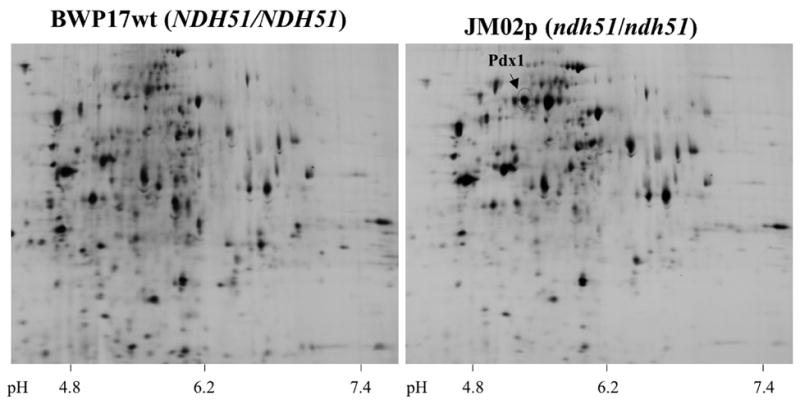
Cy5 stain of proteins from the reference strain BWP17wt (left panel); Cy3 stain of proteins from the ndh51 null mutant (right panel). Pdx1 is indicated with the red circle.
3.3. Deletion of PDX1 recapitulates the defective filamentous growth of the ndh51 mutant
Complex I, which includes NHD51, is the first step of the electron transport chain in C. albicans (Fig. 1). In order to understand whether genes extraneous to the electron transport chain also participated in filamentous growth, both alleles of PDX1 were disrupted by PCR-mediated mutagenesis in the reference strain BWP17 (Table 1). Targeted disruption of the first PDX1 allele with a cassette containing the ARG4 gene was confirmed by the acquisition of a 2.5 kb band in addition to the wild type allele at 1.6 kb (Fig. 3, lane 2). Disruption of the second allele generated a novel 1.8 kb band, with a concomitant loss of the remaining wild-type allele at 1.6 kb (Fig. 3, lane 3). Both the heterozygote and homozygote (PDX1-2 and PDX1-29, respectively) were further genotyped with ARG4 and URA3 specific primers to confirm integration of the appropriate markers (data not shown). A single copy of the PDX1 gene was reintroduced into the pdx1 mutant at the HIS1 locus; reintegration was confirmed by generation of Arg+Ura+His+ colonies and the subsequent acquisition of a 1.6 kb band identical to the wild-type allele (strain PDX1-29R1, Fig. 3, lane 4). To control for a disruption event at the HIS locus and any auxotrophic differences between strains, PDX1-29P, a pdx1 strain prototrophic for Arg, Ura and His, was constructed by transforming PDX1-29 with pGEM-HIS1 only. Genotyping with PDX1 5′ and 3′ UTR primers shows the absence of the wild type allele, while the ARG4 and URA3 markers are maintained (Fig. 3, lane 5).
Figure 3. Disruption of PDX1 in C. albicans.

PCR genotyping of genomic DNA from the C.albicans PDX1 disruptant mutants, using primers PDX11F and PDX11R. Lane 1, reference strain BWP17; lane 2, heterozygote strain PDX1-2; lane 3, homozygous null mutant PDX1-29; lane 4, reintegrant strain PDX1-29R1; lane 5, PDX1-29P, the null mutant restored to prototrophy. Approximate sizes of PCR products and lambda HindIII/EcoRI standards (in kb) are indicated to the right and left of the gel, respectively.
Strains PDX1-2 (heterozygote), PDX1-29 (null mutant), and PDX1-29R (reintegrant) were initially examined for filamentation after 2 hours’ growth in basal salts medium at 37°C. In order to ensure that filamentation defects could not be ascribed to auxotrophic differences, strain BWP17AU (Arg+/Ura+) was used as the PDX1/PDX1 (wild type) control. While BWP17AU, heterozygote, and reintegrant formed abundant germ tubes and filaments (Fig. 4A, panels A, C, and E, respectively), the pdx1 null mutant had a predominant morphology of unicellular and budding yeast cells that recapitulated the filamentation defect in the ndh51 mutant (Fig. 4A, panels B and D). Integration at the HIS locus and subsequent prototrophy did not restore the PDX1 phenotype (Fig. 4A, panel F). Analysis of an independent pdx1 mutant (PDX1-27) and reintegrant (PDX1-29R2) showed the same phenotype as seen with PDX1-29 and PDX1-29R1, respectively (Fig. 4B). Therefore, it is unlikely that the filamentation defect seen in the pdx1 mutant is the result of an extraneous mutation.
Figure 4. Disruption of both alleles of PDX1 contributes to a filamentous defect.
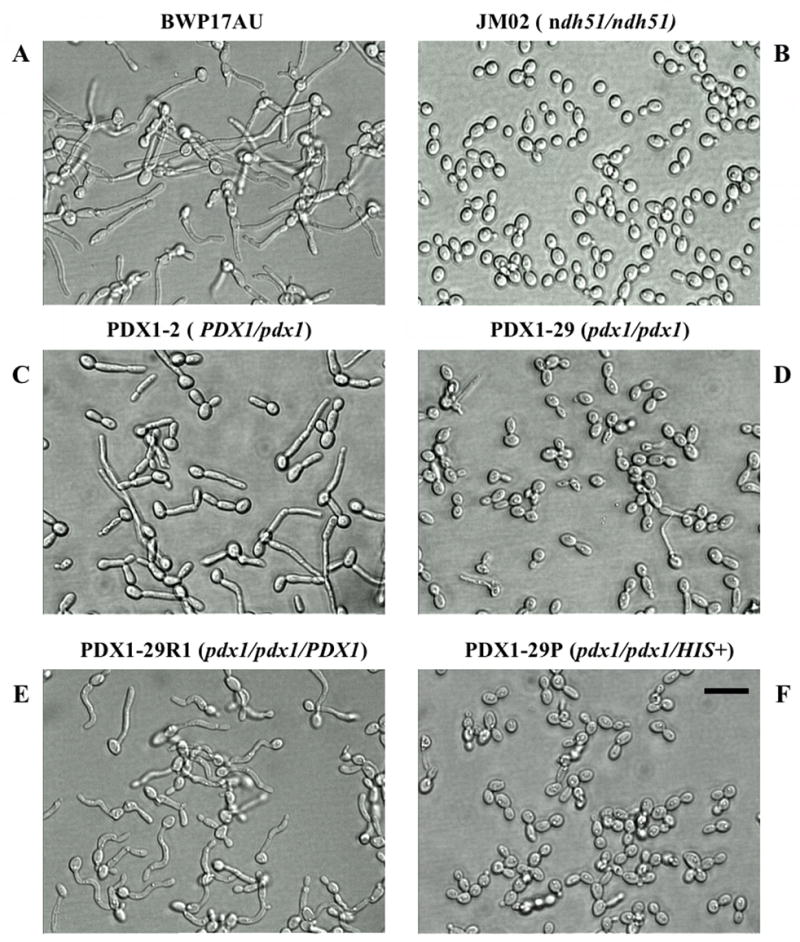

4A Cell morphologies of BWP17AU (panel A), the NDH51 null mutant, (panel B), and the PDX1 heterozygote, homozygote, reintegrant and prototroph (panels C-F, respectively) at 37°C for 2 h in basal salts medium subsequent to exponential growth at 30°C in the same medium. Digital images were captured at 400 × magnification; bar is 10μm.
4B Independent pdx1 mutant and PDX1 reintegrant in filamentation assay as in Fig. 4A.
In order to examine early differences in the filamentation program, quantitative analysis of filamentous growth in all isogenic strains was measured after 1 hour’s growth in basal salts medium at 37°C following growth to mid-exponential phase at 30°C (Table 3). Under these conditions, C. albicans exhibits a time-dependent filamentation profile, with germ tubes evident at 30 minutes and true filaments at 1.5 hours. In basal salts medium utilizing 100mM glucose as carbon source, there was no significant difference in the degree of filamentation between the wild type, heterozygote and reintegrant; however, the pdx1 mutant displayed a considerable reduction in the number of germ tubes, even at this very early timepoint (Fig. 5).
Table 3.
Filamentation assay in basal salts medium with different carbon sources
| Strain (relevant genotype) | % organisms undergoing filamentous growtha | |
|---|---|---|
| 100 mM Glucose | 100 mM Acetate | |
| BWP17 (PDX1/PDX1) | 45 ± 2.6 | 8.8 ± 0.28 |
| PDX1-2 (PDX1/pdx1) | 52 ± 1.5 | 2.2 ± 0.75 |
| PDX1-29R (pdx1/pdx1/his::PDX1) | 41 ± 8.3 | 9.4 ± 1.9 |
| PDX1-29 (pdx1/pdx1) | 17 ± 5.1 | 1.3 ± 0.57 |
hyphae scored after 1h at 37°C; results are presented as mean ± SD
Figure 5. Influence of carbon source on cell morphology in C. albicans.

Representative microscopic analysis of cell morphologies of strains incubated at 37°C in basal salts medium with either glucose or acetate as carbon source (left and right column, respectively). Cultures were incubated at 37°C for 1 h, after growth to mid-exponential phase at 30°C, in order to assess percent hyphal formation. Black arrow in each panel indicates a typical hypha. Images were captured at 400 × magnification; bar is 10 μm.
In contrast, with acetate as non-fermentable carbon source, all isogenic strains grew preferentially as yeast cells (Fig. 5). In addition, the pdx1 mutant displayed a severe growth defect in acetate and failed to replicate after 10 hours. At 30°C in 100 mM glucose, the doubling time of the pdx1 mutant (5.2 hr) did not differ from the wild type, heterozygote, and reintegrant (5.07±0.98 hr). These studies indicate that Pdx1, a protein extraneous to the electron transport chain, is required for filamentous growth of C. albicans in glucose. In addition, they suggest that the metabolic status of the cell is a major factor in its ability to undergo filamentous growth.
3.4. Defective filamentation in the pdx1 mutant is maintained over a wide range of glucose concentrations
Previous studies have indicated that glucose concentrations approaching 1mM (0.02%) in basal salts medium may actually enhance filamentation (Land et. al., 1975 (2); Vidotto et al., 1996). These observations led us to examine filamentation in BWP17AU, the ndh51 mutant and the pdx1 mutant (PDX1-29) in glucose concentrations ranging from 5–100mM. Sustained growth in glucose concentrations below 5mM (ie. 0.1 and 1mM) was not possible in basal salts medium, even for the wild type strain. After two hours’ incubation at 37°C in basal salts medium containing 5, 15 or 100mM glucose, the wild type strain maintained the hyphal phenotype at all measured glucose concentrations, while budding, multicellular yeast cells predominated in the pdx1 and ndh51 mutants (Fig. 6). The filamentation defect in the pdx1 mutant persisted at 37°C, even in rich medium (YP) with 10 or 100 mM glucose (data not shown). In all, these studies suggest that the ability to undergo filamentous growth in the presence of glucose as carbon source is strongly influenced by the metabolic status of the cell. When genes essential to respiratory functions are disrupted, glucose cannot rescue the phenotype.
Figure 6. The filamentous defect persists in two independent respiratory-gene disruptions, regardless of glucose levels.

Cell morphologies of C. albicans strains BWP17AU, JM02 and PDX1-29 (indicated at top with relevant genotypes) incubated at 37°C for 2h in basal salts medium with varying concentrations of glucose, as indicated in column at left. Organisms were shifted to 37°C after mid-exponential growth at 30°C in the same medium. Images were captured at 400 × magnification; bar is 10 μm.
4. Discussion
The unique ability of Candida albicans to grow as individual yeast cells (blastospores; pseudohyphae) or as filamentous forms (germ tubes; hyphae) represents an interplay among genes encoding protein “sensors” like the landmark proteins Int1 and Rsr1 and those responding to environmental cues such as temperature (P145k), pH (Prr2), starvation (Ras1), and osmotic or microaerophilic conditions (Hog1 or Czf1, respectively). These proteins entrain signaling pathways involving numerous kinases, phosphatases, and transcription factors acting as inducers and/or repressors of hyphal-specific genes that typically encode cell wall (HWP1, ECE1, HYR1, ALS3, ALS8, RBT1) or secreted proteins (RBT4) (Murad et al., 2001; Kadosh and Johnson, 2001; Garcia-Sanchez et. al., 2005; reviewed in Mitchell, 1998; Ernst, 2000; Liu, 2001; Dhillon et al., 2003).
The relationship between metabolic status and morphology in C. albicans is less well defined. Biochemical studies attempting to correlate electron transfer with cellular morphology in S. cerevisiae and C. albicans demonstrated that an intact respiratory pathway was associated with preferential yeast morphology and impaired filamentous growth (Fisher and Stern, 1942; Nickerson, 1954, 1963; Chattaway et al., 1968, 1973). Two studies confirmed the inverse: biochemical inhibition of respiration generated increased products of fermentation (ethanol, C02), and organisms produced more hyphae (Land et al., 1975 (1); Land et al., 1975 (2)). A recent study in C. albicans corroborated these observations; when hypoxia or respiratory inhibitors such as antimycin A were used to reduce respiration, filamentation was enhanced (Mulhern et. al, 2006).
Linkage of respiratory activity to cellular morphology has also been implicated in the morphological status of Bacillus cereus (Nickerson and Sherman, 1952). The filamentous form of this bacterium (elongated bacilli) was shown to have decreased oxygen consumption with a variety of substrates such as glucose, pyruvate, succinate, glutamate, and alanine, while dry weight and nitrogen concentration did not differ in comparison to normal bacilli. The authors hypothesized that energy-yielding reactions may be factors that limit cellular division.
The paradigm derived from these experiments posits that yeast morphology predominates in C. albicans under conditions that favor respiration. Given this relationship, one would predict a hyper-filamenting phenotype for the ndh51 mutant, in which complex I of the electron transport chain is disrupted. Thus the severity of the filamentation defect in the ndh51 mutant was initially surprising (McDonough et al., 2002). In order to address this disparity, we analyzed the mitochondrial proteome of a C. albicans reference strain (NDH51/NDH51) and its isogenic ndh51 mutant to identify proteins affected by the absence of Ndh51 and observed a dramatic increase of pyruvate dehydrogenase complex protein X (Pdx1), accompanied by all the core components of the complex (Table 2).
The pyruvate dehydrogenase complex (PDC) catalyzes the irreversible reaction of pyruvate to acetyl-CoA (Patel and Roche, 1990) and is highly conserved in both prokaryotes and eukaryotes (Snoeps et al., 1992; Stoops et al., 1997; Zhou et al., 2001; Patel and Korotchkina, 2001; James et al., 1995; Modak et. al., 2002). Each of the three catalytic components---pyruvate dehydrogenase (E1), dihydrolipoamide acetyltransferase (E2), and dihydrolipoamide dehydrogenase (E3), along with the E3E2 binding protein Pdx1 and several coenzymes, are present in multiple copies and required for a functional complex. Pdx1, while not present in other α-keto acid dehydrogenase complexes, is required for the structural and functional integrity of PDC (Lawson et al., 1991). In S. cerevisiae, E2 forms the catalytic and structural core of the PDC, which directly associates with E1; however the positioning and binding of E3 to E2, at a 12:1 molar ratio requires the presence of Pdx1 (Stoops et al., 1997).
In the ndh51 mutant, the association of enhanced respiratory activity with yeast morphology is supported by increased expression of Pdx1, as well as all catalytic components of the PDC, proteins involved in the TCA cycle, and components of the electron transport chain (Table 2). However, when we disrupted both alleles of PDX1 ---and presumably compromised the delivery of acetyl CoA to the TCA cycle---the disruptant grew preferentially as a yeast, just like the ndh51 mutant, even under conditions conducive to filamentation (e.g. 5 mM glucose as carbon source).
A model to explain how the ndh51 and pdx1 mutants maintain yeast morphology is presented in Figure 7. Inhibition of complex I of the electron transport chain by deletion of NDH51 should impair respiration (step 1). The ndh51 mutant overcomes this impediment in two ways: first, by increasing the expression of Pdx1 and proteins of the pyruvate dehydrogenase complex (PDC), the TCA cycle, and the electron transport chain (Table 2) and second, by allowing transferred electrons to enter the electron transport chain at complex II (step 2), components of which are also increased in expression (Table 2). This compensatory bypass of complex I maintains both respiration and yeast morphology in the ndh51 mutant. In step 3, compromise of the PDC in the pdx1 mutant halts delivery of acetyl CoA to the TCA cycle. The proposed increase in expression of the cytosolic proteins Pdc1 (pyruvate decarboxylase), Adh1 (acetaldehyde dehydrogenase), and Acs2 (acetyl-CoA synththase) (step 4) should hypothetically augment production and delivery of acetyl CoA (step 5), thereby rescuing respiratory activity and maintaining yeast morphology (step 6). In support of this hypothesis, a S. cerevisiae mutant lacking pyruvate dehydrogenase activity was shown to have significantly increased activity of Pdc1, Adh1 and Acs2 compared to the isogenic wild type strain (Pronk et al., 1994). The high degree of identity between S. cerevisiae Pdc1, Adh1, and Acs2 and their orthologs in C. albicans---69%, 74%, and 68%, respectively---suggests that these cytosolic proteins may constitute an alternative pathway for the synthesis of acetyl-CoA and its subsequent entry into the TCA cycle (step 5). The generation of acetyl-CoA by this alternative pathway in the pdx1 mutant potentially allows respiration to be maintained (step 6), and yeast morphology should predominate, in keeping with the paradigm and with our observations. Indeed, acetyl-coA has been detected in the cytosol of C. albicans yeast cells (Sheridan et al., 1990). Additional studies, including mitochondrial and cytoplasmic proteomic analysis of the pdx1 mutant, are needed to validate this hypothesis. Mutational analysis of proteins involved in the glycolytic pathway should further define the relationship of metabolism and dimorphism in Candida albicans.
Figure 7. Model for a compensatory bypass mechanism.

Hypothetical model illustrating how a bypass mechanism for acetyl-CoA production in C. albicans may compensate for disruption of pdx1 to maintain yeast morphology. Black boxes show position of disrupted genes. Bold arrows indicate pathways of acetyl-CoA production; vertical line indicates inhibition of acetyl-CoA production. Solid arrows show flow of H+ and ATP under normal conditions. Steps 1–6 are explained in the text.
Supplementary Material
Supplemental Figure
A. Mitochondrial protein fractions.
Silver stain of mitochondrial proteins from the reference strain BWP17wt (left panel) and the ndh51 mutant (right panel).
B. Corresponding Western blot (enlarged).
Western blot analysis of mitochondrial proteins isolated from the C. albicans reference strain BWP17wt (lane 1) and the corresponding ndh51 mutant (lane 2) with a rabbit antibody to the 51 kDa subunit of bovine complex I. Lane 3 shows the detection of Ndh51 in a whole cell lysate from a transformed human epithelial cell line (CaCo2). The arrow at the left of the panel indicates the position of the Ndh51 protein. Molecular weight standards (kDa) are positioned to the right.
Acknowledgments
The authors would like to express their gratitude to Sir John Walker of the Medical Research Council Dunn Hill Nutritional Unit, Cambridge, UK, who provided the polyclonal antibody to the 51 kDa subunit of bovine complex I. In addition, we thank Denise-Devore Carter, Charlotte Frank and Khoon-Gee Tan for technical and conceptual input. This work was supported by NIH grant AI45145 to MKH.
Footnotes
Publisher's Disclaimer: This is a PDF file of an unedited manuscript that has been accepted for publication. As a service to our customers we are providing this early version of the manuscript. The manuscript will undergo copyediting, typesetting, and review of the resulting proof before it is published in its final citable form. Please note that during the production process errors may be discovered which could affect the content, and all legal disclaimers that apply to the journal pertain.
References
- Adams A, Gottschling DE, Kaiser CA, Stearns T. Methods in Yeast Genetics. Cold Spring Harbor Laboratory Press; Cold Spring Harbor, NY: 1998. [Google Scholar]
- Alex LA, Korch C, Selitrennikoff CP, Simon MI. COS1, a two-component histidine kinase that is involved in hyphal development in the opportunistic pathogen Candida albicans. Proc Natl Acad Sci. 1998;95:7069–7073. doi: 10.1073/pnas.95.12.7069. [DOI] [PMC free article] [PubMed] [Google Scholar]
- Bensen ES, Martin SJ, Li M, Berman J, Davis DA. Transcriptional profiling in Candida albicans reveals new adaptive responses to extracellular pH and functions for Rim101p. Mol Microbiol. 2004;54:1335–1351. doi: 10.1111/j.1365-2958.2004.04350.x. [DOI] [PubMed] [Google Scholar]
- Braun BR, Johnson AD. Control of filament formation in Candida albicans by the transcriptional repressor TUP1. Science. 1997;277:105–109. doi: 10.1126/science.277.5322.105. [DOI] [PubMed] [Google Scholar]
- Cavalheiro RA, Fortes F, Borecky J, Faustinoni VC, Schreiber AZ, Vercesi AE. Respiration, oxidative phosphorylation, and uncoupling protein in Candida albicans. Braz J Med Biol Res. 2004;37:1455–1461. doi: 10.1590/s0100-879x2004001000003. [DOI] [PubMed] [Google Scholar]
- Chattaway FW, Bishop R, Holmes RR, Odds FC, Barlow AJE. Enzyme activities associated with carbohydrate synthesis and breakdown in yeast and mycelial forms of Candida albicans. J Gen Microbiol. 1973;75:97–109. doi: 10.1099/00221287-75-1-97. [DOI] [PubMed] [Google Scholar]
- Chattaway FW, Holmes MR, Barlow AJE. Cell wall composition of the mycelial and blastospore forms of Candida albicans. J Gen Microbiol. 1968;51:367–376. doi: 10.1099/00221287-51-3-367. [DOI] [PubMed] [Google Scholar]
- Chen H, Fujita M, Feng Q, Clardy J, Fink GR. Tyrosol is a quorum-sensing molecule in Candida albicans. Proc Natl Acad Sci USA. 2004;101:5048–5052. doi: 10.1073/pnas.0401416101. [DOI] [PMC free article] [PubMed] [Google Scholar]
- Cole GT, Seshan KR, Phaneuf M, Lynn KT. Chlamydospore-like cells of Candida albicans in the gastrointestinal tract of infected, immunocompromised mice. Can J Microbiol. 1991;37:637–646. doi: 10.1139/m91-108. [DOI] [PubMed] [Google Scholar]
- Degli Esposti M. Inhibitors of NADH-ubiquinone reductase: an overview. Biochim Biophys Acta. 1998;1364:222–235. doi: 10.1016/s0005-2728(98)00029-2. [DOI] [PubMed] [Google Scholar]
- Dhillon NK, Sharma S, Khuller GK. Signaling through protein kinases and transcriptional regulators in Candida albicans. Crit Rev Microbiol. 2003;29:259–275. doi: 10.1080/713610451. [DOI] [PubMed] [Google Scholar]
- Ernst JF. Transcriptional factors in Candida albicans-environmental control of morphogenesis. Microbiology. 2000;146:1763–1774. doi: 10.1099/00221287-146-8-1763. [DOI] [PubMed] [Google Scholar]
- Fisher KC, Stern JR. The separation of an “activity” metabolism from the total respiration of yeast by the effects of ethyl carbamate. J Cellular Comp Physiol. 1942;19:109–122. [Google Scholar]
- Gale CA, Bendel CM, McClellan M, Hauser M, Becker JM, Berman J, Hostetter MK. Linkage of adhesion, filamentous growth, and virulence in Candida albicans to a single gene, INT1. Science. 1998;79:1355–1358. doi: 10.1126/science.279.5355.1355. [DOI] [PubMed] [Google Scholar]
- Garcia-Sanchez S, Mavor AL, Russel CL, Argimon S, Dennison P, Enjalbert B, Brown AJP. Global roles of Ssn6 in Tup1-and Nrg1-dependent gene regulation in the fungal pathogen, Candida albicans. Mol Biol Cell. 2005;16:2913–2925. doi: 10.1091/mbc.E05-01-0071. [DOI] [PMC free article] [PubMed] [Google Scholar]
- Gow NA, Brown AJP, Odds FC. Fungal morphogenesis and host invasion. Curr Opin Microbiol. 2002;5:366–371. doi: 10.1016/s1369-5274(02)00338-7. [DOI] [PubMed] [Google Scholar]
- Hausauer D, Gerami-Nejad M, Kistler-Anderson C, Gale CA. Hyphal guidance and invasive growth in Candida albicans require the Ras-like GTPase Rsr1p and its GTPase-activating protein Bud2p. Eukaryot Cell. 2005;4:1273–1286. doi: 10.1128/EC.4.7.1273-1286.2005. [DOI] [PMC free article] [PubMed] [Google Scholar]
- Hoffman CS, Winston F. A ten-minute DNA preparation from yeast efficiently releases autonomous plasmids for transformation of Escherichia coli. Gene. 1987;57:267–272. doi: 10.1016/0378-1119(87)90131-4. [DOI] [PubMed] [Google Scholar]
- Hudson DA, Sciascia QL, Sanders RJ, Norris GE, Edwards PJ, Sullivan PA, Farley PC. Identification of the dialysable serum inducer of germ tube formation in Candida albicans. Microbiolology. 2004;150:3041–3049. doi: 10.1099/mic.0.27121-0. [DOI] [PubMed] [Google Scholar]
- James AK, Cook RM, West SM, Lindsay JG. The pyruvate dehydrogenase complex of Saccharomyces cerevisiae is regulated by phosphorylation. FEBS Letters. 1995;373:111–114. doi: 10.1016/0014-5793(95)01020-f. [DOI] [PubMed] [Google Scholar]
- Kadosh D, Johnson AD. Rfg1, a protein related to the S. cerevisiae hypoxic regulator ROX1, controls filamentous growth and virulence in Candida albicans. Mol Cell Biol. 2001;21:2496–2505. doi: 10.1128/MCB.21.7.2496-2505.2001. [DOI] [PMC free article] [PubMed] [Google Scholar]
- Laemmli UK. Cleavage of structural proteins during the assembly of the head of bacteriophage T4. Nature. 1970;227:680–685. doi: 10.1038/227680a0. [DOI] [PubMed] [Google Scholar]
- Land GA, McDonald WC, Stjernholm RL, Friedman L. (1) Factors affecting filamentation in Candida albicans: relationship of the uptake and distribution of proline to morphogenesis. Infect Immun. 1975;11:1014–1023. doi: 10.1128/iai.11.5.1014-1023.1975. [DOI] [PMC free article] [PubMed] [Google Scholar]
- Land GA, McDonald WC, Stjernholm RL, Friedman L. (2) Factors affecting filamentation in Candida albicans: changes in respiratory activity of Candida albicans during filamentation. Infect Immun. 1975;12:119–127. doi: 10.1128/iai.12.1.119-127.1975. [DOI] [PMC free article] [PubMed] [Google Scholar]
- Lawson JE, Behal RH, Reed LJ. Disruption and mutagenesis of the Saccharomyces cerevisiae PDX1 gene encoding the protein X component of the pyruvate dehydrogenase complex. Biochemistry. 1991;30:2834–2839. doi: 10.1021/bi00225a015. [DOI] [PubMed] [Google Scholar]
- Lee KL, Buckley HR, Campbell CC. An amino acid liquid synthetic medium for the development of mycelial and yeast forms of Candida albicans. J Med Vet Mycol. 1975;13:148–153. doi: 10.1080/00362177585190271. [DOI] [PubMed] [Google Scholar]
- Liu H. Transcriptional control of dimorphism in Candida albicans. Curr Opin Microbiol. 2001;4:728–735. doi: 10.1016/s1369-5274(01)00275-2. [DOI] [PubMed] [Google Scholar]
- Liu H, Kohler JU, Fink GR. Suppression of hyphal formation in Candida albicans by mutation of a STE12 homolog. Science. 1994;266:1723–1726. doi: 10.1126/science.7992058. [DOI] [PubMed] [Google Scholar]
- Madigan MT, Martinko JM, Parker J. Biology of Microorganisms. 8. Prentice Hall; Upper Saddle River, NJ: 1997. [Google Scholar]
- McDonough JA, Bhattacherjee V, Sadlon T, Hostetter MK. Involvement of Candida albicans NADH dehydrogenase complex I in filamentation. Fung Genet Biol. 2002;36:117–127. doi: 10.1016/S1087-1845(02)00007-5. [DOI] [PubMed] [Google Scholar]
- Mitchell AP. Dimorphism and Virulence in Candida albicans. Curr Opin Microbiol. 1998;1:687–692. doi: 10.1016/s1369-5274(98)80116-1. [DOI] [PubMed] [Google Scholar]
- Modak J, Decker WD, Zeng AP. Metabolic control of eucaryotic pyruvate dehydrogenase multienzyme complex. Biotechnol Prog. 2002;18:1157–1169. doi: 10.1021/bp025613p. [DOI] [PubMed] [Google Scholar]
- Mulhern SM, Logue ME, Butler G. The Candida albicans transcription factor Ace2 regulates metabolism and is required for filamentation in hypoxic conditions. Eukaryot Cell. 2006 Sep 22; doi: 10.1128/EC.00155-06. epub. [DOI] [PMC free article] [PubMed] [Google Scholar]
- Murad AM, d’Enfert C, Gaillardin C, Tournu H, Tekaia F, Talibi D, Marechal D, Marchais V, Cottin J, Brown AJ. Transcript profiling in Candida albicans reveals new cellular functions for the transcriptional repressors CaTup1, CaMig1, CaNrg1. Mol Microbiol. 2001;42:981–993. doi: 10.1046/j.1365-2958.2001.02713.x. [DOI] [PubMed] [Google Scholar]
- Murad AM, Leng P, Straffon M, Wishart J, Macaskill S, MacCallum D, Schell N, Talibi D, Marechal D, Tekaia F, d’Enfert C, Gaillardin C, Odds FC, Brown AJ. NRG1 represses yeast-hypha morphogenesis and hypha-specific gene expression in Candida albicans. 2001;20:4742–4753. doi: 10.1093/emboj/20.17.4742. [DOI] [PMC free article] [PubMed] [Google Scholar]
- Nickerson WJ. Experimental control of morphogenesis in microorganisms. Ann NY Acad Sci. 1954;60:50–57. doi: 10.1111/j.1749-6632.1954.tb39997.x. [DOI] [PubMed] [Google Scholar]
- Nickerson WJ, Sherman FG. Metabolic aspects of bacterial growth in the absence of cell division. II Respiration of normal and filamentous cells of Bacillus cereus. J Bacteriol. 1952;64:667–678. doi: 10.1128/jb.64.5.667-678.1952. [DOI] [PMC free article] [PubMed] [Google Scholar]
- Nickerson WJ. Symposium on the biochemical basis of morphogenesis in fungi. IV Molecular basis of form in yeast. Bacteriol Rev. 1963;27:305–324. doi: 10.1128/br.27.3.305-324.1963. [DOI] [PMC free article] [PubMed] [Google Scholar]
- Nosek J, Fukuhara H. NADH dehydrogenase subunit genes in the mitochondrial DNA of yeast. J Bacteriol. 1994;176:5622–5630. doi: 10.1128/jb.176.18.5622-5630.1994. [DOI] [PMC free article] [PubMed] [Google Scholar]
- Odds FC. Candida and Candidosis. 2. Bailliere Tindall; London, UK: 1988. [Google Scholar]
- Patel MS, Korotchkina LG. Regulation of mammalian pyruvate dehydrogenase complex by phosphorylation: Complexity of multiple phosphorylation sites and kinases. Exp Mol Med. 2001;33:191–197. doi: 10.1038/emm.2001.32. [DOI] [PubMed] [Google Scholar]
- Patel MS, Roche TE. Molecular biology and biochemistry of pyruvate dehydrogenase complexes. FASAB J. 1990;4:3224–3233. doi: 10.1096/fasebj.4.14.2227213. [DOI] [PubMed] [Google Scholar]
- Pronk JT, Wenzel TJ, Luttik MA, Klaasen CC, Scheffers WA, Steensma HY, van Dijken JP. Energetic aspects of glucose metabolism in a pyruvate-dehydrogenase-negative mutant of Saccharomyces cerevisiae. Microbiology. 1994;140:601–610. doi: 10.1099/00221287-140-3-601. [DOI] [PubMed] [Google Scholar]
- Ramon A, Porta A, Fonzi WA. Effects of environmental pH on morphological development of Candida albicans is mediated via the PacC-related transcription factor encoded by PRR2. J Bacteriol. 1999;181:7524–7530. doi: 10.1128/jb.181.24.7524-7530.1999. [DOI] [PMC free article] [PubMed] [Google Scholar]
- Sambrook J, Fritsch EF, Maniatis T. Molecular cloning: A Laboratory Manual. Cold Spring Harbor Laboratory Press; Cold Spring Harbor, NY: 1989. [Google Scholar]
- Schweizer A, Rupp S, Taylor BN, Rollinghoff M, Schroppel K. The TEA/ATTS transcription factor CaTec1p regulates hyphal development and virulence in Candida albicans. Mol Microbiol. 2000;38:435–445. doi: 10.1046/j.1365-2958.2000.02132.x. [DOI] [PubMed] [Google Scholar]
- Sharkey LL, McNemar MD, Saporito-Irwin SM, Sypherd PS, Fonzi WA. HWP1 functions in the morphological development of Candida albicans downstream of EFG1, TUP1, and RBF1. J Bacteriol. 1999;181:5273–5278. doi: 10.1128/jb.181.17.5273-5279.1999. [DOI] [PMC free article] [PubMed] [Google Scholar]
- Sheridan R, Ratledge C, Chalk PA. Pathways to acetyl-CoA formation in Candida albicans. FEMS Microbiol Lett. 1990;57:165–169. doi: 10.1016/0378-1097(90)90432-p. [DOI] [PubMed] [Google Scholar]
- Simonetti N, Strippoli V, Cassone A. Yeast-mycelial conversion induced by N-acetyl-D-glucosamine in Candida albicans. Nature. 1974;250:344–346. doi: 10.1038/250344a0. [DOI] [PubMed] [Google Scholar]
- Snoeps JL, Westphal AH, Benen JA, Teixeira de Mattos MJ, Neijsse OM, de KoK A. Isolation and characterisation of the pyruvate dehydrogenase complex of anaerobically grown Enterococcus faecalis NCTC 775. Eur J Biochem. 1992;203:245–250. doi: 10.1111/j.1432-1033.1992.tb19853.x. [DOI] [PubMed] [Google Scholar]
- Stoldt VR, Sonneborn A, Leuker CE, Ernst JF. Efg1p, an essential regulator of morphogenesis of the human pathogen Candida albicans, is a member of a conserved class of bHLH proteins regulating morphogenic processes in fungi. EMBO J. 1997;16:1982–1991. doi: 10.1093/emboj/16.8.1982. [DOI] [PMC free article] [PubMed] [Google Scholar]
- Stoops JK, Cheng RH, Yazdi MA, Maeng CY, Schroeter JP, Klueppelberg U, Kolodzeij SJ, Baker TS, Reed LJ. On the unique structural organization of the Saccaromyces cerevisiae pyruvate dehydrogenase complex. J Biol Chem. 1997;272:5757–5764. doi: 10.1074/jbc.272.9.5757. [DOI] [PMC free article] [PubMed] [Google Scholar]
- Sudbery P, Gow N, Berman J. The distinct morphogenic states of Candida albicans. Trends Microbiol. 2004;12:317–324. doi: 10.1016/j.tim.2004.05.008. [DOI] [PubMed] [Google Scholar]
- Torosantucci A, Angiolella L, Filesi C, Cassone A. Protein synthesis and amino acid pool during yeast-mycelial transition induced by N-acetyl-D-glucosamine in Candida albicans. J Gen Microbiol. 1984;130:3285–3293. doi: 10.1099/00221287-130-12-3285. [DOI] [PubMed] [Google Scholar]
- Unlu M, Morgan ME, Minden JS. Difference gel electrophoresis: a single gel method for detecting changes in protein extracts. Electrophoresis. 1997;18:2071–2077. doi: 10.1002/elps.1150181133. [DOI] [PubMed] [Google Scholar]
- Vidotto V, Accattatis G, Zhang Q, Campanini G, Aoki S. Glucose influence on germ tube production in Candida albicans. Mycopathologia. 1996;133:143–147. doi: 10.1007/BF02373021. [DOI] [PubMed] [Google Scholar]
- Wilson RB, Davis D, Mitchell AP. Rapid hypothesis testing with Candida albicans through gene disruption with short homology regions. J Bacteriol. 1999;181:1868–1874. doi: 10.1128/jb.181.6.1868-1874.1999. [DOI] [PMC free article] [PubMed] [Google Scholar]
- Zhou ZH, McCarthy DB, O’Connor CM, Reed LJ, Stoops JK. The remarkable structural and functional organization of the eukaryotic pyruvate dehydrogenase complexs. Proc Natl Acad Sci USA. 2001;98:14802–14807. doi: 10.1073/pnas.011597698. [DOI] [PMC free article] [PubMed] [Google Scholar]
Associated Data
This section collects any data citations, data availability statements, or supplementary materials included in this article.
Supplementary Materials
Supplemental Figure
A. Mitochondrial protein fractions.
Silver stain of mitochondrial proteins from the reference strain BWP17wt (left panel) and the ndh51 mutant (right panel).
B. Corresponding Western blot (enlarged).
Western blot analysis of mitochondrial proteins isolated from the C. albicans reference strain BWP17wt (lane 1) and the corresponding ndh51 mutant (lane 2) with a rabbit antibody to the 51 kDa subunit of bovine complex I. Lane 3 shows the detection of Ndh51 in a whole cell lysate from a transformed human epithelial cell line (CaCo2). The arrow at the left of the panel indicates the position of the Ndh51 protein. Molecular weight standards (kDa) are positioned to the right.