

Abstract
(1) Objectives
Studies using thrombopoietin -/- (TPO-/-) or TPO receptor, mpl -/- mice have established a critical role for TPO/mpl signaling in hematopoietic stem cells (HSC) development. In this study, we further dissected mpl signaling in both megakaryopoiesis and HSC function, using mice bearing a truncated mpl receptor lacking the distal 60 amino acids (Δ60). This deletion removes three major signaling tyrosines on the mpl cytoplasmic domain, but retains the membrane proximal Box1 and Box2 domains required for JAK2 activation.
(2) Methods
Competitive bone marrow transplantations (BMT) and serial BMTs were performed to study HSC function. Western blot analysis was used to study TPO- stimulated signaling pathways. BM cell cultures in the presence of TPO were used to study megakaryocyte development.
(3) Results
In agreement with prior findings, we show that Δ60 bone marrow (BM) cells cultured in TPO generated normal numbers of megakaryocytes, but with greatly reduced ploidy. As expected from the deletion of three signaling tyrosine residues, freshly isolated Δ60 megakaryocytes showed marked reduction in all known TPO-stimulated signaling pathways tested, including Stat5, Stat3, Akt, and p42/44MAPK. We found that Δ60 mice displayed normal short-term (ST-HSC) activities and marginally compromised long-term (LT-HSC) stem cell activities in primary transplantation. In addition, Δ60 mice supported HSC self-renewal for at least two serial BMTs.
(4) Conclusion
Our data reveal a pivotal role for an unknown signal emanating from the membrane proximal region of the mpl receptor or from JAK2 itself in maintaining stem cell activity and self-renewal, in addition to its role in megakaryocytopoiesis and thrombopoiesis.
Keywords: hematopoiesis, hematopoietic stem cells, cytokine receptors, megakaryocytes, signal transduction
Introduction
Thrombopoietin (TPO) signaling through its receptor, mpl, is the primary cytokine regulating megakaryocyte development and platelet production [1,2]. Both TPO-/- and mpl-/- mice are severely thrombocytopenic, exhibiting only 10-15% of normal platelet levels [3,4]. They also exhibit markedly reduced megakaryocyte and CFU-Meg progenitor numbers as well as decreased megakaryocyte ploidy [5]. In addition to reduced CFU-Meg numbers, both TPO-/- and mpl-/- mice show a greater than 50% reduction in progenitor numbers for multiple hematopoietic lineages, including erythroid and myeloid lineages [6]. Furthermore, mpl-/- mice exhibit at least a 7-fold reduction in hematopoietic stem cell (HSC) activity and severe defects in supporting stem cell self-renewal [7,8]. Solar et al showed that in mice and humans stem cell activity in the fetal liver or bone marrow (BM) largely resides in mpl+ stem cell subpopulations [8]. Consistently, TPO-/- mice revealed a compromised ability to support wild type stem cells, and TPO administration to TPO-/- recipients could substantially correct this defect [9]. These findings have established a critical role for TPO/mpl signaling in both megakaryocyte and HSC development in vivo. Recently, Abkowitz and Chen showed that wild type (WT) and mpl-/- BM cells showed similar repopulating capability when transplanted into a TPO-/- host, suggesting that TPO/mpl functions mostly in supporting primitive progenitor cell proliferation and preventing their differentiation [10]. Clarification of the potential role of TPO/mpl in HSC self-renewal and progenitor cell proliferation and differentiation, awaits further experimentation.
The mpl receptor belongs to the type I cytokine receptor family, which includes the erythropoietin receptor (EpoR), growth hormone receptor, and prolactin receptor. They share homology in the membrane proximal region, which includes the Box1 and Box2 domains [11]. Ligand binding induces activation of the Janus Kinase 2 (JAK2) that is associated with the receptor through Box1 and Box2 [12]. JAK2–deficient fetal livers fail to respond to TPO in forming megakaryocyte colonies, which reveals its essential role in mpl signaling [13].
Activated JAK2 phosphorylates tyrosine residues on the mpl intracellular region, thereby providing docking sites for several SH2 domain-containing downstream signaling proteins. Mpl activates many signaling pathways in hematopoietic cell lines and primary megakaryocytes and platelets, including Signal Transducers and Activators of Transcription 3 and 5 (Stat3 and 5), Shc/Ras/Mitogen-Activated Kinase (MAPK), and SHP2/Gab/ Phosphoinositide -3 kinase (PI-3K) /Akt pathways [2]. These signaling molecules have important roles in hematopoiesis, and dysregulation of these signaling pathways are implicated in leukaemogenesis. However, the contributions of the signals initiated from JAK2 or mpl receptor tyrosines to stem cell function has not been dissected in vivo.
Mice have been generated in which a truncated mpl cytoplasmic domain lacking the distal 60 amino acids (Δ60) replaces the wild type endogenous receptor [14]. This 60 amino acid deletion removes three major signaling tyrosines on the mpl cytoplasmic domain, but retains the intact membrane proximal Box 1 and Box 2 domains that are required for JAK2 activation. Luoh et al. showed that Δ60 mice have normal steady-state platelet counts with normal megakaryocyte numbers and ploidy [14]. Both in cell lines and freshly- isolated platelets, this mutant Δ60 mpl elicits normal activation of JAK2, but cannot activate most, if not all, known TPO-stimulated downstream signaling pathways, including Stat3, Stat5, Shc, Akt, and MAPK [14-16]. Therefore, the membrane-proximal half of the mpl cytoplasmic domain is sufficient to support normal megakaryocytopoiesis and thrombopoiesis, implying that some signaling pathways emanate either from this segment or directly from activated JAK2.
In contrast, the absence of the distal region of the mpl intracellular domain leads to a blunted response to stress or to a rapid increase in TPO levels [14]. Treatment of Δ60 mice with a single dose of recombinant TPO results in a smaller increase in platelet number than WT mice. Similarly, Δ60 mice exhibit a more pronounced nadir and slower recovery from thrombocytopenia induced by myelosuppressive stress [14]. Furthermore, a single dose of TPO given immediately after lethal myelosuppressive regimens is sufficient to prevent the death of WT mice by increasing blood cells of all lineages, including platelets, white, and red blood cells [17]. Interestingly Δ60 mice show reduced myeloprotective ability provided by TPO, although significantly improved compared to mpl-/- mice [18]. These data suggest that additional signals are activated by the distal receptor segment for an appropriate acute response to TPO stimulation, and that these signals play an important role during physiologic stress. However, whether these signals are important in stem cell function has not been studied.
To dissect the signaling pathways that mpl transduces to support stem cell activity, we studied Δ60 knockin and mpl nullizygous mice. Since HSCs are difficult to culture and are scarce in numbers for biochemical studies, we analyzed the development of BM-derived megakaryocytes in response to TPO when cultured in vitro, and we also compared TPO-induced signaling in freshly isolated megakaryocytes from Δ60 knockin and mpl nullizygous mice. In parallel we examined their stem cell repopulating capabilities and self-renewal in comparison to that of WT mice. Our results further our understanding of the signaling pathways employed by mpl in supporting stem cell activity, and shed light on the molecular mechanisms of cytokine receptor signaling in hematopoietic stem cells.
Materials and Methods
Mice
Mpl-deficient and Δ60 mice were generously provided by Dr. Frederic de Sauvage (Genentech, South San Francisco, CA). The mpl-/- mice were backcrossed onto the C57/BL6 background for 16 generations, and Δ60 mice for 10 generations. WT controls were purchased from Jackson Laboratories (Bar Harbor, ME), and bone marrow transplantation (BMT) recipient mice were from National Cancer Institute (NCI, Bethesda, MD).
Bone marrow transplantation (BMT) assay
For each BMT experiment, BM cells from 6 WT C57/BL6/J, 6 Δ60, and 6 mpl-/- mice were isolated and enumerated in the presence of 3% acetic acid to exclude enucleated red blood cells. Those donor cells (Ly5.2) were mixed with total BM cells from the competitor mice (Ly5.1 from NCI) at the following ratios for competitive repopulation: 1:1 (2 million cells each), 3:1 (3 million donor cells and 1 million competitor cells), and 9:1 (3.6 million donor cells and 0.4 million competitor cells). Subsequently, 4 million cells of each BM mixture were injected retro-orbitally into each lethally irradiated- recipient Ly5.1 mouse (a split dose of 10 Gy, 137Cs source).
BM transplanted mice with 1:1 and 9:1 ratios were analyzed at 1, 4 and 8 months; and the ones with 3:1 ratios were used for secondary BMT. Primary BM transplanted mice with 3:1 test to competitor ratio were sacrificed at four months, and 5 million total BM cells were transplanted into each lethally-irradiated secondary recipient mice. In one set of experiments, we performed tertiary and quaternary BMTs using 20 million total BM cells for each recipient mouse.
One, four, or eight months after transplantation (as indicated in the text), the percentage of chimerism in the peripheral blood was analyzed as the fraction of donor- descended Ly5.2 cells using flow cytometry. Briefly, blood samples were treated with ammonium chloride solution (StemCell Technologies, Vancouver, BC, Canada) to lyse red blood cells, and then stained with fluorescein isothiocyanate (FITC)-conjugated anti-Ly5.2 and phycoerythrin (R-PE)-conjugated anti-Ly5.1 antibodies (1:200, BD Pharmingen, San Diego, CA). Flow cytometry analysis (FACS) was carried out using a Becton Dickinson FACSCalibur (BD Biosciences, San Diego, CA).
Megakaryocyte culture and quantification
Megakaryocyte culture and quantification were performed as described [19]. Briefly, BM cells were isolated, washed, and divided into four groups. Each group of cells was cultured in the serum-free media containing different concentrations of TPO (0, 1, 10, and 50 ng/ml TPO), at 1-2 × 10⁶ cells per mL. The serum-free media (also called megakaryocyte culture media) is composed of IMDM containing 1% Nutridoma-SP (Roche Applied Science), 2 mM L-glutamine, 100 U/mL penicillin and streptomycin, and 50 μM β-mercaptoethanol. Four days later, the cells were harvested in CATCH buffer (Ca++ and Mg++ free PBS containing 3.5% BSA, 1 mM Adenosine, 2 mM Theophylline, and 0.38% Sodium Citrate) and stained with FITC-conjugated anti-CD41 antibody (1:200, BD Pharmingen). Stained megakaryocytes were subsequently labeled with 50 μg/mL propidium iodide (PI) in 0.1% sodium citrate solution overnight, and subjected to flow cytometry. CD41+ cells with DNA content equal to or greater than 8N were quantified. These experiments were repeated independently four times. The mean megakaryocyte ploidy was calculated according to an established formula [20].
Immunostaining and flow cytometry analysis
To measure mpl surface expression in megakaryocytes, total BM cells were stained with FITC-CD41 antibodies as described above. Cells were then stained with magnetic bead-conjugated anti-FITC antibodies followed by autoMACS purification according to the manufacturer’s instructions (Miltenyi Biotec Inc., Germany). Enriched BM megakaryocytes were subsequently stained with rabbit polyclonal antibody against the mpl extracellular domain (1:1000), followed by phycoerythrin (R-PE)-conjugated anti-rabbit IgG antibody (1:400, Jackson ImmunoResearch Laboratories, West Grove, PA). To measure mpl surface expression in HSCs, lineage negative (Lin-) BM cells were purified using StemSep columns following the manufacturer’s protocol (StemCell Technologies, Vancouver, BC, Canada). Lin- BM cells were then stained with Allophycocyanin (APC)-conjugated- c-Kit (1:200), FITC- Sca-1 (1:200, BD Pharmingen), and PE- mpl antibodies, and then subjected to FACS analysis.
Protein lysates and western blot analysis
CD41+ BM megakaryocytes were first enriched by EasySep columns (StemCell Technologies), then sorted using a MoFlo high-speed sorter (Cytomation, Fort Collins, CO). Purified CD41+ cells were starved in IMDM with 1% BSA for 2 hrs, and then stimulated with 0, 10 or 50 ng/ml TPO for 10 min in IMDM plus 0.1 % BSA. Equal numbers of cells (2-3 × 10⁵) were used for each time point. The protein lysates were resolved on NuPAGE Novex Bis-Tris gels (Invitrogen, Carlsbad, CA) and Western blotted with indicated antibodies: anti-Stat5 (C-17) antibody (1:500, Santa Cruz Biotechnology, Inc., Santa Cruz, CA), anti-p-Stat5 (pTyr 694), p-Stat3 (pTyr 705), Stat3, anti- pAkt (Ser 473), Akt, p-MAPK (pThr202/Tyr204), and p42/44 MAPK antibody (1:1000, Cell Signaling Technology, Beverly, MA). These experiments were independently performed 3-5 times.
Results
Normal surface expression of mpl in stem cells and megakaryocytes of Δ60 mice
The truncated Δ60 form of mpl is expressed at similar protein levels in platelets, as determined by Western blot analysis [14]. Therefore, we first compared the surface expression levels of WT mpl and Δ60 mpl in megakaryocytes and hematopoietic stem cells. Due to the low percentage of CD41+ megakaryocytes in the BM (0.5%), we first enriched these cells from the BM of WT, Δ60, and mpl-/- mice using FITC-conjugated anti- CD41 antibodies followed by anti-FITC magnetic beads. After one round of bead selection, the CD41+ population was usually enriched 10 fold (from 0.5% to 5% in WT mice). We then examined the surface expression level of mpl by FACS. As shown in the upper right box in Fig. 1a, in both WT and Δ60 mice, almost all CD41+ cells expressed mpl (CD41+ mpl+). In contrast, in mpl-/- mice almost all CD41+ cells remained mpl negative as shown in the lower right box (CD41+mpl-). Notably, mpl deficiency resulted in marked reduction in megakaryocyte numbers. Thus only 1.3% CD41+ cells were obtained after the same magnetic bead enrichment (Fig. 1a). There was some non-specific staining with the mpl antibody that was also visible in mpl-/- cells, but they appeared to be CD41- (Fig. 1a).
Figure 1. Δ60 mice expressed comparable levels of surface mpl in both megakaryocytes and stem cells similarly to WT controls.
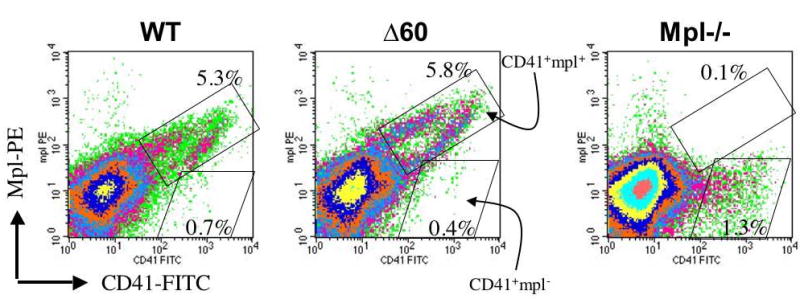
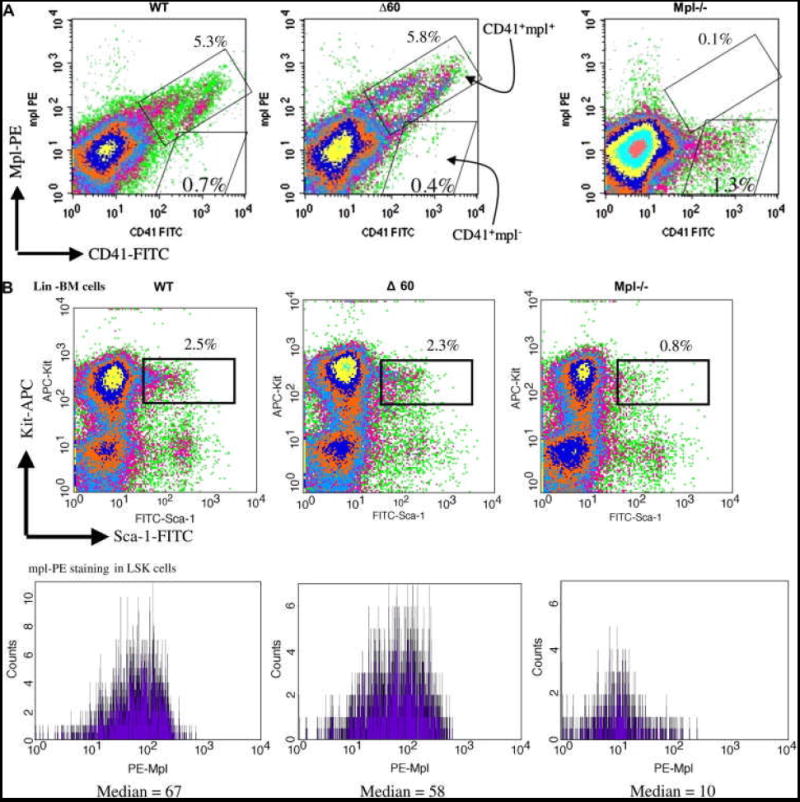
(a) CD41+ BM cells from WT, Δ60, or mpl-/- mice were first enriched using magnetic bead selection. Subsequently, the cells were stained for PE-mpl. Percentages of CD41+mpl- cells (lower right box) and CD41+mpl+ cells (upper right box) are shown in each plot. (b) Lin- BM cells from WT, Δ60, or mpl-/- mice were isolated using magnetic bead purification, and stained for Sca-1, Kit, and mpl. Percentages of Lin- cells double positive for Sca-1 and Kit are shown in the upper panels. Median fluorescence levels of PE-mpl are shown in the lower panels for Lin-Sca1+Kit+ (LSK) cells.
To examine mpl surface expression on HSCs, we first purified Lineage (Lin-) BM progenitor cells from WT, Δ60, and mpl-/- mice, and stained them for two stem cell markers, Sca-1 and Kit, as well as mpl. As shown in Figure 1b, about 2% of Lin- BM cells were double positive for Sca-1 and Kit in both WT and Δ60 mice, markers characteristic of hematopoietic stem cells, whereas in mpl-/- mice only 0.8% were Sca-1+Kit+. In mpl-deficient Lin-Sca-1+Kit+ (LSK) cells, only background levels of mpl were observed with median fluorescence value of 10 arbitrary units (Fig. 1b). Importantly, both WT and Δ60 LSK cells expressed similar levels of mpl with median values ranging from 60 to 70 arbitrary units (Fig. 1b). These data, therefore, support the conclusion that Δ60 mice expressed normal levels of surface mpl on both hematopoietic stem cells and megakaryocytes.
Reduced TPO-mediated megakaryocyte differentiation in Δ60 mice
Although Δ60 mice exhibit normal megakaryocyte development and platelet production in vivo, Luoh et al., showed that fewer megakaryocytes with lower ploidy were generated from Δ60 mice, compared to those from controls, when BM cells were cultured with a maximal concentration of TPO in vitro [14]. Since Δ60 mpl, when expressed in the 32D cell line showed decreased sensitivity to TPO (Supplemental data Fig. 1S), we assessed TPO-induced proliferation and differentiation of BM-derived megakaryocytes at limiting concentrations of TPO. As shown in Fig. 2a, TPO stimulated megakaryocyte production in a dose-dependent manner, reaching maximal levels at 10-50 ng/mL TPO. The numbers of CD41+ megakaryocytes with 8N and greater ploidy derived from WT and Δ60 BM cultures were similar at all TPO concentrations (Fig. 2a). As shown in Fig. 2b, TPO increased megakaryocyte ploidy in both WT and Δ60 BM cells, but Δ60 megakaryocytes showed a lower ploidy than WT controls at all TPO concentrations, and the difference was more pronounced at low (1 ng/mL) than high TPO concentrations (10-50 ng/mL) (Fig. 2b). As expected, the complete absence of mpl (Mpl -/-) resulted in no increase in megakaryocyte numbers or ploidy in response to TPO (Fig. 2). Thus, megakaryocytes bearing the Δ60 form of mpl displayed markedly reduced TPO-mediated differentiation at all TPO concentrations. Supraphysiological concentrations of TPO (50 ng/mL) cannot rescue the ploidy defect of Δ60 megakaryocytes, even though it can increase TPO/mpl signaling strength (Fig. 3). Interestingly, TPO-mediated megakaryocyte proliferation was normal, indicating that megakaryocyte proliferation and differentiation (ploidy formation) may be regulated by different signaling pathways activated by mpl.
Figure 2. Δ60 megakaryocytes showed reduced TPO-mediated differentiation during in vitro megakaryocyte culture.
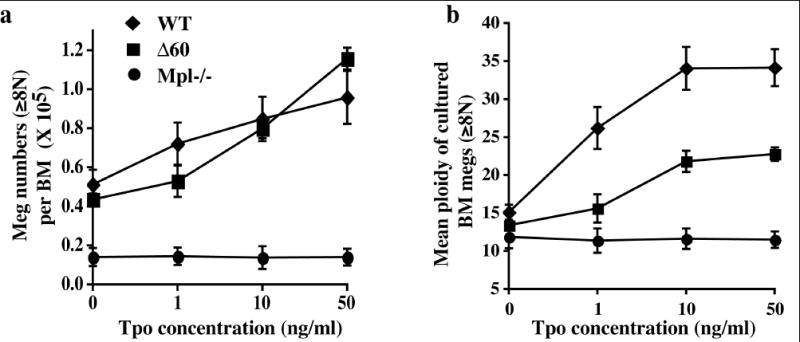
Total BM cells from WT mice or Δ60 mice were cultured in different concentrations of TPO for 4 days, (a) the numbers of CD41+ megakaryocytes with 8N and greater ploidy were enumerated (mean ± SD). (b) Mean ploidies (±SD) of BM-derived megakaryocytes were plotted.
Figure 3. Markedly reduced TPO-stimulated signaling pathways in Δ60 megakaryocytes.

Freshly- isolated CD41+ BM megakaryocytes from WT or Δ60 mice were stimulated with 0, 10 or 50 ng/ml of TPO for 10 mins. Protein lysates from equal number of cells were subjected to Western Blotting analysis. Phosphorylation and total protein levels of Stat5 (a), Stat3 (b), p42/44MAPK and Akt (c), are shown.
Marked reduction in TPO-mediated megakaryocyte signaling in Δ60 mice
While the complete absence of mpl resulted in an 80% reduction in platelet numbers, mice bearing the Δ60 mpl showed normal steady-state platelet levels [14]. Δ60 mice also exhibited normal numbers of megakaryocytes with normal ploidy, while mpl-/- mice had a marked reduction [14]. To investigate the signaling pathways disrupted by the truncation of the 60 C-terminal amino acids in the Δ60 mpl mutant, we utilized freshly purified CD41+ megakaryocytes and after 10 mins of TPO stimulation measured induction of p44/42MAPK, Akt, Stat3, and Stat5, which are among major signaling pathways induced by TPO (Fig. 3). Phosphorylation of Stat5 was nearly absent in Δ60 megakaryocytes, whereas residual levels of Stat3 phosphorylation still remained (Fig. 3a and 3b). In WT megakaryocytes, maximal activation of Akt and p42/44MAPK was achieved at 10 ng/mL TPO; in contrast, Δ60 cells exhibited no phosphorylation of these signaling molecules at 10 ng/mL of TPO, and only residual phosphorylation could be observed at a higher TPO concentration (50 ng/mL), (Fig. 3c and 3d). The total levels of these signaling proteins were similar in cells from both types of mice (Fig. 3, bottom panels). Therefore, Δ60 megakaryocytes displayed greatly reduced activation of several major signaling pathways induced by TPO, particularly at limiting concentrations of TPO.
Marginally compromised stem cell activity in Δ60 mice
To dissect the signaling pathways that mpl transduces to support stem cell activity, we examined the capability of bone marrow from Δ60 and mpl-/- animals to compete with normal marrow for hematopoietic reconstitution of lethally-irradiated mice. This competitive repopulation assay allows a direct and sensitive comparison of reconstitution potentials of normal, Δ60, and mpl-deficient stem cells. To this end total BM cells (Ly5.2) from WT, Δ60, and mpl-/- mice were mixed at ratios 1:1, 3:1, or 9:1 with isogenic C57/BL6 competitor cells (Ly5.1), and transplanted into lethally-irradiated Ly5.1 recipient mice. Four months after transplantation, long-term repopulating HSCs (LT-HSCs) were quantified by analyzing the percentage of chimerism in peripheral blood for donor Ly5.2 cells using flow cytometry. We expect 50% reconstitution with 1:1 test to competitor ratio, and 75% and 90% with 3:1 and 9:1 ratios, respectively. Close to the expected values, WT mice showed 42% reconstitution with a 1:1 test to competitor ratio, 71% with 3:1 and 82% with a 9:1 ratio (Fig. 4). Interestingly, Δ60 mice showed slightly, but significantly, decreased stem cell activities at the most sensitive low test to competitor ratio: with 32% reconstitution (vs. 42%, p=0.01) at a 1:1 and 64% (vs. 71%, p=0.01) at a 3:1 ratio. However, Δ60 mice exhibited normal repopulating capability (79% vs. 82%, p=0.5) at the high test to competitor ratio (9:1), which is the least sensitive cell ratio. As reported previously, mpl-/-mice displayed dramatically reduced repopulation capability at all ratios compared to WT mice (Fig. 4).
Figure 4. Δ60 mice showed slight but significant decrease in stem cell repopulating capability four months after transplantation.
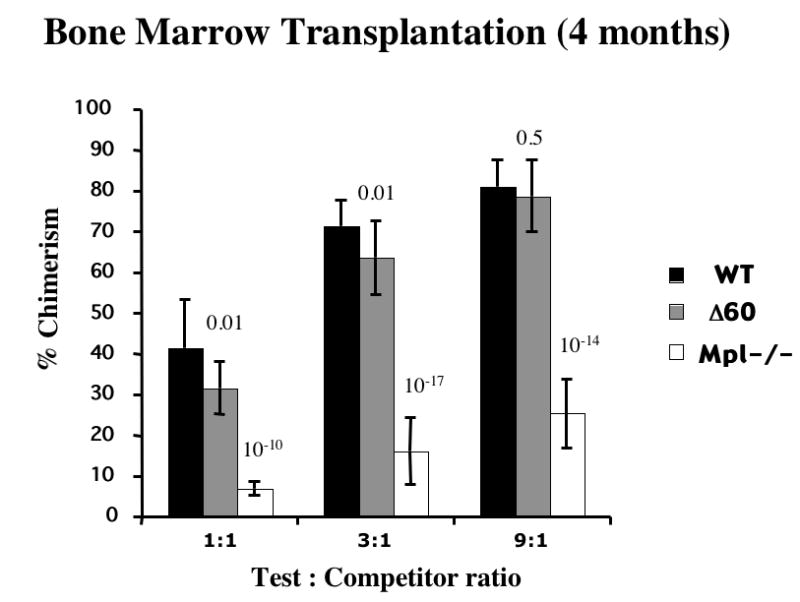
BM cells from WT, Δ60, and mpl-/- mice were mixed at 1:1, 3:1, or 9:1 ratio with competitor cells, and transplanted into irradiated recipient mice. Chimerism of transplanted mice were measured 4 months after transplantation. Five mice per genotype per group were used in each experiment and the results were pooled from three independent experiments. Students’ t-tests were carried out and the p values for the differences between Δ60 or mpl-/- mice and WT mice are shown on the top of each bar (n=15).
Chimerism of transplanted mice was also measured at various times after transplantation to examine the activities of short-term repopulating HSCs (ST-HSCs), LT-HSCs, and the maintenance of HSCs. Δ60 mice had no significant difference in ST-HSCs as judged by reconstitution 1 month after transplantation (Fig. 5a and b). At a 1:1 test to competitor ratio, Δ60 BM cells exhibited a significant reduction in LT-HSC activities at 4 and 8 months compared to WT (p<0.05) (Fig. 5a). At the least sensitive 9:1 test to competitor ratio, Δ60 mice showed no significant difference in LT-HSC activities 4 months after transplantation, and only a small but significant decrease was observed at 8 months (Fig. 5b). In sharp contrast, mpl-/- BM cells showed diminished stem cell activity with time at all test to competitor ratios (Fig. 5). Even with high test to competitor (9:1) ratio, mpl-/- BM cells failed to compete with WT controls. Therefore, Δ60 mice have normal ST-HSC activities and marginally compromised LT-HSC activities in primary BM transplantation, compared to WT mice. These differences between Δ60 and WT mice only become apparent with low test to competitor ratios and long reconstitution times. Nonetheless, we conclude that Δ60 mpl greatly rescued the HSC defects observed in mpl-/- mice.
Figure 5. Δ60 mice showed decreased stem cell maintenance eight months after transplantation.
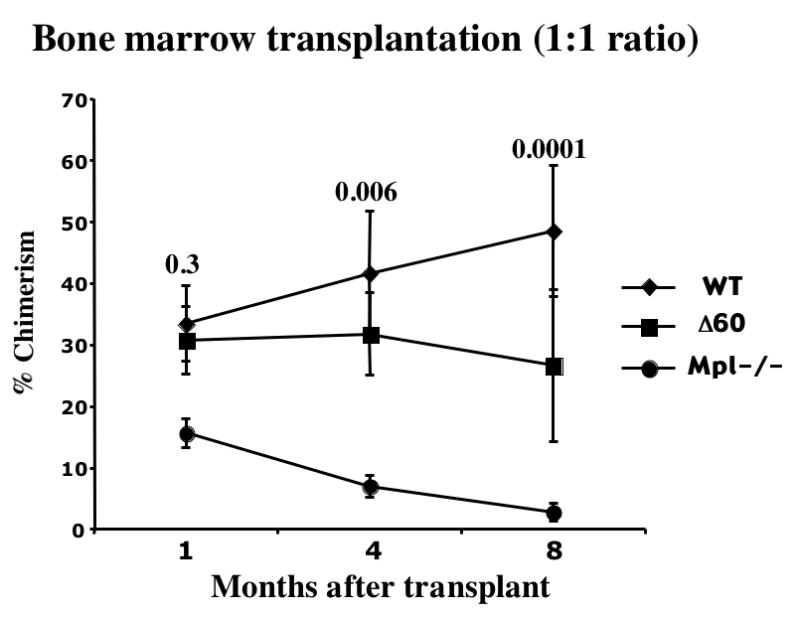

BM cells from WT, Δ60, and mpl-/- mice were mixed at 1:1 or 9:1 ratio with Ly5.1 competitor cells, and transplanted into irradiated recipient mice. Chimerism of transplanted mice were measured 1, 4, and 8 months after transplantation. (a) shows the outcome of the 1:1 test to competitor ratio, and (b) shows that of the 9:1 test to competitor ratio. Five mice per genotype were used in each experiment, and the results were pooled from three independent experiments. Students’ t-tests were carried out and the p values of Δ60 comparing to WT are shown on top of each point (n=15).
To analyze stem cell self-renewal in Δ60 mice, we performed serial BM transplantations. Primary BM transplanted mice with a 3:1 test to competitor ratio were sacrificed at four months and 5 million total BM cells harvested from them were transplanted into each lethally-irradiated secondary recipient mouse. Four months after secondary transplant, we detected no significant difference in repopulation from stem cells derived from Δ60 mice compared to WT controls, using data pooled from three independent experiments (Fig. 6a). In one set of serial transplant, we furthered the analysis by performing tertiary and quaternary BMT (Fig. 6b). Taken together, Δ60 mice supported stem cell renewal for at least two serial transplantations, and only exhibited mild decrease after 3-4 serial BMTs. In contrast, and in agreement with previous reports [7,8], mpl-/- mice exhibited almost no repopulating activity at the secondary transplantation (Fig. 6).
Figure 6. Δ60 mice show moderate defects in supporting stem cell self-renewal.

(a) Primary BM transplanted mice with 3:1 test to competitor ratio were sacrificed at four months, and 5 million total BM cells were transplanted into each secondary recipient mouse. Chimerism of the secondary transplanted mice was measured after four months. In each experiment, five mice were used in each primary and secondary transplant, and the results were pooled from three independent experiments (n=15). (b) In one experiment, the secondary transplanted mice were continued for tertiary and quaternary transplants. 20 million total BM cells were used in each tertiary and quaternary recipient mouse. Chimerism of tertiary and quaternary transplanted mice were measured at four to five months post trasnsplant (n=10). Students’ t-tests were performed and the p values of Δ60 compared to WT are shown. Since the donor cells from mpl-/- mice did not show any reconstitution at the secondary and tertiary transplants, this group was terminated after the tertiary BMT.
Discussion
Cytokine receptor signaling in HSCs has rarely been investigated. Since studies using TPO-/- and mpl-/- mice have established a critical role for TPO/mpl signaling in HSC development, we further dissected mpl signaling in HSC function, using Δ60 mice bearing a truncated mpl receptor that lacks most if not all, functional tyrosines in the cytoplasmic domain. Using competitive BMT to analyze HSC activities and serial BMT to assess HSC self-renewal, we found that Δ60 mice had normal ST-HSC activities and marginally compromised LT-HSC activities in primary BM transplantation, as compared to WT mice. The differences became most apparent with lower test to competitor ratios and longer reconstitution times. In addition, Δ60 mice supported HSC self-renewal for at least two serial BMTs, indicating that mpl function in HSC renewal was largely normal. The results obtained from Δ60 mice were in sharp contrast to those from mpl-/- mice, which showed greatly reduced ST- and LT- HSC repopulation capability after a primary transplantation and almost no repopulation after a secondary transplantation. Therefore, our data revealed a pivotal role of the membrane proximal region of the mpl receptor, containing Box1 and Box2, in maintaining stem cell activity and self-renewal, in addition to its role in megakaryocyte development and platelet production.
Studies in cell lines and platelets from Δ60 mice suggest that this truncated Δ60 mpl mutant lacks the three major signaling tyrosine residues that are believed to activate most, if not all, TPO-stimulated downstream signaling molecules, including STAT3 and STAT5, and Shc/Ras/MAPK [14-16]. We found that Δ60 mpl and F5 mpl, with all five tyrosines mutated to phenylalanines, showed similar TPO-dependent cell growth: they both require 10 times more TPO to reach maximal growth compared to WT mpl (Fig. 1S and ref [15,16]). Consistent with these results, we showed that freshly- isolated megakaryocytes from Δ60 mice exhibited severely impaired activation of Stat3, Stat5, Akt, and p42/44MAPK following TPO stimulation, particularly at limiting TPO concentrations. These studies extend studies using cell lines and in platelets from Δ60 mice [14]. Luoh, et al., showed that fewer megakaryocytes with lower ploidy were generated from Δ60 mice compared to those from controls, when cultured with maximal concentration of TPO in vitro [14]. We found that, although Δ60 BM cells gave rise to normal numbers of megakaryocytes when cultured in vitro in the presence of TPO, the megakaryocytes showed markedly decreased ploidy at all TPO concentrations and particularly at limiting concentrations of TPO. Therefore, our data suggest that, at the cellular level, the Δ60 form of mpl has an intrinsic defect in fully supporting TPO-dependent cell growth and differentiation.
Δ60 mice have normal steady-state platelet numbers and megakaryocyte numbers with normal ploidy [14]. In fact, Δ60 mice have near- normal numbers of megakaryocyte progenitors, and normal levels of progenitors of all lineages, in contrast to mpl-/- mice [14]. However, loss of signaling from the distal region of the mpl intracellular domain results in a muted response to exogenous injections of TPO [14]. Δ60 mice exhibited a more pronounced nadir and slower recovery from thrombocytopenia induced by sublethal myelosuppression, indicating that the distal half of the mpl signaling domain plays a key role during physiologic stress [14]. In addition, the distal Δ60 amino acids of the mpl intracellular domain is essential for the complete protection from lethal myelosuppression offered by TPO [18]. However, rescue of about one third of the Δ60 mice by TPO indicates that the membrane-proximal intracellular domain of mpl induces a myeloprotective signal independent of those emanating from the distal domain of mpl [18]. Therefore, signals emerging from the distal mpl segment determine only the quantitative, but not qualitative response to TPO, and compensatory mechanisms exist in the transgenic mouse model that disguise any overt phenotype during steady-state hematopoiesis.
The phenotypes observed in Δ60 mpl mice are analogous to those in EpoR-HM mice [21]. These knockin mice, bearing a distally truncated EpoR that contains no cytosolic tyrosines, can sustain functional erythropoiesis capable of overcoming the embryonic lethality observed in EpoR-null mice. Steady-state erythropoiesis is largely normal in adult EpoR-HM mice. However, they show a blunted response to continual injections of Epo [21] and exhibit compromised stress-induced erythropoiesis [22], phenotypes strikingly parallel to those in Δ60 mpl mice. Also in concordance with the phenotypes found in Δ60 mpl mice, primary progenitors from EpoR-HM mice show a compromised ability to undergo proliferation, survival, and differentiation into erythroid cells when cultured in vitro with a limiting dose of Epo [22].
One explanation for the lack of an overt phenotype in steady-state hematopoiesis in Δ60 mice is the quantitative nature of the signaling pathways employed by cytokine receptors. Perhaps the residual levels of Stat, MAPK, and Akt activation observed in Δ60 mice, albeit low, are enough to sustain steady-state hematopoiesis, which includes HSC self- renewal and differentiation, formation and function of lineage- restricted progenitors, and thrombopoiesis. The distal region of mpl is required principally to amplify or modify the TPO-stimulated response during stress.
During bone marrow transplantation the donor- derived HSCs are thought to be subjected to significant stress. These normally quiescent cells must self renewal, proliferate and different to support generation of the increased number of lineage- restricted progenitors required to generate the large numbers of myeloid and lymphoid cells required after ablation of the recipient’s bone marrow. Given this stress for HSCs, it is not surprising that we observed more pronounced differences between WT and Δ60 HSC activity after tertiary and quaternary BMTs.
The Δ60 form of mpl lacks three major signaling tyrosines in the mpl cytoplasmic domain, but retains intact the membrane proximal Box 1 and Box 2 domains that are required for JAK2 activation [14-16]. Therefore, our results also support an alternative possible mechanism: the mpl membrane proximal domain associated with JAK2 elicits novel signaling pathways for sustaining steady-state hematopoiesis. If our biochemical studies in freshly-isolated BM megakaryocytes are indicative of the signaling pathways in HSCs activated in vivo in response to TPO, this suggests that known pathways such as Stats, Akt, and MAPK are not the primary TPO- stimulated signaling pathways that support normal HSC function. Alternatively, one or more as yet unidentified signaling pathways could emanate directly from JAK2, perhaps activated by the several JAK2 tyrosine residues know to become phosphorylated after cytokine receptor activation.
Thus identifying the nature of these putative mpl- receptor phospho-tyrosine (pY) independent and JAK2-associated signaling pathway(s) will be crucial in determining whether quantitatively or qualitatively different signals emanate from the membrane proximal region of the mpl cytoplasmic domain. Several signal transduction proteins, including C-myc, Vav-2 and Pim-1 have shown to be efficiently activated by EpoR and mpl missing all cytosolic tyrosine residues [23-25]. Src kinases, such as Lyn, have also been shown to be associated with EpoR and mpl, and appear important for certain biological functions [26,27]. Nonetheless, the intracellular signals that are activated by JAK2 independent of cytokine receptor tyrosine residues still remain elusive.
In summary, our results further the understanding of the signaling pathways employed by mpl in supporting stem cell activity and megakaryopoiesis. They suggest two separate domains that regulate steady state and stress-dependent hematopoietic pathways and shed light on the molecular mechanism of cytokine receptor signaling in hematopoietic stem cells.
Supplementary Material
Acknowledgments
HFL is supported by NIH grants P01 HL32262 and RO1 DK067356. WT is supported by Howard Temin Career Development award from NCI (K01-CA115679). YMI is supported by an undergraduate NIH MARC grant # 5 T34 GM08303 and MIT Summer Research Program (MSRP)- funded by HHMI grant (52003736). We are grateful to Dr. Frederic de Sauvage for providing us mpl-/- and Δ60 mice, and Amgen for MGDF and recombinant mpl extracellular domain protein to generate anti-mpl antibodies. We thank Mr. Ferenc Reinhardt and Michael Gershenovich for animal technical support.
Footnotes
Publisher's Disclaimer: This is a PDF file of an unedited manuscript that has been accepted for publication. As a service to our customers we are providing this early version of the manuscript. The manuscript will undergo copyediting, typesetting, and review of the resulting proof before it is published in its final citable form. Please note that during the production process errors may be discovered which could affect the content, and all legal disclaimers that apply to the journal pertain.
References
- 1.Kaushansky K. Thrombopoietin: the primary regulator of platelet production. Blood. 1995;86:419–431. [PubMed] [Google Scholar]
- 2.Kaushansky K. Thrombopoietin: a tool for understanding thrombopoiesis. J Thromb Haemost. 2003;1:1587–1592. doi: 10.1046/j.1538-7836.2003.00273.x. [DOI] [PubMed] [Google Scholar]
- 3.Gurney AL, Carver-Moore K, de Sauvage FJ, Moore MW. Thrombocytopenia in c-mpl-deficient mice. Science. 1994;265:1445–1447. doi: 10.1126/science.8073287. [DOI] [PubMed] [Google Scholar]
- 4.de Sauvage FJ, Carver-Moore K, Luoh SM, et al. Physiological regulation of early and late stages of megakaryocytopoiesis by thrombopoietin. J Exp Med. 1996;183:651–656. doi: 10.1084/jem.183.2.651. [DOI] [PMC free article] [PubMed] [Google Scholar]
- 5.Alexander WS, Roberts AW, Nicola NA, Li R, Metcalf D. Deficiencies in progenitor cells of multiple hematopoietic lineages and defective megakaryocytopoiesis in mice lacking the thrombopoietic receptor c-Mpl. Blood. 1996;87:2162–2170. [PubMed] [Google Scholar]
- 6.Carver-Moore K, Broxmeyer HE, Luoh SM, et al. Low levels of erythroid and myeloid progenitors in thrombopoietin-and c- mpl-deficient mice. Blood. 1996;88:803–808. [PubMed] [Google Scholar]
- 7.Kimura S, Roberts AW, Metcalf D, Alexander WS. Hematopoietic stem cell deficiencies in mice lacking c-Mpl, the receptor for thrombopoietin. Proc Natl Acad Sci U S A. 1998;95:1195–1200. doi: 10.1073/pnas.95.3.1195. [DOI] [PMC free article] [PubMed] [Google Scholar]
- 8.Solar GP, Kerr WG, Zeigler FC, et al. Role of c-mpl in early hematopoiesis. Blood. 1998;92:4–10. [PubMed] [Google Scholar]
- 9.Fox N, Priestley G, Papayannopoulou T, Kaushansky K. Thrombopoietin expands hematopoietic stem cells after transplantation. J Clin Invest. 2002;110:389–394. doi: 10.1172/JCI15430. [DOI] [PMC free article] [PubMed] [Google Scholar]
- 10.Abkowitz JL, Chen J. Studies of c-Mpl function distinguish the replication of hematopoietic stem cells from the expansion of differentiating clones. Blood. 2007 doi: 10.1182/blood-2006-08-044503. EPUB ahead of print. [DOI] [PMC free article] [PubMed] [Google Scholar]
- 11.Watowich SS, Wu H, Socolovsky M, Klingmuller U, Constantinescu SN, Lodish HF. Cytokine receptor signal transduction and the control of hematopoietic cell development. Annu Rev Cell Dev Biol. 1996;12:91–128. doi: 10.1146/annurev.cellbio.12.1.91. [DOI] [PubMed] [Google Scholar]
- 12.Drachman JG, Kaushansky K. Structure and function of the cytokine receptor superfamily. Curr Opin Hematol. 1995;2:22–28. doi: 10.1097/00062752-199502010-00004. [DOI] [PubMed] [Google Scholar]
- 13.Parganas E, Wang D, Stravopodis D, et al. Jak2 is essential for signaling through a variety of cytokine receptors. Cell. 1998;93:385–395. doi: 10.1016/s0092-8674(00)81167-8. [DOI] [PubMed] [Google Scholar]
- 14.Luoh SM, Stefanich E, Solar G, et al. Role of the distal half of the c-Mpl intracellular domain in control of platelet production by thrombopoietin in vivo. Mol Cell Biol. 2000;20:507–515. doi: 10.1128/mcb.20.2.507-515.2000. [DOI] [PMC free article] [PubMed] [Google Scholar]
- 15.Gurney AL, Wong SC, Henzel WJ, de Sauvage FJ. Distinct regions of c-Mpl cytoplasmic domain are coupled to the JAK- STAT signal transduction pathway and Shc phosphorylation. Proc Natl Acad Sci U S A. 1995;92:5292–5296. doi: 10.1073/pnas.92.12.5292. [DOI] [PMC free article] [PubMed] [Google Scholar]
- 16.Drachman JG, Kaushansky K. Dissecting the thrombopoietin receptor: functional elements of the Mpl cytoplasmic domain. Proc Natl Acad Sci U S A. 1997;94:2350–2355. doi: 10.1073/pnas.94.6.2350. [DOI] [PMC free article] [PubMed] [Google Scholar]
- 17.Pestina TI, Cleveland JL, Yang C, Zambetti GP, Jackson CW. Mpl ligand prevents lethal myelosuppression by inhibiting p53-dependent apoptosis. Blood. 2001;98:2084–2090. doi: 10.1182/blood.v98.7.2084. [DOI] [PubMed] [Google Scholar]
- 18.Pestina TI, Jackson CW. Differential role of Stat5 isoforms in effecting hematopoietic recovery induced by Mpl-ligand in lethally myelosuppressed mice. Exp Hematol. 2003;31:1198–1205. doi: 10.1016/j.exphem.2003.09.002. [DOI] [PubMed] [Google Scholar]
- 19.Tong W, Lodish HF. Lnk Inhibits Tpo-mpl Signaling and Tpo-mediated Megakaryocytopoiesis. J Exp Med. 2004;200:569–580. doi: 10.1084/jem.20040762. [DOI] [PMC free article] [PubMed] [Google Scholar]
- 20.Arriaga M, South K, Cohen JL, Mazur EM. Interrelationship between mitosis and endomitosis in cultures of human megakaryocyte progenitor cells. Blood. 1987;69:486–492. [PubMed] [Google Scholar]
- 21.Zang H, Sato K, Nakajima H, McKay C, Ney PA, Ihle JN. The distal region and receptor tyrosines of the Epo receptor are non-essential for in vivo erythropoiesis. Embo J. 2001;20:3156–3166. doi: 10.1093/emboj/20.12.3156. [DOI] [PMC free article] [PubMed] [Google Scholar]
- 22.Li K, Menon MP, Karur VG, Hegde S, Wojchowski DM. Attenuated signaling by a phosphotyrosine-null Epo receptor form in primary erythroid progenitor cells. Blood. 2003;102:3147–3153. doi: 10.1182/blood-2003-01-0078. [DOI] [PubMed] [Google Scholar]
- 23.Drachman JG, Miyakawa Y, Luthi JN, et al. Studies with chimeric Mpl/JAK2 receptors indicate that both JAK2 and the membrane-proximal domain of Mpl are required for cellular proliferation. J Biol Chem. 2002;277:23544–23553. doi: 10.1074/jbc.M201120200. [DOI] [PubMed] [Google Scholar]
- 24.Joneja B, Wojchowski DM. Mitogenic signaling and inhibition of apoptosis via the erythropoietin receptor Box-1 domain. J Biol Chem. 1997;272:11176–11184. doi: 10.1074/jbc.272.17.11176. [DOI] [PubMed] [Google Scholar]
- 25.Miura O, Miura Y, Nakamura N, et al. Induction of tyrosine phosphorylation of Vav and expression of Pim-1 correlates with Jak2-mediated growth signaling from the erythropoietin receptor. Blood. 1994;84:4135–4141. [PubMed] [Google Scholar]
- 26.Harder KW, Quilici C, Naik E, et al. Perturbed myelo/erythropoiesis in Lyn-deficient mice is similar to that in mice lacking the inhibitory phosphatases SHP-1 and SHIP-1. Blood. 2004;104:3901–3910. doi: 10.1182/blood-2003-12-4396. [DOI] [PubMed] [Google Scholar]
- 27.Lannutti BJ, Drachman JG. Lyn tyrosine kinase regulates thrombopoietin-induced proliferation of hematopoietic cell lines and primary megakaryocytic progenitors. Blood. 2004;103:3736–3743. doi: 10.1182/blood-2003-10-3566. [DOI] [PubMed] [Google Scholar]
- 28.Tong W, Zhang J, Lodish HF. Lnk inhibits erythropoiesis and Epo-dependent JAK2 activation and downstream signaling pathways. Blood. 2005;105:4604–4612. doi: 10.1182/blood-2004-10-4093. [DOI] [PMC free article] [PubMed] [Google Scholar]
Associated Data
This section collects any data citations, data availability statements, or supplementary materials included in this article.