

Abstract
Several animal models of atrial fibrillation (AF) have been developed that demonstrate either atrial structural remodeling or atrial electrical remodeling, but the characteristics and spatiotemporal organization of the AF between the models have not been compared. Thirty-nine dogs were divided into five groups: rapid atrial pacing (RAP), chronic mitral regurgitation (MR), congestive heart failure (CHF), methylcholine (Meth), and control. Right and left atria (RA and LA, respectively) were simultaneously mapped during episodes of AF in each animal using high-density (240 electrodes) epicardial arrays. Multiple 30-s AF epochs were recorded in each dog. Fast Fourier transform was calculated every 1 s over a sliding 2-s window, and dominant frequency (DF) was determined. Stable, discrete, high-frequency areas were seen in none of the RAP or control dogs, four of nine MR dogs, four of six CHF dogs, and seven of nine Meth dogs in either the RA or LA or both. Average DFs in the Meth model were significantly greater than in all other models in both LA and RA except LA DFs in the RAP model. The RAP model was the only one with a consistent LA-to-RA DF gradient (9.5 ± 0.2 vs. 8.3 ± 0.3 Hz, P < 0.00005). The Meth model had a higher spatial and temporal variance of DFs and lower measured organization levels compared with the other AF models, and it was the only model to show a linear relationship between the highest DF and dispersion (R2 = 0.86). These data indicate that structural remodeling of atria (models known to have predominantly altered conduction) leads to an AF characterized by a stable high-frequency area, whereas electrical remodeling of atria (models known to have predominantly shortened refractoriness without significant conduction abnormalities) leads to an AF characterized by multiple high-frequency areas and multiple wavelets.
Keywords: Fourier analysis, mapping, arrhythmia, electrophysiology
Atrial fibrillation (AF) is a common arrhythmia that is associated with varied underlying structural heart diseases or can be idiopathic. Because of the variety of clinical settings in which AF occurs, several animal models have been developed to study the pathophysiology of AF in each setting (10, 17, 20, 25, 27, 36, 40, 43, 44). Although AF occurs in each of the animal models, the atrial substrate of the AF appears to be different among the animal models. For example, the rapid atrial pacing (RAP) and methylcholine (Meth) models have been shown to be dominated by atrial electrical remodeling, which includes a shortening of the atrial refractoriness without atrial structural changes or changes in conduction (25, 36, 42). In contrast, the mitral regurgitation (MR) and congestive heart failure (CHF) models do not appear to have significant decreases in refractoriness but are dominated by changes that result in alterations of conduction produced by atrial fibrosis in the CHF model and myocyte architecture disruption and inflammation in the MR model (20, 42, 43). These differences in substrate (either structural or electrical) and conduction may in turn lead to differences in the characteristic and spatiotemporal organization of the AF in each model. Recently, several different signal analyses have been used to study the spatiotemporal organization of AF to gain insights into its mechanism, including frequency domain analysis (9, 21, 31, 40) and cross-correlation (6). Through frequency domain analysis, stable high-frequency areas have been shown as a characteristic of AF (40). In addition, emerging evidence has shown that fractionated electrograms may play a role in AF maintenance and could be target sites for ablation (26, 30). We sought to determine whether these AF characteristics were true for all AF or were model specific. We used these signal analyses to characterize AF signals in different canine models to test the hypothesis that the different AF substrates (either structural or electrical) have distinct AF characteristics that can be associated with each model and that these different AF characteristics produce varying levels of spatiotemporal organization between the right and left atria.
METHODS
Thirty-nine mongrel dogs weighing 25–30 kg were randomly divided into five different groups: control (n = 9), MR (n = 9), RAP (n = 6), CHF (n = 6), and Meth (n = 9). Two dogs in the CHF group died before study, and four additional dogs (1 in the CHF group and 3 in the RAP group) had pacemaker/lead problems that required us to remove them from the study.
All animal protocols were reviewed and approved by the University of California San Francisco Laboratory Animal Resource Center’s Institutional Animal Care and Use Committee, conformed to the regulations for humane care and treatment of animals established by the National Institute of Health, and were conducted with the assistance/supervision of the Animal Resource Department veterinary staff.
Animal Models
Mitral regurgitation
MR was induced in nine dogs through catheter avulsion of the mitral chordae as previously described (43). After severe MR was achieved and acute left atrial dilatation was observed on transthoracic echocardiography, the animals were recovered, and they underwent mapping studies after 4 wk of MR, which has previously been shown to be the time frame over which increased AF vulnerability occurs but before the development of depressed left ventricular ejection fraction (43).
Rapid atrial pacing
RAP was performed in six dogs for at least 6 wk, as previously described (12). Atrioventricular (AV) conduction was eliminated by ablation of the AV junction, and endocardial pacing leads were placed into the right atrial appendage (RAA) and the right ventricle (RV). The pacemakers were programmed at four times capture threshold, with an atrial rate of 600 beats/min (bpm) and a ventricular rate of 100 bpm. Six weeks of follow-up were chosen to allow for enough time for self-sustained AF, but before the development of significant atrial fibrosis (1, 3).
Heart failure
Heart Failure (CHF) was induced in six dogs via 4 wk of rapid ventricular pacing via a lead placed in the RV and pulse generator set to pace at 240 bpm (20). Ventricular function was monitored weekly with transthoracic echocardiography, and AF mapping was performed after 4 wk of rapid ventricular pacing. Four weeks were chosen based on previous data demonstrating significant atrial fibrosis and AF vulnerability in that time (20, 38).
Methylcholine
Meth infusion was used as a model of parasympathetic AF. In nine normal animals, Meth at 1 g/250 ml saline iv (4) was infused until a 20-mmHg decrease in blood pressure and a 20% decrease in heart rate or spontaneous AF were observed. Once the blood pressure stabilized, the mapping study was performed.
Plaque Mapping Studies
At follow-up, isoflurane (1–2%) was used for anesthesia for all dogs. Surface ECG leads I, II, III, aVL, aVR, and aVF were continuously monitored. Mapping of the atria during AF was performed as previously described, using custom-built epicardial plaques with 240 unipoles (39, 43). To analyze regional differences, the electrodes were divided into 10 regions: medial and lateral left atrial (LA) and right atrial (RA) appendages (MLAA, LLAA, MRAA, and LRAA, respectively), LA Bachman’s bundle (LBB), LA high lateral wall (LHLW), LA low lateral wall (LLLW), RA Bachman’s bundle (RBB), RA posterior wall (RAPW), and RA inferior wall (RAIW). At the time of follow-up, AF was only present in the RAP group, induced by chronic rapid atrial burst pacing (via the implanted pacemaker). In the other models, AF was initiated at the time of follow-up with rapid atrial burst pacing from the LA with a cycle length of 50 ms, a pulse width of 9.9 ms, and an output of 9.9 mA. AF was defined as a rapid atrial rhythm that produced an irregular ventricular response and no identifiable P wave on the surface ECG. For the CHF group, in which the ventricles were paced during the follow-up mapping study at 50 bpm, AF was present if no identifiable P wave was on the surface ECG during episodes of rapid atrial rhythms. Several 30-s epochs of AF were recorded per animal. In the control group, for which it was more difficult to get sustained AF, recordings lasting longer than 1 min were analyzed. AF was reinduced in the control and MR groups as needed. AF activation was analyzed using customized Matlab (Mathworks, Natick, MA) programs. To quantify the reproducibility of the activation within each plaque during AF, isochrone maps of activation were constructed from the maximum dV/dt, where V is voltage, and the direction of propagation was determined and validated with the activation movies. The linking of AF wavefronts was used to quantify the stability of activation (14). The amount of linking was determined for each individual plaque and was defined as the number of consecutive fibrillation waves propagating in the same direction (37). As performed previously by Shan et al. (37), the amount of linking was divided into three groups of three or four consecutive linked beats, five or six linked beats, and seven or more consecutive beats with a similar pattern of activation.
Signal Processing and Frequency Domain Analysis
Unipolar electrograms were obtained from the epicardial plaques (Fig. 1), digitized at 1,000 Hz (Cardiomapp; Prucka GE, Marquette, FL), and filtered as described previously (9, 11). Briefly, the signal was filtered with a 40- to 250-Hz second-order Butterworth bandpass filter and rectified, and the resulting signal was filtered with a 20-Hz second-order Butterworth lowpass filter. A fast Fourier transform (FFT) was calculated on the digitally filtered waveform over a sliding 2-s window of 2,048 points every 1 s for a frequency resolution of 0.48 Hz. The dominant frequency (DF) was determined as the highest amplitude peak of the resulting magnitude spectrum. From the highest peak of the resulting magnitude spectrum, the positions of the harmonic peaks were determined based on the position of the maximum peak. The areas under the maximum peak and three of its harmonic peaks were calculated over a 1-Hz window. This produced an area under four total peaks. Then the total area of the spectrum was calculated from 2 Hz up to but not including the fifth harmonic peak. The ratio of the area under the harmonic peaks to the total area was calculated as the organization index (OI). The OI was used to represent the organization of AF at that period in time for that signal (11). To calculate the variance of both the OI and the DFs, spatial coefficient of variance (SCoV; SD/mean) of the DFs and OI during each episode of AF among all recording sites and temporal coefficient of variance (TCoV) of average DFs between 2-s windows were calculated. These measures were used to measure the stability of the DFs spatially and temporally. To measure the degree of fibrillatory conduction in each model, the highest measured DF was plotted against their dispersion (standard deviation). To analyze the size of high-DF areas, the DFs were binned into increasing cumulative deciles (top 10%, top 20%, etc.) and then correlated to the amount of mapped area occupied by those frequencies. Electrograms displaying mostly ventricular activity or 60-Hz noise were excluded from the analysis (<15%).
Fig. 1.
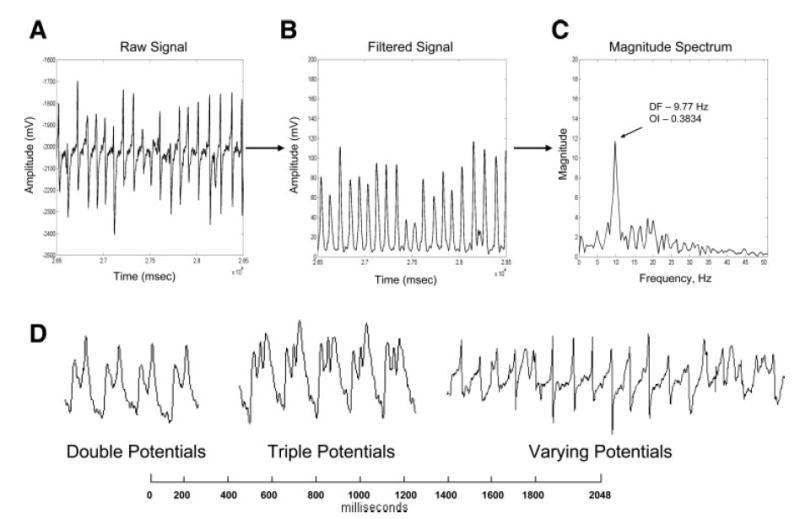
For each 30-s episode of atrial fibrillation (AF) that was recorded, a fast Fourier transform (FFT) was performed every 1 s over a sliding 2-s window on the electrograms recorded from each electrode. In this example, a 2-s window of AF is shown from a rapid atrial pacing (RAP) model (A) along with the signal after digital filtering (B). Also shown is the corresponding FFT of the digitally filtered waveform (C). D: fractionated atrial unipolar electrograms. Examples of fractionated signals that occur during AF are shown, with signals that showed double potentials, triple potentials, or varying potentials defined as fractionated. OI, organization index; DF, dominant frequency.
Cross-Correlation Analysis
Correlation analysis was performed on all recorded signals between all possible paired unipolar electrogram combinations in each animal (6, 12). All of the correlation coefficients calculated from an AF recording with the plaques were then averaged to produce a mean correlation value for each area.
Fractionated Electrograms
All signals were visually inspected for fractionation, and the percent area of the atria, which consisted of fractionated AF electrograms, was measured. The signals were considered to be fractionated if they displayed double potentials, triple potentials, or varying potentials as shown in Fig. 1D. The fractionated AF electrograms were then correlated to the top 20% of frequencies to determine whether the high-DF areas were composed of fractionated electrograms.
Histology
Transmural sections from the RA and LA appendage and free wall of five dogs in each of the groups of control, MR, CHF, and RAP were fixed in 10% neutral buffered Formalin. Tissue was processed, embedded in paraffin, and sectioned in 4- to 5-μm-thick sections. Serial sections then were stained with Sirius red, and the amount of fibrosis in each canine model was quantified as previously described (41). Briefly, the red pixel content of the digitized images was measured relative to the total tissue area (red and green pixels) using Adobe Photoshop 7 software.
Statistical Analysis
Data were expressed as means ± SD or medians (25–75 percentile). Comparisons among all mapping analysis variables (DF, DF SCoV, DF TCoV, OI, OI SCoV, OI TCoV, and cross-correlation) were performed with a repeated-measures ANOVA between AF models and between mapping sites within the same model. Individual comparisons were performed with a Fishers exact test. Comparisons between highest DF and dispersion were performed with linear regression analysis and correlation between variables. For the analysis of the cumulative distribution of the DFs vs. the mapped area of the atrium, DFs were binned into 10% steps. An ANOVA was performed on the 40% decile with a post hoc Fishers exact test to compare the RA data points vs. the LA data points for each AF model. Statistical significance was defined as P < 0.05, and 95% confidence intervals (CI) are reported in parentheses for proportions.
RESULTS
A total of 223 30-s AF recordings were analyzed in 39 dogs: 33 AF recordings in nine control, 43 in nine MR, 45 in six CHF, 53 in six RAP, and 49 in nine Meth dogs. All RAP dogs were in self-sustained AF at the time of the mapping procedure (induced by several weeks of RAP via the implanted pacemaker). In all other dogs, AF was initiated at the time of follow-up with burst atrial pacing. For the CHF model, once AF was induced, it persisted throughout the entire procedure.
Activation of the Atria During AF
Activation movies (isopotential movies) of all AF episodes were analyzed to qualitatively identify general activation patterns (quantification follows). For examples of isopotential movies for each animal model, see Supplemental Materials (Supplemental Fig. S1, A–E; the online version of this article contains data supplements). Although the different animal groups had differing patterns of activation, the activation patterns were consistent (i.e., wavefronts traveled similar paths from beat to beat) among various AF epochs within the same animal, for all AF models. The CHF group was the only group in which the activation patterns remained stable and consistent in both the RA and LA throughout the entire AF epoch (and among epochs in the same animal). In all of the other models, only a proportion of animals demonstrated a consistent general pattern of activation throughout the epoch of AF. In the control group, this occurred in 44% (CI: 14–79%) of the dogs; in the MR group, 56% (CI: 21–86%); in the RAP group, 50% (CI: 12–88%); and in the Meth group, 22% (CI: 2– 60%). In the remainder of the animals in these groups, the wavefronts changed direction for one or more activation sequences before returning to the activation pattern that was present at the start of the epoch. In the Meth and RAP groups, the AF showed simultaneous wavefront direction changes in both the RA and LA, but in the MR and control, the wavefront direction changes occurred in either the RA or LA but not both. In the control group, of the dogs that had AF with wavefront direction changes, 40% occurred in the LA and 60% in the RA. In the MR group, of the dogs that had AF with wavefront direction changes, 60% occurred in the LA and 40% occurred in the RA.
To quantify the activation patterns, isochronal maps were made from successive AF beats for each animal in each group. Examples of the isochronal maps are shown in Fig. 2. From these maps, the differences in AF activation between the models can be seen. For the RAP and Meth groups, multiple wavefronts can be seen in the isochronal examples. The CHF and MR groups show an area of initiating activation with the rest of the atria showing smooth activation.
Fig. 2.
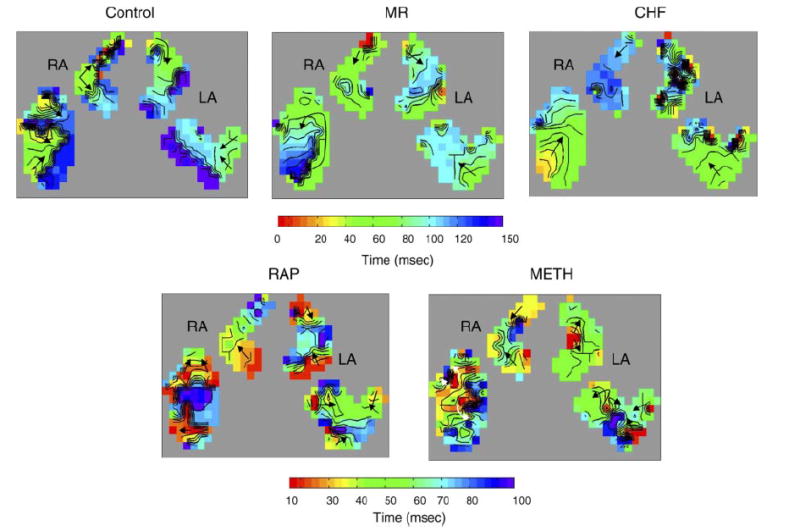
Isochronal maps of AF activation in each model studied. Each isochronal line indicates 10 ms. For the control, mitral regurgitation (MR), and congestive heart failure (CHF) maps, a 150-ms window was used. For the RAP and methylcholine (Meth) groups, which have higher AF activation frequencies, a 100-ms window was used. Corresponding color bars are shown with red indicating the earliest activation and blue/purple indicating late activation. Arrows indicate the direction of wavefront propagation. These maps show that the MR and CHF groups have a single site of earliest activation with single wavefronts in the other parts of the mapped atria and discrete lines of block. The RAP and Meth maps show multiple sites of early activation and multiple wavefronts in all parts of the mapped atria. RA, right atria; LA, left atria.
From the isochronal maps, linking was used to represent the number of continuous beats traveling in the same direction. Figure 3 shows the percentage of linked beats in the RA and LA for each model. As the graph shows, the MR and CHF models had the highest percentage of linked AF beats, while the RAP and Meth models had the lowest. This correlated with the activation sequences that were observed in the activation movies.
Fig. 3.
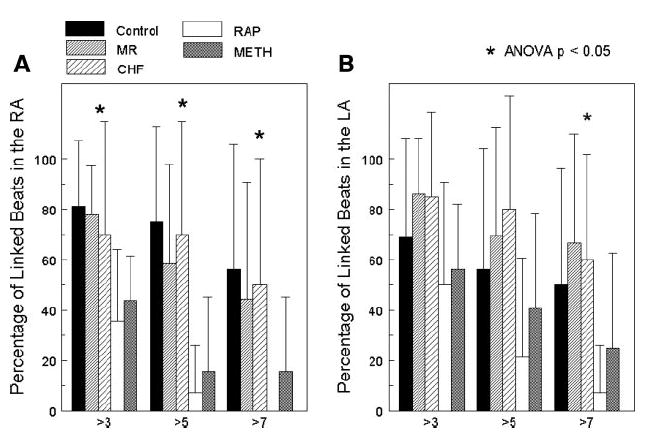
Percentage of linked consecutive beats in the RA (A) and the LA (B). From the isochronal maps that were constructed, the number of linked beats was measured and divided into groups of greater than 3 linked beats, greater than 5 linked beats, and greater than 7 linked beats. While each group showed some degree of linking of AF beats, the electrically remodeled atrial of the RAP and Meth groups showed the smallest percentage of linking. The structurally remodeled atria of the MR and CHF groups showed the greatest degree of linking. Along with the control group, these models had the highest percentage of greater than 7 linked AF beats.
Dominant Frequencies
To quantify the differences observed in the activation patterns, frequency domain analysis was performed. Each animal model of AF showed different patterns of spatiotemporal distribution of DFs. For each 30-s epoch of AF, the DF maps from each sliding 2-s window were compiled together into a DF movie, examples of which are shown in the Supplemental Materials (Supplemental Fig. S2, A–E). From the frequency domain analysis, stable (defined as persistence over at least 90% of the epoch), discrete, high-frequency areas were seen in 44% of the MR dogs (3 LA, 1 RA), 67% of the CHF dogs (3 LA, 1 RA), and 78% of the Meth dogs (2 LA, 1 RA, 4 simultaneous LA and RA). No discrete, stable, high-DF areas were seen in any of the RAP or control animals. However, for the RAP animals, in every AF epoch in every animal, the LA had consistently higher DFs than the RA (see below). This was not seen in the other models. Representative static DF maps for a 2-s period of AF for each model are shown in Fig. 4A and summary data in Table 1. As Table 1 shows, the average DFs in the Meth model are significantly greater than in all of the other models in both the LA and RA except the LA DFs in the RAP model, which were very similar to those in the Meth model. Table 1 also shows the LA-to-RA frequency gradient that was seen in the RAP model but not in the other models. This LA-RA frequency gradient in the RAP group is clearly seen between all areas of the LA and all areas of the RA (Supplemental Fig. S3). In the Meth model, no frequency gradient between the RA and LA was seen, but the LA appendage sites had significantly lower mean DF levels than any of the other atrial sites (8.3 ± 0.4 vs. 10.7 ± 0.8 Hz, P < 0.05).
Fig. 4.
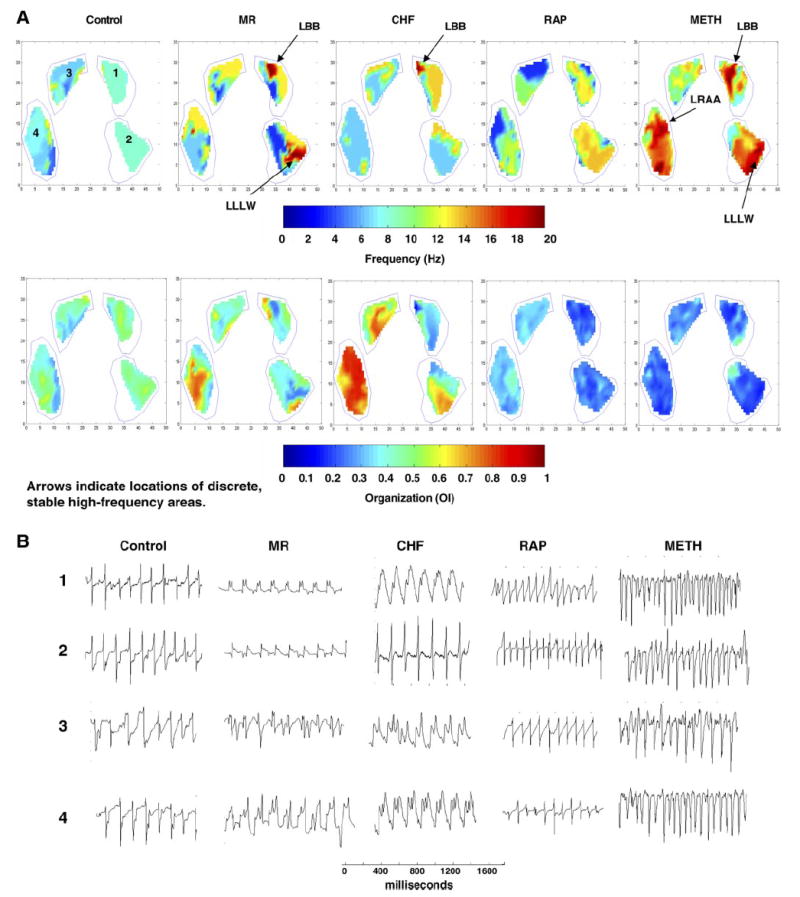
A: examples of static dominant frequency maps (top) and organization maps (bottom) for each of the animal models used in the study. DFs and OIs are shown from an FFT performed on a 2-s window of AF. The stable, discrete, high-DF areas are identified in the MR and CHF dogs, along with their atrial location. For the Meth dogs, the representative DF map shows the stable, discrete, high-DF areas in both the RA and LA. B: representative signals from the areas labeled 1, 2, 3, and 4 for each AF model. The electrodes were divided into 10 regions: medial and lateral LA and RA appendages (MLAA, LLAA, MRAA, and LRAA, respectively), LA Bachman’s bundle (LBB), LA high lateral wall (LHLW), LA low lateral wall (LLLW), RA Bachman’s bundle (RBB), RA posterior wall (RAPW), and RA inferior wall (RAIW).
Table 1.
Dominant frequency calculations
| Mean DF, Hz | Max DF, Hz | DF Spatial CoV | DF Temporal CoV | |
|---|---|---|---|---|
| Control | ||||
| LA | 7.71±0.40‡† | 12.9±2.1† | 0.12±0.03† | 0.25±0.03† |
| RA | 8.12±0.27† | 14.4±1.7† | 0.09±0.02† | 0.17±0.04 |
| MR | ||||
| LA | 7.17±0.48‡† | 11.7±2.5‡† | 0.11±0.04† | 0.25±0.04‡† |
| RA | 7.48±0.10‡† | 13.4±1.9† | 0.10±0.02† | 0.20±0.02 |
| CHF | ||||
| LA | 7.65±0.30‡† | 14.4±2.9 | 0.11±0.04† | 0.20±0.04† |
| RA | 7.45±0.51‡† | 15.0±3.5† | 0.12±0.02 | 0.18±0.03 |
| RAP | ||||
| LA | 9.48±0.22* | 16.3±3.2 | 0.13±0.02† | 0.20±0.05† |
| RA | 8.25±0.26† | 15.4±0.52† | 0.10±0.03† | 0.18±0.03 |
| Meth | ||||
| LA | 9.59±1.37 | 18.4±6.2 | 0.22±0.03* | 0.32±0.03* |
| RA | 10.91±0.77 | 18.8±5.2 | 0.14±0.02 | 0.21±0.05 |
| ANOVA | ||||
| LA | <0.0001 | <0.007 | <0.001 | <0.001 |
| RA | <0.0001 | <0.02 | 0.03 | NS |
Values are means ± SD. DF, dominant frequency; CoV, coefficient of variance; LA, left atria; RA, right atria; MR, mitral regurgitation; CHF, congestive heart failure; RAP, rapid atrial pacing; Meth, methylcholine; NS, not significant.
P < 0.05 between RA of that model.
P < 0.05 between Meth of that atria.
P < 0.05 between RAP of that atria.
To quantify the amount of fibrillatory conduction (progressive breakup of high-frequency waves as they propagate away from a periodic source) (21) and its relationship to the DF of the driver, the standard deviations of all DFs were plotted against the highest DF for each episode. The graphs in Fig. 5, A–E, show the results of quantifying the differences in fibrillatory conduction among the models. As the graphs show, only the Meth model had a strong correlation between the highest DF and the dispersion (correlation coefficient = 0.928). The control group did show a trend toward a linear relationship (correlation coefficient = 0.75), but this was not the case for the other AF models.
Fig. 5.
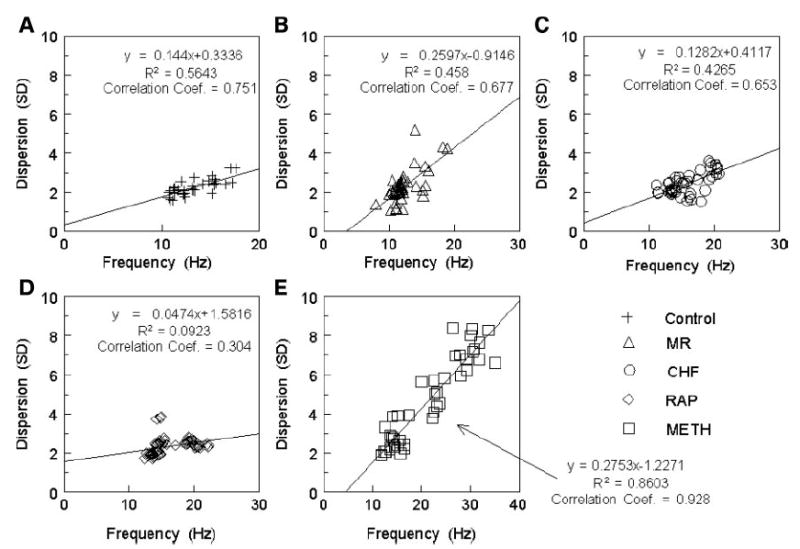
The highest DF measured was plotted against the dispersion (SD) of all measured frequencies for each model: A: control. B: MR. C: CHF. D: RAP. E: Meth.
To quantify the size of the highest DF areas, as well as the steepness of the frequency gradients, the cumulative distribution of the DFs was plotted against the mapped area of the atria in Fig. 6. The graphs show the area of the atrium that is occupied by each decile of the highest DF for the RA and LA in each model. There was a significant difference between the RA and LA curves in the control, MR, and RAP models at the 40% decile level. These data also show that, compared with the other groups, the MR group had a significantly larger area of the highest DF with 26 ± 16% of the mapped area occupied by the highest decile of DF (P = 0.05).
Fig. 6.
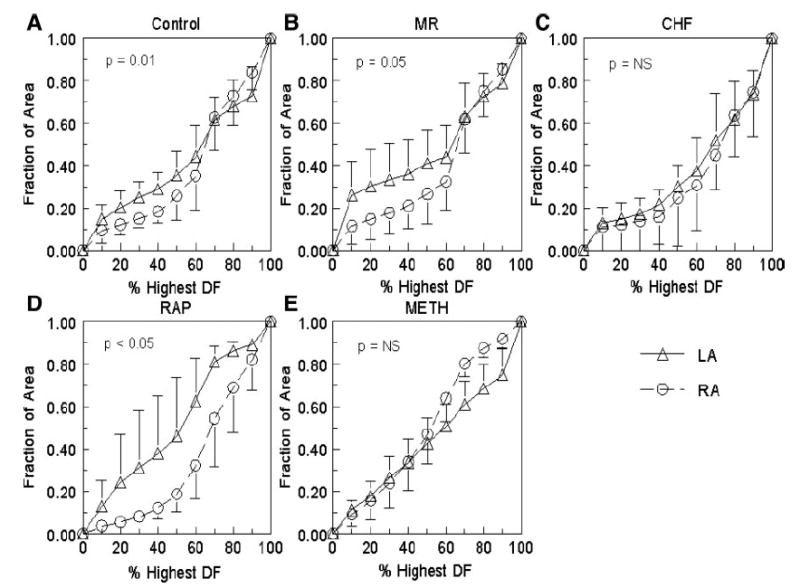
Cumulative distribution of the DF vs. the mapped area of the atrium. A: control. B: MR. C: CHF. D: RAP. E: Meth. The triangles represent the LA, and the circles represent the RA. P value is for comparison at the 40% decile.
Spatial Organization
To measure the spatial organization of the DFs, the spatial coefficient of variance was calculated, and the data are shown in Table 1. As the data in Table 1 show, the Meth model had a significantly higher variance of frequencies than all of the other models in the LA. Also, these data show that the Meth LA variance is significantly higher than the RA variance. Although the variance of DFs in the RA is significantly lower than in the LA for the Meth model, it is still higher than in the other models. This DF spatial variance gradient in the Meth model is also seen when the data are broken down into individual atrial locations.
To quantify what proportion of the signal is being activated by the DF (the “dominance” of the DF), the OI (9) was used to represent the organization of the AF signal. A higher OI signifies a higher degree of organization. For each 30-s epoch of AF, the OI maps were constructed for each 2-s window and compiled together into an organization movie that is shown in the Supplemental Materials (Supplemental Fig. S2, A–E). Overall, the Meth AF model shows lower OI levels than the other models, as this model rarely displayed OI levels above 0.5. An organization gradient from RA-LA is seen with the RAP model, as the RA shows consistently higher organization levels than the LA. This is shown in the representative static maps in Fig. 4A, as the RAP example shows that the RA has higher organization levels represented by the lighter shades of blue and green colors than the RAP LA and the Meth model, which has the RA and LA occupied by darker shades of blue. The control, MR, and CHF models show similar levels of organization throughout the AF recordings, but the CHF model has a wider range of organization, leading to regional organization gradients.
The organization data are summarized in Table 2, showing the mean LA and RA OI values for each model. As the Table 2 shows, the OI values of the RAP and Meth models are significantly lower in both the LA and RA than those of control, CHF, and MR. Also, Table 2 shows that the OI levels in the RAP RA are significantly higher than those in the LA, but the RA RAP OI values are still significantly lower than the RA OI values in the control, MR, and CHF models. When these data are broken down into individual LA and RA sites (Supplemental Fig. S4), all of the models have similar mean OI values from site to site except for the RAP group, which demonstrated the RA-to-LA organization gradient.
Table 2.
Organization index calculations
| Mean OI | Max OI | OI Spatial CoV | OI Temporal CoV | |
|---|---|---|---|---|
| Control | ||||
| LA | 0.44±0.01‡† | 0.59±0.10‡ | 0.07±0.02† | 0.18±0.01† |
| RA | 0.45±0.03‡† | 0.62±0.08 | 0.08±0.01 | 0.18±0.01† |
| MR | ||||
| LA | 0.49±0.01‡† | 0.62±0.09‡† | 0.07±0.01† | 0.18±0.01† |
| RA | 0.48±0.01‡† | 0.65±0.07‡† | 0.09±0.02 | 0.18±0.01† |
| CHF | ||||
| LA | 0.44±0.02*‡† | 0.60±0.08‡ | 0.11±0.03‡ | 0.18±0.01† |
| RA | 0.48±0.02‡† | 0.63±0.12‡† | 0.11±0.03‡ | 0.17±0.01† |
| RAP | ||||
| LA | 0.31±0.01* | 0.46±0.03* | 0.08±0.01† | 0.18±0.01† |
| RA | 0.38±0.02† | 0.54±0.06 | 0.09±0.01 | 0.17±0.01† |
| Meth | ||||
| LA | 0.33±0.01* | 0.52±0.06 | 0.11±0.02 | 0.22±0.01 |
| RA | 0.31±0.01 | 0.50±0.02 | 0.09±0.01 | 0.21±0.01 |
| ANOVA | ||||
| LA | <0.0001 | <0.004 | <0.001 | <0.0001 |
| RA | <0.0001 | <0.002 | <0.05 | <0.0001 |
Values are means ± SD. OI, organization index.
P < 0.05 between RA of that model.
P < 0.05 between Meth of that atria.
P < 0.05 between RAP of that atria.
Spatially, the CHF and Meth models had significantly higher coefficients of variation of OI between electrograms in LA than in the other models, as shown in Table 2. This trend was also present in the RA of the CHF. When the data are divided into individual regions, all regions showed a certain degree of consistency, as they all had a variance <15%.
To further analyze spatial organization, all electrograms in each region were cross-correlated. Table 3 shows the results from this calculation as the mean correlation coefficient for each region. As Table 3 shows, all models had differences between sites. The RA free wall sites, RAPW and RAIW, had the lowest correlation values for each model except for CHF. In the RAPW, the CHF coefficients were significantly higher than those of any of the other models. In the RAIW, the CHF was significantly higher than the RAP and Meth. On the other hand, the LA appendage sites (LLAA and MLAA) had the highest correlation values for each group.
Table 3.
Correlation coefficient of activation
| MLAA | LLAA | LBB | LHLW | LLLW | MRAA | LRAA | RBB | RAPW | RAIW | ANOVA | |
|---|---|---|---|---|---|---|---|---|---|---|---|
| Control | 0.95±0.04‡† | 0.94±0.04 | 0.88±0.08 | 0.90±0.11 | 0.88±0.08 | 0.90±0.06 | 0.87±0.07 | 0.87±0.08 | 0.83±0.08 | 0.81±0.10 | <0.0001 |
| MR | 0.94±0.04‡† | 0.95±0.04 | 0.87±0.08 | 0.91±0.05‡† | 0.91±0.05‡† | 0.89±0.07 | 0.87±0.07 | 0.88±0.09 | 0.84±0.08 | 0.81±0.09 | <0.0001 |
| CHF | 0.93±0.06 | 0.91±0.06 | 0.88±0.08 | 0.88±0.06 | 0.84±0.10 | 0.93±0.05‡ | 0.90±0.06‡† | 0.90±0.07 | 0.88±0.07‡† | 0.85±0.09 | <0.01 |
| RAP | 0.88±0.07 | 0.89±0.06 | 0.86±0.07 | 0.85±0.06 | 0.83±0.08 | 0.87±0.07 | 0.83±0.09 | 0.85±0.09 | 0.80±0.07 | 0.79±0.09 | <0.0001 |
| Meth | 0.91±0.07 | 0.91±0.05 | 0.87±0.07 | 0.86±0.07 | 0.86±0.07 | 0.90±0.07 | 0.86±0.07 | 0.87±0.08 | 0.82±0.07 | 0.79±0.09 | <0.0001 |
| ANOVA | <0.04 | NS | NS | <0.06 | <0.01 | NS | 0.08 | NS | 0.01 | NS |
Values are means ± SD. MLAA, medial left atrial appendage; LLAA, lateral left atrial appendage; MRAA, medial right atrial appendage; LRAA, lateral right atrial appendage; LBB, left atrial Bachman’s bundle; RBB, right atrial Bachman’s bundle; RAPW, right atrial posterior wall; RAIW, right atrial inferior wall; LHLW, left atrial high lateral wall; LLLW, left atrial low lateral wall.
P < 0.05 between Meth of that atria.
P < 0.05 between RAP of that atria.
Temporal Organization
To analyze the temporal stability of DFs and OIs between 2-s window calculations in each epoch, a coefficient of variance (SD/mean) between calculations was determined. A summary of the results is shown in Table 1 for DF and Table 2 for OI. As Table 1 shows, for the temporal variance of DFs in the control, MR, and Meth models, the variance is higher in the LA than in the RA. This difference reached significance in the control and Meth groups. When the data were broken down into individual regions, the Meth AF model had a greater variance in the LA sites than the other models. Also of note, the RAP model had a consistent TCoV from site to site of <20%, except for the LBB region, which was 29% (P < 0.05). For the OIs, as Table 2 shows, all models had similar results for both RA and LA except the Meth model, which had a significantly higher TCoV of OI in both atria compared with the other models (ANOVA, P < 0.05). When the different atrial regions were analyzed for all models, there was consistency in the OI temporal coefficient of variance from site to site, which was between 15 and 20%, except that the Meth model had a greater (P < 0.0001) variance than the other models at every site (20–25%). This demonstrates that each model has some variation in AF organization between more organized periods and more disorganized periods over time.
Fractionated Electrograms
All of the signals from each AF episode from each animal were visually inspected for fractionation. As shown in Fig. 1D, signals that had double potentials, triple potentials, or varying potentials during AF were considered fractionated. For each dog model, the amount of area that consisted of fractionated electrograms was quantitated and is shown in Fig. 7A. As Fig. 7 shows, the CHF model had the smallest area of fractionated signals. However, when this area of fractionated electrograms in the CHF model was correlated with stable high-frequency areas, the top 20% of the highest DFs consisted of 73 ± 35% (median 83%) fractionated electrograms. This indicates that the majority of electrograms that compose the high-DF areas are fractionated. For the MR and Meth models that had stable high-DF areas, the top 20% of the highest DFs was composed of 75 ± 23% (median 70%) and 63 ± 25% (median 62%), respectively, fractionated electrograms. The fractionated signals were then correlated with organization, as shown in Fig. 7B. As Fig. 7B shows, for all models except Meth, the fractionated electrograms were less organized than the nonfractionated electrograms.
Fig. 7.
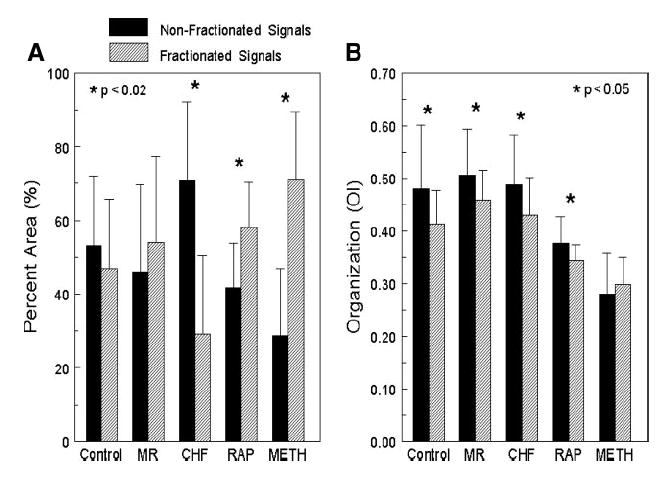
All of the signals recorded during each AF episode in every canine model were observed for fractionation. A: %area of the total mapped atria that contained fractionated (hatched bars) or nonfractionated (solid bars) electrograms. B: organization (OI) of the fractionated and nonfractionated electrograms for each canine model.
Histology
Transmural tissue sections from the RA and LA were stained using Sirius red to compare the distribution of fibrous tissue in each of the groups of control, MR, CHF, and RAP. As shown in Fig. 8, the CHF group had twice the amount of fibrosis compared with the other groups (15 ± 2.3 vs. 2.3 ± 2.7%, 7.4 ± 4.3%, and 6.0 ± 1.9%; ANOVA, P < 0.0001).
Fig. 8.
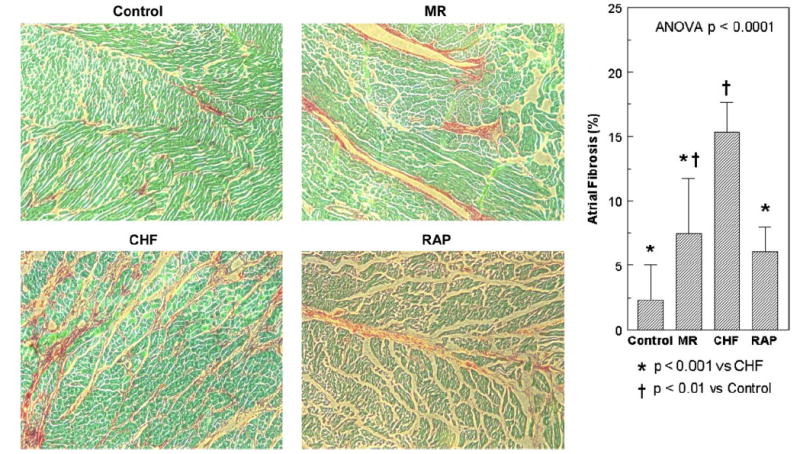
Amount and distribution of fibrosis from atrial tissue samples from the canine models of control, MR, CHF, and RAP. Each tissue sample is stained with Sirius red and magnified ×100. The CHF group had a significantly larger amount of fibrosis compared with the other groups.
DISCUSSION
This study demonstrated that the type of remodeling that the atria undergo, either structural, dominated by conduction abnormalities, or electrical, dominated by effective refractory period (ERP) shortening, affects the characteristics of the AF in that model and ultimately its spatiotemporal organization. Although AF can be reliably initiated in either of these substrates (i.e., any of the models), the characteristics of the AF in each differs. The models known to result in electrical remodeling, producing ERP shortening (25, 44), had AF characteristics of multiple wavelets (RAP) or multiple stable high-frequency areas (Meth) with multiple wavefronts in other areas of the atria. Although the RAP model does show some degree of fibrosis, which was more than for control, it does not reach the level of that of the MR or CHF models. In addition, it has been shown that the structural atrial remodeling that is seen in the MR and CHF models does not involve any electrical atrial remodeling (i.e., shortening of ERP and action potential duration) that the RAP model experiences (20, 42, 43). Moreover, the RAP model does not demonstrate any changes in conduction (20, 42). The RAP model was also the only model in which every animal studied showed a consistent frequency gradient between RA and LA, with the LA always having significantly higher frequencies than the RA. However, in this model, no animal had AF episodes that had stable, discrete, high-frequency areas or LA-LA frequency gradients. This could be due to the smaller degree of structural changes and lack of remodeling that affects conduction seen in the RAP model, so that the entire LA is activated at a similar frequency, masking a potential high-frequency site. In the case of the Meth model, multiple, stable, high-frequency areas were seen that also corresponded to lower organization levels, lower correlation coefficients, and higher temporal and spatial variances in frequency and organization. This supports the idea that the Meth model had an AF mechanism of multiple rotors spinning off several daughter wavelets that were colliding with each other, creating varying frequency patterns away from the rotors.
The models that experienced structural remodeling known to result in alterations in conduction (20, 42, 43) had stable, discrete, high-frequency areas in the DF maps. Steep frequency gradients and large areas of similar frequencies were seen away from the high-frequency areas. The frequency characteristics remained stable from epoch to epoch. This resulted in lower spatial and temporal frequency and organization variances and higher correlation coefficient values. This would suggest a stable rotor in these models with highly organized wavefronts in the other areas of the atria, which would correlate with the “mother-rotor” theory as an AF mechanism in these models. These discrete, stable, high-frequency areas that were seen in the MR, CHF, and Meth models were not always confined to the LA. In the Meth AF model, discrete, stable, high-frequency areas were observed in both the RA and LA simultaneously, whereas in the MR and CHF models, these stable areas were singular. Interestingly, in each animal with stable high-frequency areas, the areas remained consistently spatially located from episode to episode. On the basis of data from other studies, these high-DF areas likely represent either mother rotors or triggered activity that is driving the AF (21). Also, the data presented in this paper show that these high-frequency areas correlated with fractionated electrograms and lower organization levels. In a recent study by Kalifa et al. (16), it was shown that these high-frequency areas do have an area of fast, highly-organized activity with high-frequency fractionated electrograms surrounding this area. The high-DF organized area was found to have a diameter of ~2 mm. The spatial resolution of the plaque electrodes used in the current study is not adequate to record this size of an area. What is likely being recorded is the larger area of high-frequency fractionated electrograms that surround the smaller area of highly organized high-DF electrograms. The exit block from the high-frequency source results in other peaks within the FFT between the harmonics and is influenced by the relative size of the driver and electrode spacing. It has been shown that block causes other peaks to appear near the dominant peak (8, 28). This will cause the OI to decrease. A similar scenario occurs with fractionated electrograms, as they have been shown to occur near regions of conduction block (7). This study also supported this finding, as the high-frequency areas corresponded to fractionated electrograms. The structural changes seen in the MR and CHF models could contribute to the frequency gradient seen away from the high-frequency area, as the structural remodeling would promote block out from the high-frequency area and wave breakup.
Mechanisms and Models of AF
Several animal models have been developed to study AF in settings in which AF occurs clinically. In addition, several mechanisms of AF have been proposed from multiple wavelet reentry (2, 23) to focal driver (15) to mother rotor (19, 21, 40), and these mechanisms have been described in differing animal models. However, each animal model has different individual atrial structural and electrophysiological characteristics that this study has shown could affect the mechanism and/or characteristic of the AF in that particular model. No previous study has systematically analyzed the spatiotemporal organization and mechanism of the AF in these models.
Studies characterizing AF induced with acetylcholine in a Langendorff-perfused isolated sheep heart first demonstrated that there exists stable high-frequency sources during the AF (40). These high-frequency sources were demonstrated to be a vortex rotating at a frequency higher than any other recorded in the atrium (21) and thus are considered to be driving the AF. In this sheep model, it was shown that all of the high-frequency sources existed in the LA, and that at a critical frequency, a gradient developed between the LA and RA (22). However, this finding may be species specific (36). In the current study, AF was also induced with Meth in a canine heart, and in this group, high-frequency sources were seen in the RA as well as the LA, and no frequency gradient was seen. Additionally, when the highest DF was plotted vs. frequency dispersion, it resulted in a linear relationship, which supports what previously has been shown in the sheep acetylcholine model, in that the faster the driving source, the greater the degree of fibrillatory conduction (21). This difference between our data showing several high-frequency drivers and those previously reporting a single driver may be due to species differences in the distribution of the ACh-activated potassium current (35).
One of the more widely studied AF models is the RAP model. Although it has been shown that this model is associated with electrical remodeling, with a shortening of the atrial effective refractory period (25, 44), there is still controversy concerning the mechanism of the AF in this model. One study has shown that the RAP model consisted of multiple wavelets (39), whereas another study showed that the pulmonary veins were the source of the highest frequency of activation during AF (45). The mapping and frequency domain analysis of the RAP model in our study showed that this model did not have any discrete, stable, high-frequency sources. None of the analyses in the present study favored a focal driver or rotor and supported multiple wavelet reentry as the mechanism of AF in this group. However, this model did show large, transient, higher frequency areas, and the LA had consistently higher frequencies than the RA, but there were no discrete LA-LA gradients or stable high-frequency areas. The LA was likely activated at a higher frequency overall related to differences in refractoriness (24) and more fibrillatory conduction in the RA leading to lower frequency of activation in the RA (5).
Whereas the Meth and RAP models are known to result in a substrate dominated by ERP shortening without conduction abnormalities (20, 42), the MR and CHF models are known to result in a substrate dominated by conduction abnormalities but not ERP shortening (20, 42, 43). The CHF model has been shown to have increased atrial fibrosis and alterations in atrial conduction, leading to increased conduction heterogeneity and ultimately an increase in AF vulnerability (20). While atrial conduction has been assessed, there has been limited characterization of the AF in this model. One study has suggested that the pulmonary veins play a major role in maintaining the AF in this model (29), whereas other studies have shown that AF in the CHF model has a focal mechanism with the focus occurring along either the crista terminalis or the pulmonary veins (13) or that there could be multiple focal sources (32). Our study has shown that the AF in the CHF model had discrete, stable, high-frequency areas that could be driving the AF in this model and that these high-frequency areas, while always in the same location in a given animal, varied in location from animal to animal. This finding supports the mother-rotor theory as a mechanism of AF in this model but suggests that the rotor does not need to be located in the pulmonary vein region.
Similar to the CHF model, structural changes are also seen in the MR model (43). In the MR model, it has been shown with optical mapping that there exist stable high-frequency areas (12). This finding was also seen in this study, as 44% of the MR dogs showed a discrete, stable, high-frequency area during AF. These data also support the mother-rotor theory as a mechanism of AF in this model.
Recently, frequency domain analysis has been performed on AF electrograms collected during mapping in humans. Lazar et al. (18) showed that a frequency gradient existed in patients with paroxysmal AF, with the highest frequencies located at the pulmonary vein (PV)-LA junction. However, this gradient did not exist in patients with persistent AF. These results differ from what was shown in the canine models in this study, as the RAP model, which would be the model that most closely resembles persistent AF in humans, was the only model with a consistent LA-RA frequency gradient. In other studies of mapping AF in patients, Sahadevan et al. (33) and Sanders et al. (34) showed that, with frequency domain analysis, they were able to locate high-frequency areas that might be driving the AF. This was similar to what was found in the CHF and MR canine models in this study, as high-frequency areas were found in these models that may be driving the AF.
Implications
This study has shown that the AF in the different animal models has different characteristics, and that not all AF is the same. Moreover, our data demonstrate that the underlying substrate greatly affects the character and mechanism of the AF. Animals from the CHF and MR groups on average had similar DF and organization levels, and both had evidence of discrete, stable, high-DF areas. While the main characteristic of these models is structural changes with few electrophysiological changes, the RAP and Meth models are known for changes in refractoriness with few structural changes. Thus differences in the AF activation, DFs, and organization were seen compared with the CHF and MR models, with the RAP and Meth models showing higher DFs and lower organization levels. Studies looking at AF mechanisms and therapies should be critical of which animal model is being used, as the different AF mechanisms in the different models may alter the results and findings.
Limitations
Only epicardial AF recordings were analyzed, and it is not known whether the same findings would be seen from endocardial recordings. However, the purpose of this study was to determine whether the characteristics of AF were different within the different substrates unique to each canine model, since marked differences in conduction and atrial structure are seen among the models. In addition, because endocardial AF signals were not recorded, the septum was not mapped, and it is not known whether there are any differences in the AF between the models at this site. Finally, the PVs were not mapped in any model. It is possible that high-DF areas could be within the PVs and driving the AF. However, the edge of the LA plaque was located at the PV-LA junction, and no high-frequency areas were located in this region. This study has shown that the different atrial substrates produced by the different types of atrial remodeling (either structural or electrical) result in different characteristics of AF. Because of the limitations of the atrial mapping performed in this study that are stated above, it is difficult to clearly indicate the presence of a particular AF mechanism. Although the data do support one mechanism more than another, the exact AF mechanism in each model is not known. Some of the statistical tests performed on the data did not reach statistical significance (P < 0.05), which could be due to the low power from the numbers of dogs in each group.
In conclusion, all of the canine models showed distinctly different frequency patterns during AF. AF in the RAP and Meth models, which have atrial electrical remodeling, showed higher DFs and lower OIs (less organized) and, overall, a decrease in the spatiotemporal organization compared with the other AF models of atrial structural remodeling (MR and CHF). The RAP group also was the only model that showed a consistent DF gradient from LA to RA. The Meth model also showed an increase in both spatial and temporal variance of DF and OI. The MR, CHF, and Meth models showed areas of stable, discrete, high-frequency areas that correlated with fractionated electrograms and lower organization levels. The different atrial substrates developed as separate structural remodeling or electrical remodeling animal models lead to differences in the characteristics of the atrial fibrillation and ultimately its spatiotemporal organization. This suggests that the mechanism of AF, either multiple wavelet reentry, focal driver, or mother rotor, depends on the existing atrial substrate.
Acknowledgments
GRANTS This work was supported by National Heart, Lung, and Blood Institute Grant RO1-HL-072854 (to J. E. Olgin).
References
- 1.Allessie M, Ausma J, Schotten U. Electrical, contractile and structural remodeling during atrial fibrillation. Cardiovasc Res. 2002;54:230–246. doi: 10.1016/s0008-6363(02)00258-4. [DOI] [PubMed] [Google Scholar]
- 2.Allessie M, Lammers WJEP, Bonke FIM, Hollen J. Experimental evaluation of Moe’s multiple wavelet hypothesis of atrial fibrillation. In: Zipes DP, Jalife J, editors. Cardiac Electrophysiology and Arrhythmias. Orlando FL: Grune and Straton; 1985. pp. 265–275. [Google Scholar]
- 3.Ausma J, Litjens N, Lenders MH, Duimel H, Mast F, Wouters L, Ramaekers F, Allessie M, Borgers M. Time course of atrial fibrillation-induced cellular structural remodeling in atria of the goat. J Mol Cell Cardiol. 2001;33:2083–2094. doi: 10.1006/jmcc.2001.1472. [DOI] [PubMed] [Google Scholar]
- 4.Benser ME, Walcott GP, Killingsworth CR, Girouard SD, Morris MM, Ideker RE. Atrial defibrillation thresholds of electrode configurations available to an atrioventricular defibrillator. J Cardiovasc Electrophysiol. 2001;12:957–964. doi: 10.1046/j.1540-8167.2001.00957.x. [DOI] [PubMed] [Google Scholar]
- 5.Berenfeld O, Zaitsev AV, Mironov SF, Pertsov AM, Jalife J. Frequency-dependent breakdown of wave propagation into fibrillatory conduction across the pectinate muscle network in the isolated sheep right atrium. Circ Res. 2002;90:1173–1180. doi: 10.1161/01.res.0000022854.95998.5c. [DOI] [PubMed] [Google Scholar]
- 6.Botteron GW, Smith JM. A technique for measurement of the extent of spatial organization of atrial activation during atrial fibrillation in the intact human heart. IEEE Trans Biomed Eng. 1995;42:579–586. doi: 10.1109/10.387197. [DOI] [PubMed] [Google Scholar]
- 7.de Bakker JM, van Capelle FJ, Janse MJ, Tasseron S, Vermeulen JT, de Jonge N, Lahpor JR. Fractionated electrograms in dilated cardiomyopathy: origin and relation to abnormal conduction. J Am Coll Cardiol. 1996;27:1071–1078. doi: 10.1016/0735-1097(95)00612-5. [DOI] [PubMed] [Google Scholar]
- 8.Evans FG, Rogers JM, Smith WM, Ideker RE. Automatic detection of conduction block based on time-frequency analysis of unipolar electrograms. IEEE Trans Biomed Eng. 1999;46:1090–1097. doi: 10.1109/10.784140. [DOI] [PubMed] [Google Scholar]
- 9.Everett TH, 4th, Kok LC, Vaughn RH, Moorman JR, Haines DE. Frequency domain algorithm for quantifying atrial fibrillation organization to increase defibrillation efficacy. IEEE Trans Biomed Eng. 2001;48:969–978. doi: 10.1109/10.942586. [DOI] [PubMed] [Google Scholar]
- 10.Everett TH, 4th, Li H, Mangrum JM, McRury ID, Mitchell MA, Redick JA, Haines DE. Electrical, morphological, and ultrastructural remodeling and reverse remodeling in a canine model of chronic atrial fibrillation. Circulation. 2000;102:1454–1460. doi: 10.1161/01.cir.102.12.1454. [DOI] [PubMed] [Google Scholar]
- 11.Everett TH, 4th, Moorman JR, Kok LC, Akar JG, Haines DE. Assessment of global atrial fibrillation organization to optimize timing of atrial defibrillation. Circulation. 2001;103:2857–2861. doi: 10.1161/01.cir.103.23.2857. [DOI] [PubMed] [Google Scholar]
- 12.Everett TH, 4th, Verheule S, Wilson EE, Foreman S, Olgin JE. Left atrial dilatation resulting from chronic mitral regurgitation decreases spatiotemporal organization of atrial fibrillation in left atrium. Am J Physiol Heart Circ Physiol. 2004;286:H2452–H2460. doi: 10.1152/ajpheart.01032.2003. [DOI] [PubMed] [Google Scholar]
- 13.Fenelon G, Shepard RK, Stambler BS. Focal origin of atrial tachycardia in dogs with rapid ventricular pacing-induced heart failure. J Cardiovasc Electrophysiol. 2003;14:1093–1102. doi: 10.1046/j.1540-8167.2003.03110.x. [DOI] [PubMed] [Google Scholar]
- 14.Gerstenfeld EP, Sahakian AV, Swiryn S. Evidence for transient linking of atrial excitation during atrial fibrillation in humans. Circulation. 1992;86:375–382. doi: 10.1161/01.cir.86.2.375. [DOI] [PubMed] [Google Scholar]
- 15.Haissaguerre M, Jais P, Shah DC, Takahashi A, Hocini M, Quiniou G, Garrigue S, Le Mouroux A, Le Metayer P, Clementy J. Spontaneous initiation of atrial fibrillation by ectopic beats originating in the pulmonary veins. N Engl J Med. 1998;339:659–666. doi: 10.1056/NEJM199809033391003. [DOI] [PubMed] [Google Scholar]
- 16.Kalifa J, Tanaka K, Zaitsev AV, Warren M, Vaidyanathan R, Auerbach D, Pandit S, Vikstrom KL, Ploutz-Snyder R, Talkachou A, Atienza F, Guiraudon G, Jalife J, Berenfeld O. Mechanisms of wave fractionation at boundaries of high-frequency excitation in the posterior left atrium of the isolated sheep heart during atrial fibrillation. Circulation. 2006;113:626–633. doi: 10.1161/CIRCULATIONAHA.105.575340. [DOI] [PubMed] [Google Scholar]
- 17.Kumagai K, Khrestian C, Waldo AL. Simultaneous multisite mapping studies during induced atrial fibrillation in the sterile pericarditis model. Insights into the mechanism of its maintenance. Circulation. 1997;95:511–521. doi: 10.1161/01.cir.95.2.511. [DOI] [PubMed] [Google Scholar]
- 18.Lazar S, Dixit S, Marchlinski FE, Callans DJ, Gerstenfeld EP. Presence of left-to-right atrial frequency gradient in paroxysmal but not persistent atrial fibrillation in humans. Circulation. 2004;110:3181–3186. doi: 10.1161/01.CIR.0000147279.91094.5E. [DOI] [PubMed] [Google Scholar]
- 19.Lewis T, Drury AN, Lliescu CC. Further observations upon the state of rapid re-excitation of the auricles. Heart. 1921;8:311–340. [Google Scholar]
- 20.Li D, Fareh S, Leung TK, Nattel S. Promotion of atrial fibrillation by heart failure in dogs: atrial remodeling of a different sort. Circulation. 1999;100:87–95. doi: 10.1161/01.cir.100.1.87. [DOI] [PubMed] [Google Scholar]
- 21.Mandapati R, Skanes A, Chen J, Berenfeld O, Jalife J. Stable microreentrant sources as a mechanism of atrial fibrillation in the isolated sheep heart. Circulation. 2000;101:194–199. doi: 10.1161/01.cir.101.2.194. [DOI] [PubMed] [Google Scholar]
- 22.Mansour M, Mandapati R, Berenfeld O, Chen J, Samie FH, Jalife J. Left-to-right gradient of atrial frequencies during acute atrial fibrillation in the isolated sheep heart. Circulation. 2001;103:2631–2636. doi: 10.1161/01.cir.103.21.2631. [DOI] [PubMed] [Google Scholar]
- 23.Moe GK, Rheinboldt WC, Abildskov JA. A computer model of atrial fibrillation. Am Heart J. 1964;67:200–220. doi: 10.1016/0002-8703(64)90371-0. [DOI] [PubMed] [Google Scholar]
- 24.Moriguchi M, Niwano S, Yoshizawa N, Kitano Y, Kojima J, Inuo K, Saitou J, Izumi T. Inhomogeneity in the appearance of electrical remodeling during chronic rapid atrial pacing: evaluation of the dispersion of atrial effective refractoriness. Jpn Circ J. 2001;65:335–340. doi: 10.1253/jcj.65.335. [DOI] [PubMed] [Google Scholar]
- 25.Morillo CA, Klein GJ, Jones DL, Guiraudon CM. Chronic rapid atrial pacing. Structural, functional, and electrophysiological characteristics of a new model of sustained atrial fibrillation. Circulation. 1995;91:1588–1595. doi: 10.1161/01.cir.91.5.1588. [DOI] [PubMed] [Google Scholar]
- 26.Nademanee K, McKenzie J, Kosar E, Schwab M, Sunsaneewitayakul B, Vasavakul T, Khunnawat C, Ngarmukos T. A new approach for catheter ablation of atrial fibrillation: mapping of the electrophysiologic substrate. J Am Coll Cardiol. 2004;43:2044–2053. doi: 10.1016/j.jacc.2003.12.054. [DOI] [PubMed] [Google Scholar]
- 27.Neuberger HR, Schotten U, Blaauw Y, Vollmann D, Eijsbouts S, van Hunnik A, Allessie M. Chronic atrial dilation, electrical remodeling, and atrial fibrillation in the goat. J Am Coll Cardiol. 2006;47:644–653. doi: 10.1016/j.jacc.2005.09.041. [DOI] [PubMed] [Google Scholar]
- 28.Newton JC, Johnson PL, Justice RK, Smith WM, Ideker RE. Estimated global epicardial distribution of activation rate and conduction block during porcine ventricular fibrillation. J Cardiovasc Electrophysiol. 2002;13:1035–1041. doi: 10.1046/j.1540-8167.2002.01035.x. [DOI] [PubMed] [Google Scholar]
- 29.Okuyama Y, Miyauchi Y, Park AM, Hamabe A, Zhou S, Hayashi H, Miyauchi M, Omichi C, Pak HN, Brodsky LA, Mandel WJ, Fishbein MC, Karagueuzian HS, Chen PS. High resolution mapping of the pulmonary vein and the vein of Marshall during induced atrial fibrillation and atrial tachycardia in a canine model of pacing-induced congestive heart failure. J Am Coll Cardiol. 2003;42:348–360. doi: 10.1016/s0735-1097(03)00586-2. [DOI] [PubMed] [Google Scholar]
- 30.Pachon MJ, Pachon ME, Pachon MJ, Lobo TJ, Pachon MZ, Vargas RN, Pachon DQ, Lopez MF, Jatene AD. A new treatment for atrial fibrillation based on spectral analysis to guide the catheter RF-ablation. Europace. 2004;6:590–601. doi: 10.1016/j.eupc.2004.08.005. [DOI] [PubMed] [Google Scholar]
- 31.Ryu K, Sahadevan J, Khrestian CM, Stambler BS, Waldo AL. Use of fast fourier transform analysis of atrial electrograms for rapid characterization of atrial activation–implications for delineating possible mechanisms of atrial tachyarrhythmias. J Cardiovasc Electrophysiol. 2006;17:198–206. doi: 10.1111/j.1540-8167.2005.00320.x. [DOI] [PubMed] [Google Scholar]
- 32.Ryu K, Shroff SC, Sahadevan J, Martovitz NL, Khrestian CM, Stambler BS. Mapping of atrial activation during sustained atrial fibrillation in dogs with rapid ventricular pacing induced heart failure: evidence for a role of driver regions. J Cardiovasc Electrophysiol. 2005;16:1348–1358. doi: 10.1111/j.1540-8167.2005.00266.x. [DOI] [PubMed] [Google Scholar]
- 33.Sahadevan J, Ryu K, Peltz L, Khrestian CM, Stewart RW, Markowitz AH, Waldo AL. Epicardial mapping of chronic atrial fibrillation in patients: preliminary observations. Circulation. 2004;110:3293–3299. doi: 10.1161/01.CIR.0000147781.02738.13. [DOI] [PubMed] [Google Scholar]
- 34.Sanders P, Berenfeld O, Hocini M, Jais P, Vaidyanathan R, Hsu LF, Garrigue S, Takahashi Y, Rotter M, Sacher F, Scavee C, Ploutz-Snyder R, Jalife J, Haissaguerre M. Spectral analysis identifies sites of high-frequency activity maintaining atrial fibrillation in humans. Circulation. 2005;112:789–797. doi: 10.1161/CIRCULATIONAHA.104.517011. [DOI] [PubMed] [Google Scholar]
- 35.Sarmast F, Kolli A, Zaitsev A, Parisian K, Dhamoon AS, Guha PK, Warren M, Anumonwo JM, Taffet SM, Berenfeld O, Jalife J. Cholinergic atrial fibrillation: I(K,ACh) gradients determine unequal left/right atrial frequencies and rotor dynamics. Cardiovasc Res. 2003;59:863–873. doi: 10.1016/s0008-6363(03)00540-6. [DOI] [PubMed] [Google Scholar]
- 36.Schuessler RB, Grayson TM, Bromberg BI, Cox JL, Boineau JP. Cholinergically mediated tachyarrhythmias induced by a single extra-stimulus in the isolated canine right atrium. Circ Res. 1992;71:1254–1267. doi: 10.1161/01.res.71.5.1254. [DOI] [PubMed] [Google Scholar]
- 37.Shan Z, Van Der Voort PH, Blaauw Y, Duytschaever M, Allessie MA. Fractionation of electrograms and linking of activation during pharmacologic cardioversion of persistent atrial fibrillation in the goat. J Cardiovasc Electrophysiol. 2004;15:572–580. doi: 10.1046/j.1540-8167.2004.03402.x. [DOI] [PubMed] [Google Scholar]
- 38.Shinagawa K, Shi YF, Tardif JC, Leung TK, Nattel S. Dynamic nature of atrial fibrillation substrate during development and reversal of heart failure in dogs. Circulation. 2002;105:2672–2678. doi: 10.1161/01.cir.0000016826.62813.f5. [DOI] [PubMed] [Google Scholar]
- 39.Sih HJ, Zipes DP, Berbari EJ, Adams DE, Olgin JE. Differences in organization between acute and chronic atrial fibrillation in dogs. J Am Coll Cardiol. 2000;36:924–931. doi: 10.1016/s0735-1097(00)00788-9. [DOI] [PubMed] [Google Scholar]
- 40.Skanes AC, Mandapati R, Berenfeld O, Davidenko JM, Jalife J. Spatiotemporal periodicity during atrial fibrillation in the isolated sheep heart. Circulation. 1998;98:1236–1248. doi: 10.1161/01.cir.98.12.1236. [DOI] [PubMed] [Google Scholar]
- 41.Verheule S, Sato T, Everett T, 4th, Engle SK, Otten D, Rubart-von der Lohe M, Nakajima HO, Nakajima H, Field LJ, Olgin JE. Increased vulnerability to atrial fibrillation in transgenic mice with selective atrial fibrosis caused by overexpression of TGF-beta1. Circ Res. 2004;94:1458–1465. doi: 10.1161/01.RES.0000129579.59664.9d. [DOI] [PMC free article] [PubMed] [Google Scholar]
- 42.Verheule S, Wilson E, Banthia S, Everett TH, 4th, Shanbhag S, Sih HJ, Olgin J. Direction-dependent conduction abnormalities in a canine model of atrial fibrillation due to chronic atrial dilatation. Am J Physiol Heart Circ Physiol. 2004;287:H634–H644. doi: 10.1152/ajpheart.00014.2004. [DOI] [PubMed] [Google Scholar]
- 43.Verheule S, Wilson E, Everett T, 4th, Shanbhag S, Golden C, Olgin J. Alterations in atrial electrophysiology and tissue structure in a canine model of chronic atrial dilatation due to mitral regurgitation. Circulation. 2003;107:2615–2622. doi: 10.1161/01.CIR.0000066915.15187.51. [DOI] [PMC free article] [PubMed] [Google Scholar]
- 44.Wijffels MC, Kirchhof CJ, Dorland R, Allessie MA. Atrial fibrillation begets atrial fibrillation. A study in awake chronically instrumented goats. Circulation. 1995;92:1954–1968. doi: 10.1161/01.cir.92.7.1954. [DOI] [PubMed] [Google Scholar]
- 45.Wu TJ, Ong JJ, Chang CM, Doshi RN, Yashima M, Huang HL, Fishbein MC, Ting CT, Karagueuzian HS, Chen PS. Pulmonary veins and ligament of marshall as sources of rapid activations in a canine model of sustained atrial fibrillation. Circulation. 2001;103:1157–1163. doi: 10.1161/01.cir.103.8.1157. [DOI] [PubMed] [Google Scholar]