Abstract
The interaction of the HIV Gag polyprotein with nucleic acid is a critical step in the assembly of viral particles. The Gag polyprotein is composed of the matrix (MA), capsid (CA), and nucleocapsid (NC) domains. The NC domain is required for nucleic acid interactions, and the CA domain is required for Gag-Gag interactions. Previously, we have investigated the binding of the NC protein to d(TG)n oligonucleotides using surface plasmon resonance (SPR) spectroscopy. We found a single NC protein is able to bind to more than one immobilized oligonucleotide, provided that the oligonucleotides are close enough together. As NC is believed to be the nucleic acid binding domain of Gag, we might expect Gag to show the same complex behavior. We wished to analyze the stoichiometry of Gag binding to oligonucleotides without this complication due to tertiary complex formation. We have therefore analyzed Gag binding to extremely low oligonucleotide density on SPR chips. Such low densities of oligonucleotides are difficult to accurately quantitate. We have determined by Fourier transform ion cyclotron (FTICR) mass spectrometry that four molecules of NC bind to d(TG)10 (a 20-base oligonucleotide). We developed a method of calibrating low-density surfaces using NC calibration injections. Knowing the maximal response and the stoichiometry of binding, we can precisely determine the amount of oligonucleotide immobilized at these very-low-density surfaces (<1 Response Unit). Using this approach, we have measured the binding of Gag to d(TG)10. Gag binds to a 20-mer with a stoichiometry of greater than 4. This suggests that once Gag is bound to the immobilized oligonucleotide, additional Gag molecules can bind to this complex.
Keywords: surface plasmon resonance, low surface density, electrospray ionization Fourier transform mass spectrometry
Human immunodeficiency virus type 1 (HIV-1) nucleocapsid (NC) protein is the major nucleic acid–binding protein within the virus. Previously, we have used surface plasmon resonance (SPR) spectroscopy to understand the molecular mechanisms of the nucleic acid–binding properties of HIV-1 NC to immobilized repeating TG deoxyoligonucleotides.1,2 NC is able to bind to more than one oligonucleotide at a time.2 This is consistent with other work documenting the nucleic acid–aggregating properties of NC.3 This behavior complicates the analysis of NC binding kinetics. However if the density of the immobilized oligonucleotide is sufficiently sparse (~10 Response Units (RU)), NC can no longer interact simultaneously with two oligonucleotide molecules.
NC is initially synthesized as a domain of the Gag polyprotein. The HIV-1 Gag polyprotein is composed of four domains: matrix (MA), capsid (CA), nucleocapsid (NC), and p6. The NC domain is the primary nucleic acid–binding domain of Gag, and CA is responsible for Gag-Gag interactions.4 Expression of HIV-1 Gag in mammalian cells is sufficient for assembly of virus-like particles.4 It is possible to study the assembly of virus-like particles in vitro by incubating bacterially expressed Gag (lacking the p6 domain and a portion of the MA domain) with nucleic acid.5,6 The morphology of these particles resembles that of authentic immature retrovirus particles. This result demonstrates that the ability to form a regular spherical structure is an inherent feature of the Gag molecule, requiring only the presence of nucleic acid.
We wished to study the kinetics and stoichiometry of Gag binding to nucleic acid using SPR. As discussed above, the density of immobilized oligonucleotide needs to be no more than 10 RU to prevent NC from binding to two molecules of oligonucleotide at once. Gag is almost 10 times larger than NC. Thus, we might expect that even lower levels of oligonucleotide would need to be immobilized to prevent Gag displaying the same behavior. Another factor that might complicate the analysis is the fact that Gag shows a propensity to dimerize in solution, with an association constant of 5.5 μM.7 Working at low surface densities of oligonucleotide, we can decrease our working concentration of Gag protein to levels significantly below the association constant for dimerization. One important detail in characterizing binding interactions is knowledge of the stoichiometry. If the density of the oligonucleotide surface is known accurately, then we can determine the stoichiometry of binding. Accurate measurement of levels below 1 RU are technically challenging due to buffer drift and instrument noise in the SPR instrument. We sought to develop a method that would allow us to precisely determine the amount of oligonucleotide immobilized on a chip surface.
Injecting a protein of known binding stoichiometry over the immobilized oligonucleotide would allow us to calculate the precise amount of oligonucleotide on the surface. As mentioned previously, we have used SPR to detail the binding of NC to oligonucleotides, so we chose to use NC to calibrate the oligonucleotide density. However, the binding stoichiometry of NC for the oligonucleotide must be determined.8 Fourier transform ion cyclotron resonance mass spectrometry (ESI-FTICR-MS)9,10 can analyze noncovalent assemblies in the gas phase while preserving their solution-phase association state.11,12 For this reason, it can be employed to determine the composition, stoichiometry, and binding affinity of large macro-molecular complexes consisting of proteins, DNA, RNA, small-molecule ligands, and other components (reviewed in refs. 13–16). ESI-FTICR-MS has been used to measure the affinity and stoichiometry of NC binding to nucleic acids.2,17 In a similar fashion, this technique has been utilized here to determine the binding stoichiometry of NC to a 20-base deoxyoligonucleotide (d(TG)10). The stoichiometric information obtained through these experiments was then used to calibrate the density of sparsely immobilized oligonucleotides on Biacore sensor chips, finally allowing the binding stoichiometry of Gag to d(TG)10 to be determined.
MATERIAL AND METHODS
Purification of Gag Protein
Escherichia coli BL21(DE3)pLysS cells expressing the protein of interest were grown and induced for protein expression (as described in ref. 5). Proteins were purified by a protocol described previously5 with some modifications. The frozen bacterial pellet was resuspended on ice in lysis buffer (20 mM Tris-HCl, pH 7.4, 0.5 M NaCl, 10% [v/v] glycerol, 400 μM ZnCl2, 1 mM phenylmethylsulfonyl fluoride [PMSF], 10 mM β-mercaptoethanol, 1 mM Tris[2-carboxyethyl]phosphine, 0.05% NP40), to make a 10% (w/v) bacterial homogenate. The cells were broken by sonication, insoluble debris was removed by centrifugation, and soluble protein was precipitated with 30% saturated ammonium sulfate. The precipitate was resuspended in lysis buffer without glycerol, and the expressed protein was purified by phosphocellulose (Whatman P11) chromatography. The purified proteins were stored in storage buffer (20 mM Tris-HCl, pH 7.4, with 0.5 M NaCl, 1 mM PMSF and 10 mM dithiothreitol [DTT], 1 μM ZnCl2) at 5 10 mg/mL. Prior to experiments, the proteins were further purified by gel filtration chromatography on a Superose 6 column, equilibrated in 20 mM Tris-HCl, pH 7.4, with 0.5 M NaCl, 1 mM PMSF, 0.1 mM TCEP, and 1 μM ZnCl2. Protein concentrations were determined by spectrophotometry in 6 M guanidine hydrochloride; whenever they were compared, these absorbance results were always consistent with colorimetric (Bradford) assays. The two zinc fingers per molecule in a Gag preparation were found by flame atomic absorption spectrophotometry to be 75 82% occupied with zinc.
Surface Plasmon Resonance Spectroscopy
All SPR experiments were performed using a Biacore T100 instrument. d(TG)10 (TGTGTGTGTGTGTGTGTGTG) biotinylated at the 3′ end was purchased from Integrated DNA Technologies (Skokie, IL). CM5 Research grade sensor chips were preconditioned by making duplicate injections of 10 mM HCl, 50 mM NaOH, 0.1% (w/v) SDS, and water, each with a contact time of 6 sec. The immobilization wizard was used to amine-couple NeutrAvidin (Pierce) to all flow cells. Specifically, equal volumes of 0.1 M N-hydroxysuccinate (NHS) were mixed with 0.39 M 1-ethyl-3-(3-dimethylaminopropyl) carbodiimide hydrochloride (EDC) (both reagents from Biacore, Piscataway, NJ) immediately before use and injected over the chip with a contact time of 7 min using 1X HBS (10 mM HEPES, pH 7.5, 150 mM NaCl) and a flow rate of 20 μL/min. Incremental injections of 40μg/mL of NeutrAvidin reconstituted in 10 mM sodium acetate buffer (pH 4.5) were made until a surface density of 500 RU was achieved. The surface was blocked with a 7-min injection of 1 M ethanolamine (Biacore). Surfaces were prepared for oligonucleotide immobilization with two 30-sec injections of 0.1% (w/v) SDS to remove any uncoupled NeutrAvidin from the flow cell. 1X HBS buffer was flowed for 6 min to ensure complete removal of SDS from the flow cells. Stocks of biotinylated d(TG)10 were diluted in 10 mM Tris (pH 7.5), 300 mM NaCl, 1 mM EDTA to concentrations of 3.5 and 11 nM, and injected over flow cells 4 and 2, respectively, at a flow rate of 30 μL/min and a contact time of 10 sec. Two 30-sec injections of 0.1% (w/v) SDS were used to remove any unattached oligonucleotide.
Purified Gag was serially diluted into running buffer consisting of 20 mM HEPES (pH 7.5), 200 mM NaCl, 1 μM zinc chloride, 100 μM TCEP, 5 mM β-mercaptoethanol, 0.05% (w/v) polyethylene glycol 20000, 0.005% (v/v) Tween-20. Samples of Gag were prepared at concentrations of 0.19, 0.39, 0.78, 1.56, 3.125, 6.25, 12.5, 25, 35, 50, 75, 100, 200, and 400 nM and divided into 2 aliquots. In addition, 10 aliquots of 200 nM NC were also prepared in the running buffer. Samples were maintained at 25°C during the course of the experiment. The flow rate was 64 μL/min. Prior to starting the run, the instrument was primed twice and normalized using 70% (v/v) glycerol. A start-up cycle of 10 buffer injections was included at the beginning of the experiment. The two duplicate Gag dilution series were injected in a serpentine manner over each flow cell, with a contact time of 64 sec and a dissociation time of 190 sec. Disruption of any complex that remained bound after dissociation was achieved using 32-sec injections of 0.1% (w/v) SDS followed by 1 M NaCl, and running buffer. The samples were injected from lowest to highest concentration for the first duplicate series and then repeated with the second duplicate series. Each Gag injection was followed immediately with a running buffer injection for referencing purposes. In addition, a 200 nM NC injection was made after every seven Gag injections.
Data Processing
The data were x and y transformed using Scrubber version 2. Flow cells 1 and 3 were used as references for flow cells 2 and 4, respectively. The average buffer response was subtracted from each sample injection (double referencing). Steady-state binding was fit using a two-site binding model, as shown below.
where B = sum of bound species for the two types of complex;l Rmax1 and Rmax2 = total concentration to the two species of ligand; F = total concentration of analyte; KD1 and KD2 = equilibria dissociation constants for the two types of bound complex; and NS = nonspecific binding.
Calculation to Determine the Separation of Two Immobilized d(TG)10 Molecules
To estimate the distribution of distances between a Gag molecule bound to a d(TG)10 molecule and a second Gag molecule bound to a d(TG)10 molecule in a volume, we first assume random placement of the molecules. Under this assumption, the distance distribution follows a Poisson distribution. The Poisson parameter, , is given by: λ
where Rmax = Amount of d(TG)10 immobilized in the reaction volume; Wt = Molecular weight of the d(TG)10; and Av = Avogadro’s number.
Note that the constants result from the assumption that 1 RU is 1 picogram/mm2, and the depth of the reaction volume is 1000 Å; thus, λ describes the number of d(TG)10 molecules per volume of 1 Å3. The probability density function for a single d(TG)10 molecule in a given radius (λ) is given by:
When the volume of the d(TG)10 molecule is small with respect to the volume that contains all of the d(TG)10 molecules, the above density provides a useful approximation. When the amount of d(TG)10 is 0.35 RU, the probability of two Gag molecules bound to two different d(TG)10 molecules touching is 0.002.
Mass Spectrometry
Sample solutions containing the desired concentrations of NC and oligonucleotides were prepared in 150 mM ammonium acetate (pH 7.0) according to procedures described earlier.2,16 After mixing the different components, each 5-μL aliquot was loaded onto a borosilicate nanospray emitter, and a platinum wire was inserted from the back end to provide the necessary voltage. All determinations were performed on a Bruker (Billerica, MA) Apex III Fourier transform ion cyclotron (FTICR) mass spectrometer equipped with a 7T shielded superconductive magnet and a thermally assisted Apollo atmospheric pressure ion source. All data were acquired in negative ion mode and processed using XMASS 7.0.2 (Bruker, Billerica, MA).
RESULTS
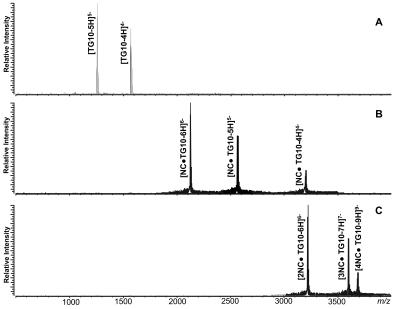
The analysis of a 5 μM solution of d(TG)10 by ESI-FTI-CR-MS provided intense signals with mass over charge ratio (m/z) of 1224.80 and 1531.25, corresponding to the analyte –5 and –4 charge states (Figure 1A). Small amounts of d(TG)10 in which a guanine base had undergone hydrolysis were detected in this sample. Addition of an equimolar amount of NC produced a 1:1 complex (Figure 1B), whereas multiple protein units were found to bind at higher concentrations (see, for example, the complexes with 2, 3, and 4 NC observed upon addition of a threefold amount of protein, Figure 1C). Further protein addition to achieve a fivefold excess over d(TG)10 resulted in the predominant formation of the 4:1 complex, but no higher-order stoichiometries were observed (data not shown). The observed molecular masses are summarized in Table 1. From these data, we conclude that the binding stoichiometry of NC for d(TG)10 is 4, with a binding site of 5 bases consistent with previously published data.2
FIGURE 1.
ESI-FTICR mass spectra obtained from a 5 μm solution of d(TG)10 in 150 mm ammonium acetate in the absence (A) and presence of onefold (B) and threefold NC (C). The observed molecular masses are summarized in Table 1.
TABLE 1.
Summary of the Results Obtained by ESI-FTICR Analysis of Complexes Formed by the Addition of NC to d(TG)10 in 150 mM Ammonium Acetate (pH 7.0)
| Complex | Calc. Mass | Obs. Mass | Dm (ppm) |
|---|---|---|---|
| d(TG)10 | 6129.023 | 6129.11 | 13 |
| d(TG)10 + NC | 12757.912 | 12757.62 | 23 |
| d(TG)10 + 2NC | 19246.801 | 19247.51 | 37 |
| d(TG)10 + 3NC | 25753.690 | 25755.31 | 64 |
| d(TG)10 + 4NC | 32242.579 | 32245.16 | 80 |
The monoisotopic masses observed in these experiments are compared with those calculated from the sequences.
In order to make low-density oligonucleotide surfaces on a Biacore CM5 sensor chip, 500 RU of NeutrAvidin was amine-coupled to each of the four flow cells using the immobilization wizard. Dilutions of biotinylated d(TG)10 at 11 and 3.5 nM were injected over flow cells 2 and 4, respectively, with a contact time of 10 sec. Because these oligonucleotide concentrations were so low, it was not possible to convincingly detect an increase in the surface density after the oligonucleotide capture injection. The surface density was estimated using a single 200 nM NC injection. If the density was no more than 1 RU, we considered this a low enough density to measure the binding of Gag.
The experimental method begins with a start-up cycle of buffer injections to equilibrate the instrument response. The Gag protein was serially diluted in the running buffer, and then two aliquots for each concentration were prepared. The Gag samples were injected as two separate series, going from the lowest to the highest concentrations. (In other binding reactions, we have observed non-ideal behavior at high analyte concentrations, and occasionally complete loss of activity of the surface. Starting with the lowest concentration decreases the likelihood of surface inactivation until later in the run.) The dissociation of the Gag-oligonucleotide complex was followed for 190 sec. Any Gag remaining bound to the surface was removed using an injection of 0.1% (w/v) SDS. Residual SDS (or Gag) remaining in the fluidic system was removed using an injection of 1 M NaCl followed by a buffer injection. In order to measure the surface density of the immobilized d(TG)10, 200 nM NC injections were included throughout the experiment. Knowing the stoichiometry of binding from our FTICR mass spectrometric analysis means that we can calculate the exact density of d(TG)10 from the NC binding response. In addition, making replicate NC injections throughout the experiment allowed us to monitor any changes in binding capacity of the immobilized d(TG)10.
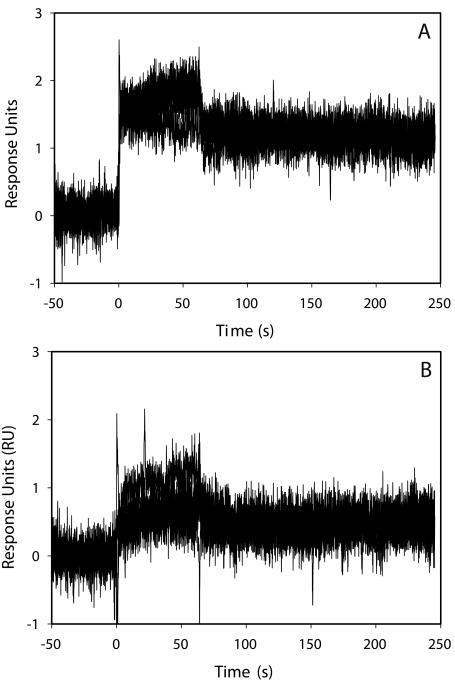
Five representative NC injections are shown for each flow cell in Figure 2. A larger binding response is observed on flow cell 2 (panel A) compared with flow cell 4 (panel B). This is expected since three times the concentration of d(TG)10 was injected over flow cell 2 than over flow cell 4. The binding is in good agreement with our previous analysis and shows NC binds to and dissociates from the d(TG)10 very rapidly.2 Note, however, that the signal does not return to zero, suggesting that not all the NC dissociates from the d(TG)10 surface. This behavior was not observed on eight-base oligonucleotides2; therefore, it seems to be a property of longer oligonucleotides. Further work is required to determine the nature of this activity.
FIGURE 2.
Five replicate 200 nM NC injections over flow cell 2 (A, containing 0.38 Ru d(TG)10) or flow cell 4 (B, containing 0.13 RU d(TG)10).
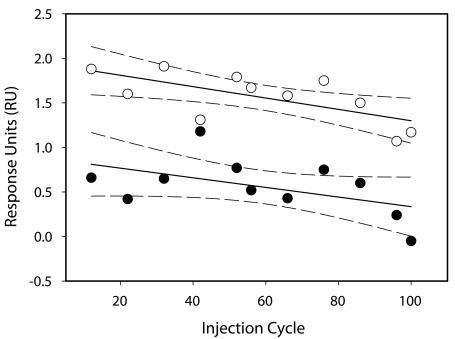
The steady-state binding response of NC was calculated for each injection. Plotting the steady-state binding responses for each NC injection shows us the reproducibility of the binding (Figure 3). All NC injections except cycles 42 and 76 are within the 95% confidence limits. A linear function can fit the responses on both flow cells and clearly demonstrates a negative gradient, confirming gradual loss of surface activity during the course of the experiment. Flow cells 2 and 4 lose 30% and 59%, respectively, of their NC binding capacity during the course of the experiment. Knowledge of this loss in binding activity was taken into account in our analysis of Gag binding.
FIGURE 3.
Binding response of all 200 nm NC calibration injections throughout the experiment. The steady-state binding was averaged between 20–60 secs of the injection cycle over flow cell 2 (open circles) and flow cell 4 (closed circles). The data are fitted to a linear function, and the dotted lines represent the 95% confidence limits.
After measuring the steady-state binding response for each NC injection, we then calculated the average binding response for all the NC injections, giving 1.57 ± 0.28 RU for flow cell 2 and 0.56 ± 0.31 RU for flow cell 4. Using the formula below, we can calculate the amount of d(TG)10 captured on each flow cell.
where RL is the density of d(TG)10 (ligand) on the chip surface; Rmax is the maximum binding response for NC—1.57 RU and 0.56 RU for flow cell 2 and 4, respectively; Sm is the binding stoichiometry—4 molecules of NC per d(TG)10; MWL is the molecular weight of d(TG)10 (ligand); 6272 Da; and MWa is the molecular weight of NC (analyte); 6489 Da.
From these calculations, there are 0.38 and 0.13 RU of d(TG)10 on flow cells 2 and 4, respectively. The NC binding response on flow cell 4 has a large standard deviation (55%). This error comes in part from the loss of activity of the oligonucleotide surface during the course of the experiment (Figure 3) and also reflects the fact that we are approaching the detection limit of the instrument.
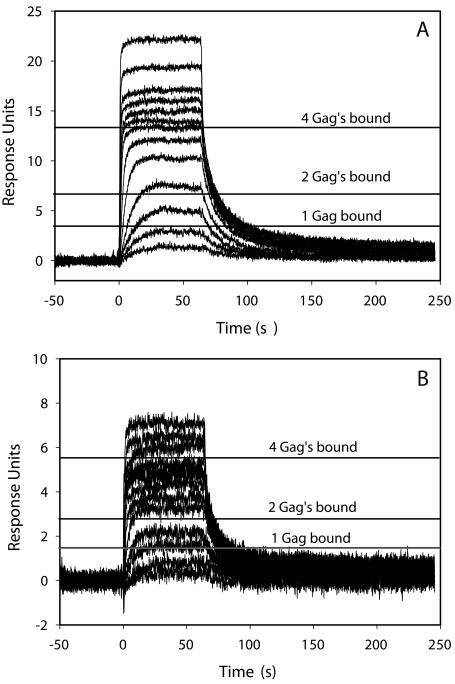
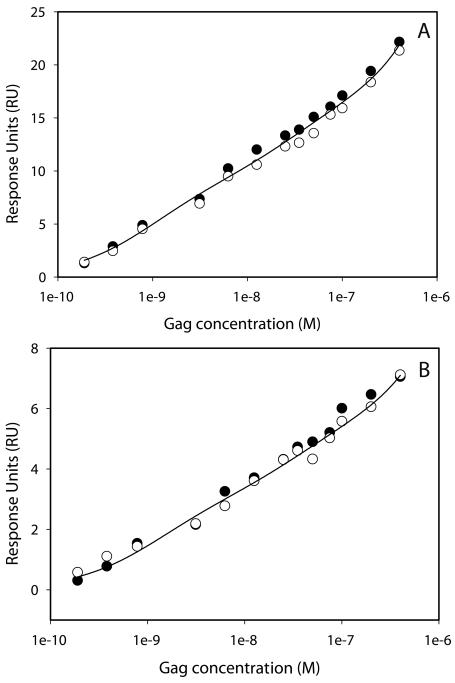
The binding of Gag to the two different levels of immobilized d(TG)10 was measured (Figure 4). Increasing concentrations of Gag were injected over the d(TG)10 and rapidly reached a steady state of binding to the d(TG)10. Gag then completely dissociates from the oligonucleotide within 200 sec. We were unable to fit the dissociation rate constant using a simple 1:1 binding model. This probably reflects the complex nature of this interaction. The kinetics of binding look similar for the two d(TG)10 densities. As expected, the binding response is about three times greater on flow cell 2 compared with flow cell 4, reflecting the higher oligonucleotide density on flow cell 4. Knowing the oligonucleotide density, we can calculate the binding response for Gag at different stoichiometries. In making this calculation, it is also important to take into account the loss of NC-binding capacity of the two d(TG)10 surfaces during the experiment. NC has a binding site size of five bases. Assuming the NC domain of Gag also binds to five bases, then d(TG)10 can bind four molecules of Gag. On both surfaces, however, the Gag binding does not saturate at a stoichiometry of 4, and injection of higher Gag concentrations results in more binding. These data suggest that either the binding site size is smaller than five bases, something that seems unlikely since Gag is a much larger protein than NC, or Gag molecules can bind to Gag molecules bound to d(TG)10. These d(TG)10-Gag-Gag interactions may reflect binding interactions that are required for viral particle assembly. The steady-state binding levels of Gag were calculated from both replicate Gag concentration series and plotted against the Gag concentration (Figure 5). These data clearly show that the binding response does not appear to reach saturation on either d(TG)10 density surface. Making injections of higher Gag concentrations can be problematic as Gag dimerizes in solution (KD is 5.5 μM). We were able to fit the equilibrium binding results using a two site binding model. Given the complexity of the binding reactions this most likely represents a simplified model. The two Kd values measured from two surfaces of different density are in good agreement with one another (Table 2). It is also clear that the binding response from the second Gag concentration series (open circles in Figure 5) gave a slightly lower response than the first concentration series (closed circles). This most likely reflects the loss of the binding capacity of the d(TG)10 surface.
FIGURE 4.
Binding of Gag samples over 0.38 RU (A) or 0.13 RU (B) d(TG)10. Horizontal lines represent the expected response of one, two, or four Gag molecules bound. The loss of binding capacity of the d(TG)10 surface was accounted for when calculating the Gag binding response.
FIGURE 5.
Steady state binding of replicate Gag samples over 0.38 RU (A) or 0.13 RU (B) d(TG) 10. The steady state binding was averaged between 20–60 secs of each Gag injection. The closed circles represent the first series of Gag samples and the closed circles represent the second series of Gag samples. The straight line represents the fit using a two site binding model.
TABLE 2.
The Apparent Equilibrium Binding Constant of Gag for d(TG)10
| Kd1app (nM) | Kd2app (nM) | |
|---|---|---|
| 0.38 RU d(TG)10 | 1.34 | 166.5 |
| 0.13 RU d(TG)10 | 1.13 | 78.5 |
The steady state binding of Gag for d(TG)10 (Figure 5) was fit using a two-site binding model.
DISCUSSION
This work outlines a protocol that allows precise measurement of a very low density of immobilized oligonucleotide. In turn, this method relies on very sensitive FTICR-MS measurements to determine the stoichiometry of NC binding to d(TG)10. Using this information and the binding response of NC injections at saturating concentrations, we can calculate the oligonucleotide surface density. We can easily measure oligonucleotide levels of less than 1 RU and go as low as 0.13 RU.
One of our objectives in this work was to immobilize the d(TG)10 so sparsely that when one Gag molecule bound to a d(TG)10 molecule, it could not interact with a second d(TG)10 molecule. Using a Poisson distribution assumption that all d(TG)10 molecules are placed randomly, we were able to calculate the probability of Gag interacting with two immobilized d(TG)10 molecules (see Materials and Methods). At a d(TG)10 level of 0.35 RU, the likelihood of a d(TG)10-bound Gag interacting with a second d(TG)10-bound Gag is about 0.002, or 0.2%. These considerations justify our assumptions that all the Gag binding is occurring on individual d(TG)10 molecules.
When working with very-low-density surfaces, we observed that the binding capacity decreased over time (Figure 3). This was especially true with the 0.13 RU surface, where after 100 injections the binding capacity had been reduced by 59%. It is important to include NC calibration injections throughout the course of the experiment to track this loss in surface activity. Precise knowledge of this inactivation of the surface can then be used to correct for the Gag binding response.
Our objective was to understand the mechanistic details of Gag binding to the d(TG)10 20-mer oligonucleotide. Gag binds with a low nM affinity to d(TG)10 (Table 2). This is similar to values we have measured for NC. The stoichiometry of Gag binding was greater than 4. These data imply that Gag binds to the oligonucleotide with high affinity, and at least four molecules of Gag cover the 20-mer. Injection of more Gag over the surface results in more binding, suggesting that Gag is able to interact with Gag already bound to the 20-mer. This behavior is consistent with the Gag-Gag interactions that must occur during viral particle assembly. The formation of these oligo-Gag-Gag complexes explains our inability to fit the equilibrium or the kinetic data to a simple 1:1 binding model. Inclusion of an additional binding reaction in the model provided an acceptable fit of the equilibrium data (Figure 4). However, this may still represent a simplified analysis of these data, as we assume there is no cooperativity in the binding of each successive Gag molecule to the d(TG)10. A single-point mutation within the CA domain significantly decreases the dimerization properties of Gag.19 Binding of this mutant protein to sparsely immobilized oligonucleotides may provide information about the cooperativity of Gag-Gag contacts while binding to nucleic acids.
ACKNOWLEDGMENTS
We thank Dr Joan C. May and Joseph J. Prograr (Food and Drug Administration) for measurements of the zinc content of Gag protein. This project has been funded in whole or in part with federal funds from the National Cancer Institute, National Institutes of Health, under contract N01-CO-12400. D.F. and K.B.T. were funded by the National Institutes of Health, 2R01GM064328. The content of this publication does not necessarily reflect the views or policies of the Department of Health and Human Services, nor does mention of trade names, commercial products, or organizations imply endorsement by the U.S. Government.
REFERENCES
- 1.Fisher RJ, Rein A, Fivash M, Urbaneja MA, Casas-Finet JR, Medaglia M, et al. Sequence-specific binding of human immunodeficiency virus type 1 nucleocapsid protein to short oligonucleotides. J Virol. 1998;72:1902–1990. doi: 10.1128/jvi.72.3.1902-1909.1998. [DOI] [PMC free article] [PubMed] [Google Scholar]
- 2.Fisher RJ, Fivash MJ, Stephen AG, Hagan NA, Shenoy SR, Medaglia MV, et al. Complex interactions of HIV-1 nucleocapsid protein with oligonucleotides. Nucl Acids Res. 2006;34:472–484. doi: 10.1093/nar/gkj442. [DOI] [PMC free article] [PubMed] [Google Scholar]
- 3.Stoylov SP, Vuilleumier C, Stoylova E, De Rocqyigny H, Roques BP, Gerard D, et al. Ordered aggregation of ribonucleic acids by the human immunodeficiency virus type 1 nucleocapsid protein. Biopolymers. 1997;41:301–312. doi: 10.1002/(SICI)1097-0282(199703)41:3<301::AID-BIP5>3.0.CO;2-W. [DOI] [PubMed] [Google Scholar]
- 4.Swanstrom R, Wills JW. Synthesis, assembly and processing of viral proteins. In: Coffin JM, Hughes SH, Varmus HE, editors. Retroviruses. Cold Spring Harbor Laboratory Press; Plainview, NY: 1997. pp. 263–334. [PubMed] [Google Scholar]
- 5.Campbell S, Rein A. In vitro assembly properties of human immunodeficiency virus type 1 Gag protein lacking the p6 domain. J Virol. 1999;73:2270–2279. doi: 10.1128/jvi.73.3.2270-2279.1999. [DOI] [PMC free article] [PubMed] [Google Scholar]
- 6.Campbell S, Fisher RJ, Towler E, Fox S, Issaq HJ, Wolfe T, et al. Modulation of HIV-like particle assembly in vitro by inositol phosphates. Proc Natl Acad Sci USA. 2001;98:10,875–10,879. doi: 10.1073/pnas.191224698. [DOI] [PMC free article] [PubMed] [Google Scholar]
- 7.Datta SAK, Zhao Z, Clark PK, Tarasov S, Alexandratos JN, Campbell SJ, et al. Interactions between HIV-1 Gag molecules in solution: An inositol phosphate–mediated switch. J Mol Biol. 2007;365:799–811. doi: 10.1016/j.jmb.2006.10.072. [DOI] [PMC free article] [PubMed] [Google Scholar]
- 8.Yamashita M, Fenn JB. Electrospray ion source. Another variation on the free-jet theme. J Phys Chem. 1984;88:4671–4675. [Google Scholar]
- 9.Comisarow MB, Marshall AG. Fourier transform ion cyclotron resonance. Chem Phys Lett. 1974;25:282–283. [Google Scholar]
- 10.Hendrickson CL, Emmett MR, Marshall AG. Electrospray ionization Fourier transform ion cyclotron resonance mass spectrometry. Annu Rev Phys Chem. 1999;50:517–536. doi: 10.1146/annurev.physchem.50.1.517. [DOI] [PubMed] [Google Scholar]
- 11.Ganem B, Li YT, Henion JD. Detection of non-covalent receptor-ligand complexes by mass spectrometry. J Am Chem Soc. 1991;113:6294–6296. [Google Scholar]
- 12.Ganem B, Li Y-T, Henion JD. Detection of oligonucleotide duplex forms by ion spray mass spectrometry. Tetrahedron Lett. 1993;34:1445–1448. [Google Scholar]
- 13.Loo JA. Studying noncovalent protein complexes by electrospray ionization mass spectrometry. Mass Spectrom Rev. 1997;16:1–23. doi: 10.1002/(SICI)1098-2787(1997)16:1<1::AID-MAS1>3.0.CO;2-L. [DOI] [PubMed] [Google Scholar]
- 14.Hofstadler SA, Griffey RH. Analysis of noncovalent complexes of DNA and RNA by mass spectrometry. Chem Rev. 2001;101:377–390. doi: 10.1021/cr990105o. [DOI] [PubMed] [Google Scholar]
- 15.Beck JL, Colgrave ML, Ralph SF, Sheil MM. Electrospray ionization mass spectrometry of oligonucleotide complexes with drugs, metals, and proteins. Mass Spectrom Rev. 2001;20:61–87. doi: 10.1002/mas.1003. [DOI] [PubMed] [Google Scholar]
- 16.Hofstadler SA, Sannes-Lowery KA, Hannis JC. Analysis of nucleic acids by FTICR MS. Mass Spectrom Rev. 2005;24:265–285. doi: 10.1002/mas.20016. [DOI] [PubMed] [Google Scholar]
- 17.Hagan N, Fabris D. A direct mass spectrometric determination of the stoichiometry and binding affinity of the complexes between HIV-1 nucleocapsid protein and RNA stem-loops hairpins of the HIV-1 Psi-recognition element. Biochemistry. 2003;42:10,736–10,745. doi: 10.1021/bi0348922. [DOI] [PubMed] [Google Scholar]
- 18.Hagan NA, Fabris D. Dissecting the protein-RNA and RNA-RNA interactions in the nucleocapsid-mediated dimerization and isomerization of HIV-1 stemloop 1. J Mol Biol. 2007;365:396–410. doi: 10.1016/j.jmb.2006.09.081. [DOI] [PMC free article] [PubMed] [Google Scholar]
- 19.Datta SAK, Curtis JE, Ratcliff W, Clark PK, Crist RM, Lebowitz J, et al. Conformations of the HIV-1 Gag protein in solution. J Mol Biol. 2007;365:812–824. doi: 10.1016/j.jmb.2006.10.073. [DOI] [PMC free article] [PubMed] [Google Scholar]


