

Abstract
The objectives of this study were to develop a novel ultrasound device to estimate bone mineral density (BMD) at the calcaneus. The device is entirely self-contained, portable (<1kg), and handheld, and permits real-time evaluation of the BMD by computing a parameter known as net time delay (NTD). The NTD is defined as the difference between the transit time through the heel of an ultrasound signal and the transit time through a hypothetical object of equal thickness (to the heel) but containing soft tissue only. This parameter is sensitive primarily to the total amount (i.e., the average total thickness) of bone contained in the propagation path, and thus is equivalent to the bone mineral content estimated by dual-energy x-ray absorptiometry (DXA) scanners, and to the (areal) BMD when normalized by transducer area. Computer simulations of ultrasound propagation were used to study the relationship between NTD and BMD. The simulations used micro-CT images of a set of ten calcaneal bone cores, which were further processed by morphological image processing to obtain a set of thirty-six ‘samples’ with BMD’s ranging from 0.25 – 1.83 g/cm2. The NTD and BMD were found to be very highly correlated (r = 0.99), demonstrating the high sensitivity of NTD to bone mass. A clinical IRB-approved study measured 85 adult women at the heel. BMD was measured at the same time using DXA. A linear regression using NTD produced a linear correlation coefficient of 0.86, which represents a significant improvement over present ultrasound bone densitometers, but not nearly as good as the simulation results. Reasons for this have been identified (viz., errors in distance measurement and lack of coincidence between the DXA and ultrasound regions of interest), and a new device and experimental protocol to deal with these sources of error has been developed and is currently under clinical trials. It is expected that this should improve the correlation between NTD and BMD even further (> 0.9), effectively making the former parameter a proxy for the latter. In conclusion, although x-ray methods are effective in bone mass assessment, osteoporosis remains one of the largest undiagnosed and under-diagnosed diseases in the world today. The research described here, in conjunction with the fact that the devices are designed to be manufactured at very low cost (≈ $400 USD), should enable the significant expansion of diagnosis and monitoring of osteoporosis.
Keywords: osteoporosis, bone mineral density, net time delay, DXA, calcaneus, velocity
Introduction
Osteoporosis is a significant health problem affecting more than 20 million people in the U.S. and more than 200 million worldwide [Anonymous, 2001]. Osteoporosis is defined as the loss of bone mass with a concomitant disruption in microarchitecture, leading to an increased risk of fracture [Kanis, 2002]. The most common osteoporotic fractures occur at the wrist, spine, and hip. Hip fractures have a particularly negative impact on morbidity. Approximately fifty percent of those individuals suffering a hip fracture never live independently again [Miller, 1978]. Currently, there are about two hundred thousand hip fractures yearly in the U.S. and approximately one million worldwide [Anonymous, 2001; Melton, 1988]. The aging of the worldwide population is expected to increase the incidence of hip and other fractures as well [Anonymous, 2001].
The primary method for diagnosing osteoporosis and associated fracture risk relies on bone densitometry to measure bone mass [Kaufman and Siffert, 2001]. The use of bone mass is based on the well-established thesis that bone strength is strongly related to the amount of bone material present and that a stronger bone in a given individual is associated generally with a lower fracture risk [Johnell et al., 2005]. Indeed it has been shown that bone mass has about the same predictive power in predicting fractures as blood pressure has in predicting strokes [Kanis, 2002].
Inherent strength of bone depends upon a host of multi-factorial components, the amount of mineralized matrix being a major factor. Radiological densitometry, which measures the (areal) bone mineral density (BMD) at a given site (e.g., hip, spine, forearm) is currently the accepted indicator of bone strength and fracture risk [Johnell et al., 2005; Blake and Fogelman, 2003]. Clinically, this is often done using dual energy x-ray absorptiometry (DXA), which measures the BMD in units of g/cm2 [Blake and Fogelman, 2003].
Notwithstanding the fact that x-ray methods are useful in assessing bone mass and fracture risk, osteoporosis remains one of the largest undiagnosed and under-diagnosed diseases in the world today [Anonymous, 2001]. Among the reasons for this is that densitometry (i.e., DXA) is not a standard tool in a primary care physician’s office. This is due to its expense, inconvenience, and reticence concerning x-ray exposure, particularly in young adults and children.
Ultrasound has been proposed as an alternative to DXA for a number of reasons. These include the facts that it is non-ionizing, relatively inexpensive, and simple to use. Moreover, since ultrasound is a mechanical wave and interacts with bone in a fundamentally different manner than electromagnetic radiation, it may be able to provide additional components of bone strength, notably its trabecular architecture [Siffert and Kaufman, 2007].
The overall scope of our investigations elucidate measurable biomechanical characteristics of bone quality, bone strength, and fracture risk beyond its mass alone [Siffert et al., 1996]. The specific purpose of this paper, however, is to report on the development of a new portable ultrasound device and to present results obtained in a clinical study that compared the new device with mass (DXA) measurements. The rest of this paper is organized as follows. The next section describes the main components of the device along with the basis for the signal processing algorithm that provides ultrasound parametric estimates of bone mineral density. A description of computer simulations of ultrasound propagation through trabecular bone and of an associated clinical study is then provided, followed by the results of both. The final section provides a discussion and conclusion that also summarizes the results of this study and provides some directions for future research.
Materials and Methods
Ultrasound Computer Simulations
A set of computer simulations of ultrasound propagation was carried out using a set of 3D bone images, obtained as follows. A 1.4 cm diameter core was drilled from the posterior region of 10 human calcanei, obtained from a commercial supplier. They were then scanned with micro-CT at 40 micrometer resolution, and each 3D image voxel was segmented into either bone or soft tissue using simple thresholding based on grey level. An example of one scanned and segmented calcaneal core is shown in the volume-rendered image in Fig. 1. Note that the cylinders consist mostly of trabecular bone but also include the relatively thin cortical shells. Each of the ten binary images was further processed using morphologic operations (dilations and erosions) to obtain 20 additional 3D images with varying densities (volume fractions) [Serra, 1982]. The set of thirty 3D images were then processed to obtain the average bone thickness in the medial-lateral direction. The average bone thickness was defined as follows. At any point on the lateral surface of the cortical bone, the thickness of bone associated with that point is computed by “adding up” all the bone contained between that point to a point on the opposite (medial) cortical surface, along a line parallel to the axis of the cylinder. This was done for each point on the lateral cortical surface and the arithmetic mean of the set of bone thicknesses so obtained was computed for each sample. One can consider bone thickness as to what would remain if all the porosity was removed and the trabecular bone “flattened down to a disk of average thickness, db. Finally, the bone thickness was expressed as an equivalent (areal) bone mineral density (BMD) by using BMD = ρcb · db where as noted, db is the average bone thickness in units of centimeter, ρcb is the volumetric density of (cortical) bone tissue per se in units of g cm−3, and BMD is the mean bone mineral density in units of g cm−2. The volumetric density is provided in the literature, i.e., ρcb = 1.85 g cm−3 [Attix, 1986]. Thus, BMD is related to bone thickness as BMD = 1.85 · db. The volume fraction of each sample was also evaluated by dividing the bone thickness, db, by the overall length of the trabecular cylinder.
Fig. 1.
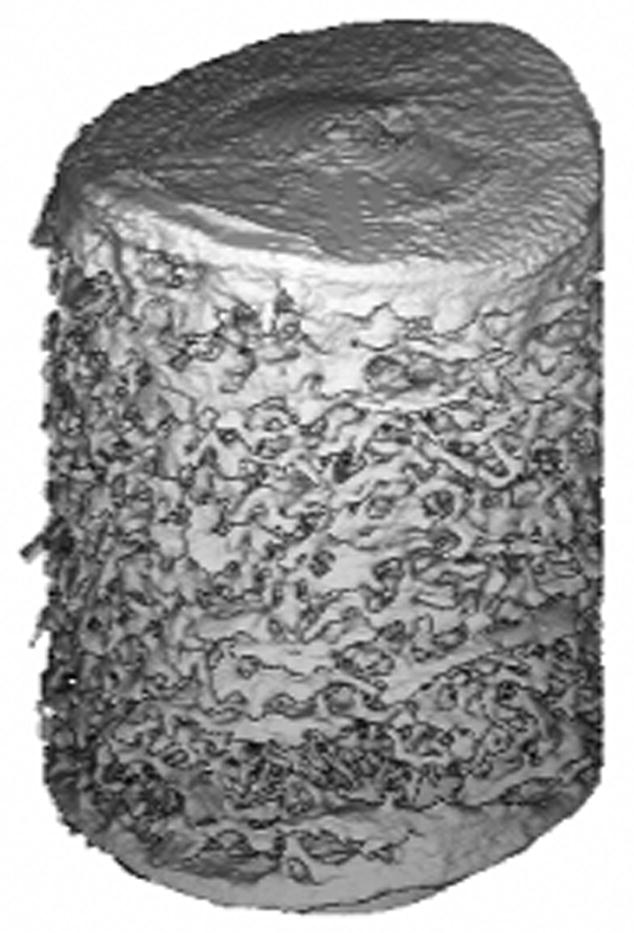
Three-dimensional rendering of a micro-CT of a human calcaneal bone core.
Each 3D image was then processed using a commercial software package (Wave3000 Pro, CyberLogic, Inc., New York, NY, USA) that simulates the propagation of ultrasound through an arbitrary 3D object. The software, which simulates the full solution – including both longitudinal and shear waves – to the linear viscoelastic wave equation, was used to compute the receiver measurements at the medial surface by inputting a 1 MHz broadband pulse (Fig. 2) at the lateral surface of each sample (i.e., each 3D image) [Luo et al., 1999]. To mimic soft tissue overlying the calcaneus in vivo, a small (2–4 mm) layer of water separated the circular source and receiver from the lateral and medial surfaces of the bone samples, respectively.
Fig. 2.
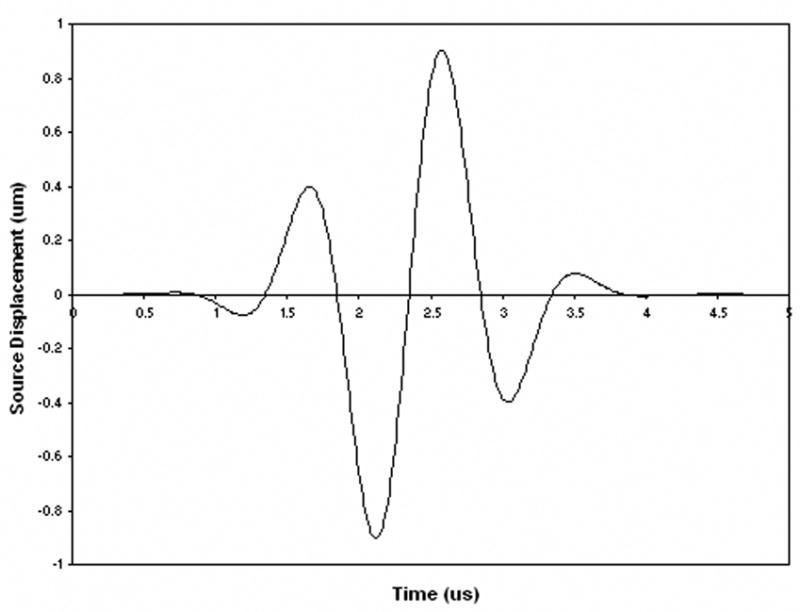
Ultrasound source (displacement) waveform used in the computer simulations.
Device and Clinical Ultrasound Measurements
A new device (QRT® 2000, CyberLogic, Inc., New York, NY, USA) for quantitative real-time bone assessment that is handheld, portable (<1 kg), and powered by 4 “AA” rechargeable batteries has been constructed. It processes ultrasound signals after propagating through a heel and displays an estimate of a parameter for immediate feedback to the user. The device is constructed around a digital signal processor (ADSP2065LKS-240, Analog Devices, Norwood, MA, USA) operating at 60 MHz (180 MFLOPS) and a 14-bit A/D converter that samples the ultrasound signal at 30 MHz. The components are contained on a receiver circuit board – about 5 × 12 cm – and is shown in Fig. 3. The pulser is contained on a separate circuit board measuring about 5 × 5 cm (not shown), and produces a 300 volt 400 nanosecond pulse that excites the 2.25 MHz 12.7 mm diameter source transducer. A 1 MHz 12.7 mm coaxially-located transducer receives the ultrasound signal after it has propagated through a medium under test, e.g., a heel of a foot. Both transducers are flat (unfocussed) and the combination of the higher frequency source with the lower frequency receiver is done to increase the bandwidth of the overall system. Although this is generally not possible in the standard imaging (pulse-echo) mode, through-transmission affords the ability to achieve this kind of ‘passive’ pulse shaping. The transducers are mounted on an electronic caliper that measures the distance between the transducers to a resolution of 0.03 mm. The processed data (ultrasound parameters) are output to a touch-screen LCD graphics display, and the overall control logic is provided by an embedded microcontroller (PIC18FXX2, Microchip Technology Inc., Chandler, AZ, USA). Fig. 4 shows a computer rendering of the device; the spacing of the two transducers in the rendering is 3.8 cm, and the overall height is 23 cm.
Fig. 3.
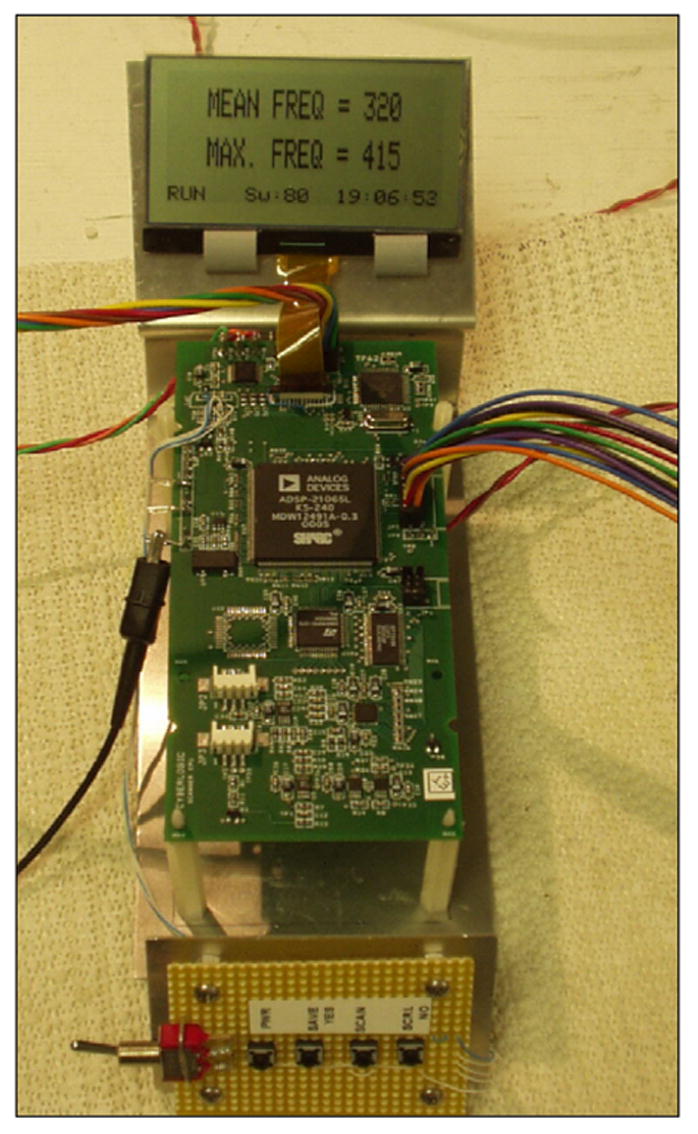
Receiver processing circuit board. This board contains the DSP, A/D converter and microcontroller.
Fig. 4.
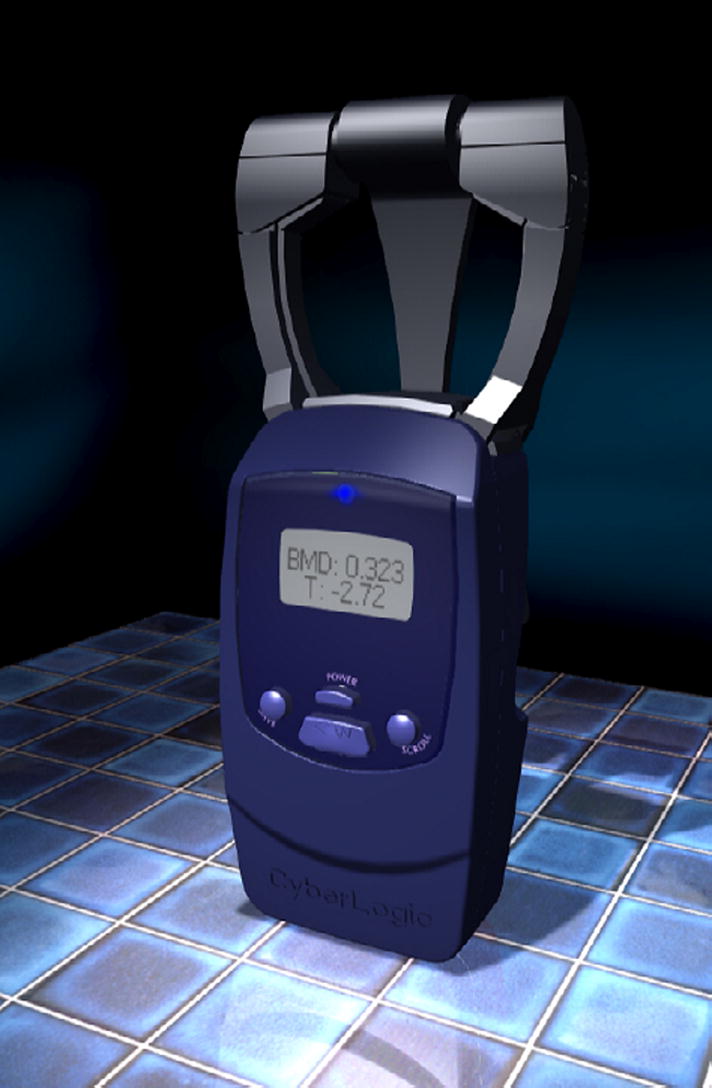
Computer rendering of the QRT® 2000 ultrasound bone assessment device. The overall height is about 23 cm, while the distance between the transducers as shown is 3.8 cm.
In operation, the source emits a broadband ultrasonic pulse at a rate of 1 kHz, the receiver waveform is sampled, and 128 of the sampled-waveforms are summed “on-the-fly” to obtain an averaged waveform. This averaged waveform is then processed to obtain an ultrasound parameter, known as the net time delay (NTD). The NTD value depends on the total amount of bone within the interrogated region, as we present below. This entire computation takes less than a second.
A clinical study was carried out using the ultrasound device. Eighty-five female adult (age eighteen and over) subjects were recruited for this study under an IRB approved protocol. Subjects were recruited from the orthopedic waiting room. Subjects were excluded only if they may have been, or were pregnant. Each subject was measured three times at the heel with the ultrasound device. Ultrasound coupling gel (Parker Laboratories, Inc., Fairfield, New Jersey, USA) was used to ensure good acoustic conduction between the transducers and skin. The three NTDs associated with the three sets of measurements were averaged. For comparison, the average ultrasound velocity (UV) of each subject was also evaluated. For each subject a bone density at the same heel was measured using DXA (PIXI, GE Medical Systems, Madison, WI, USA). Finally, an ultrasound reproducibility study was carried out on three subjects each with 15 independent measurements, and the percent coefficient of variation (%CV) was evaluated [Bonnick, 2004].
Description of Signal Processing Algorithm
The evaluation of NTD, or τnet, is obtained according to the following equation:
| (1) |
where τs and τsb are the time delays (i.e., the times for the pulse to travel from the source to the receiving transducers) of ultrasound signals that have propagated through two regions, one containing soft tissue only and the other containing both soft tissue and bone tissue, respectively. In practice there are a number of ways to measure “time delay” of a received signal, for example by selecting a particular point on the received waveform that designates “time of arrival.” However, we do not address this aspect in detail but assume that a reproducible and consistent method is used to estimate the time delays, and refer the reader to [Wear, 2000] for additional information on this important topic. It is also assumed that the overall thickness, d, of the two regions is identical.
The utility of NTD, or τnet, for estimating bone mass at a given anatomical site can be elucidated by considering the following simplified example. Consider two ultrasound transducers separated by a distance, d, consisting of a source that generates an ultrasound signal to be received by the other transducer. As shown in Fig. 5, the ultrasound wave is assumed to propagate through a two layer medium composed solely of two materials, soft tissue and “pure” bone, which have associated with them ultrasound velocities, vs and vb, respectively. The delay (transit) time, τsb, associated with an ultrasound signal propagating through this two-layer medium can be expressed analytically as
Fig. 5.

Two layered medium with source and receiver separated by a distance, d.
| (2) |
In (2), db and ds are the thicknesses of the bone and soft tissue layers, respectively. The delay (transit) time, τs, associated with an ultrasound signal propagating through a soft tissue only medium of equal thickness, d, is given by
| (3) |
Using (1)–(3), the NTD, τnet, can then be expressed as
| (4) |
Rearranging terms, the NTD can finally be expressed as
| (5) |
or in a more “practical” form, that is by expressing bone thickness, db as a function of NTD, τnet, by
| (6) |
In (5) and (6), γ is a constant dependent on the ultrasound velocities, namely
| (7) |
Equation (6) shows, at least for a simple 2 layered medium, that the thickness of the bone layer can be estimated from the NTD, assuming that the associated ultrasound velocities are known and that at least one of the total thickness, d, or the soft tissue-only delay, τs, are known. Indeed, using typical values for bone and soft tissue, i.e., vs = 1580 ms−1 and vb = 2900 ms−1, we find that γ−1 = 3471 ms−1, or in units of millimeters and microseconds, γ−1 = 3.471 mm μs−1 [Bamber, 1986]. Thus for each microsecond increase (or decrease) in the measured NTD, the amount of change in bone thickness is 3.471 mm. Since bone thickness and bone mineral density, as already noted, are proportional to one another, BMD may also be expressed as a function of NTD. As the more clinically recognized variable, it is therefore reasonable to model the relationship between BMD and τnet by the following equation:
| (8) |
In (8), BMD is a least squares ultrasound-based estimate of the “actual” BMD (measured in vitro from micro-CT or clinically with DXA), and a and b are regression parameters obtained using the method of least squares. Although in theory from (6) the intercept, b, should be zero, in practice a non-zero offset is helpful for dealing with time delay artifacts due to dispersion and other factors. It is also useful for calibrating devices with each other. In the results to be presented, BMD is the variable that will be compared with the ultrasound variables.
An additional point to note in the above is that the ultrasound waveform is assumed “sufficiently broadband” so that the time of arrival of the received waveform can be unambiguously identified even in the presence of multiple reflections, e.g., between and within layers. It should be clear that the analysis can also be extended to multiple layers of different thicknesses comprised solely of two materials having distinct velocities. In this case it can be easily shown that the NTD would be proportional to the total (summated) thickness of the bone layers. In the following section, we will show that the net time delay, perhaps somewhat surprisingly, can also be used to estimate the average bone thickness and BMD of trabecular bone as well.
Simulation and Clinical Data Results
For the computer simulations, a typical receiver measurement is shown in Fig. 6. The NTD was computed for each calcaneal trabecular bone sample. The volume fractions ranged from 0.08 to 0.25, representing highly dense bone to moderately osteoporotic “conditions.” A plot of BMD vs. NTD is shown in Fig. 7. As may be seen, the NTD is extremely highly correlated with BMD with an R-squared value of approximately 0.99.
Fig. 6.
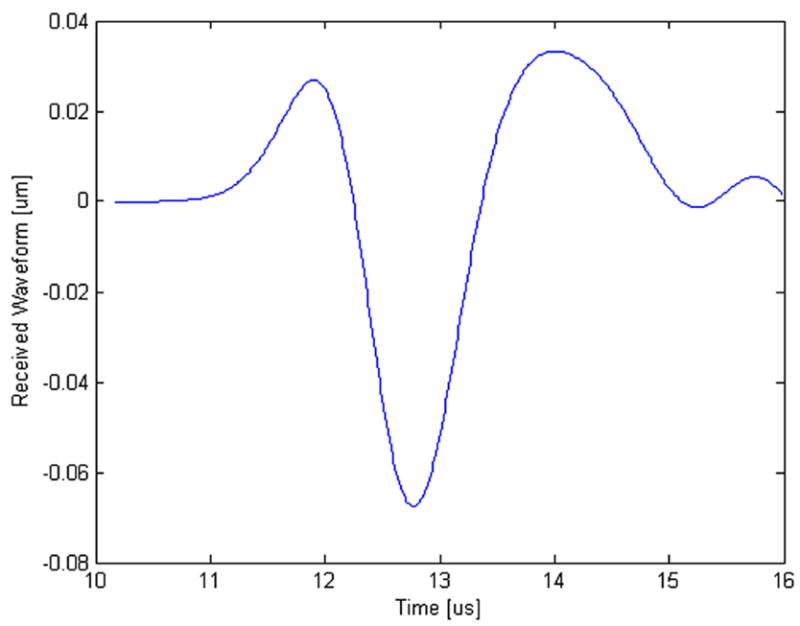
Ultrasound receiver measurement for one of the computer simulations.
Fig. 7.
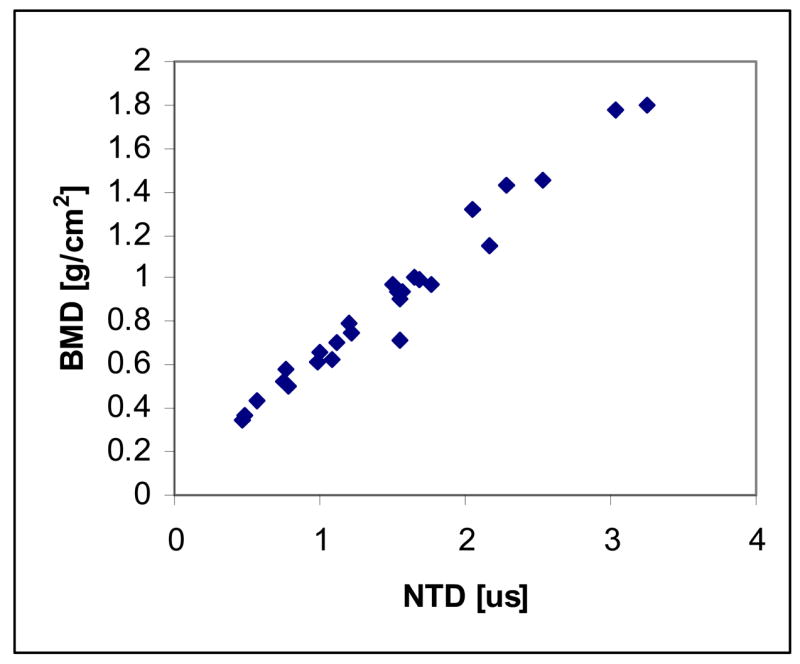
Correlation of net time delay (NTD) with bone mineral density (BMD) for the computer simulations of ultrasound propagation through the 30 samples.
Table #1 and Table #2 list the demographic and ethnic/racial data on the 85 subjects in this study. For this clinical data, plots showing the relationships of age, UV, and NTD to BMD are shown in Figs. 8a–8c, respectively. The correlations between age, UV, and NTD, to BMD were 0.37, 0.64, and 0.82, respectively. Linear univariate regressions between BMD and UV or NTD produced standard errors of 0.088 g/cm2 and 0.059 g/cm2, respectively. Including subject age in multivariate linear regressions with either NTD or UV did not significantly improve the correlations. Finally, the percent coefficient of variation in the reproducibility study was found to be 3.1%.
Table #1.
Demographic Statistics for Clinical Study Group.
| N = 85 (No. subjects) | Mean | Standard Deviation | Minimum | Maximum | Range |
|---|---|---|---|---|---|
| Age [Years] | 62 | 16 | 20 | 92 | 72 |
| Height [in.] | 63 | 2.9 | 58 | 71 | 13 |
| Weight [lb.] | 154 | 36 | 101 | 309 | 208 |
| BMD [g/cm2] | 0.47 | 0.11 | 0.21 | 0.96 | 0.75 |
Table #2.
Ethnic/Racial Makeup of Study Group.
| Ethic/Racial Makeup | Number of Subjects |
|---|---|
| White | 64 |
| African- American | 10 |
| Hispanic | 10 |
| Asian | 1 |
| Total | 85 |
Fig. 8.
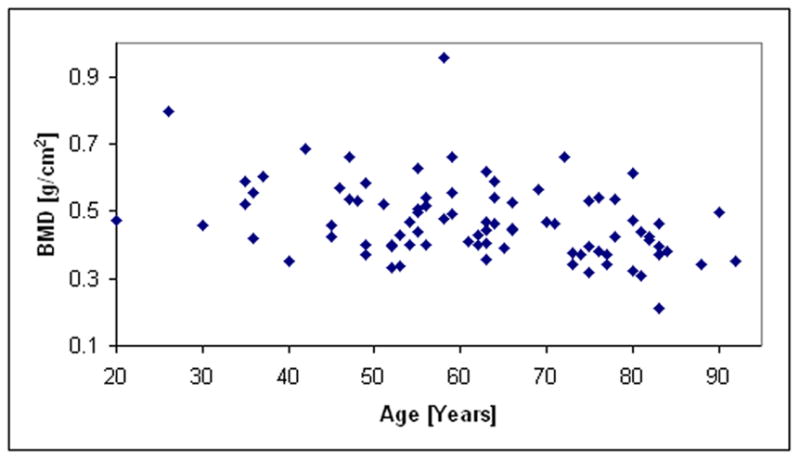
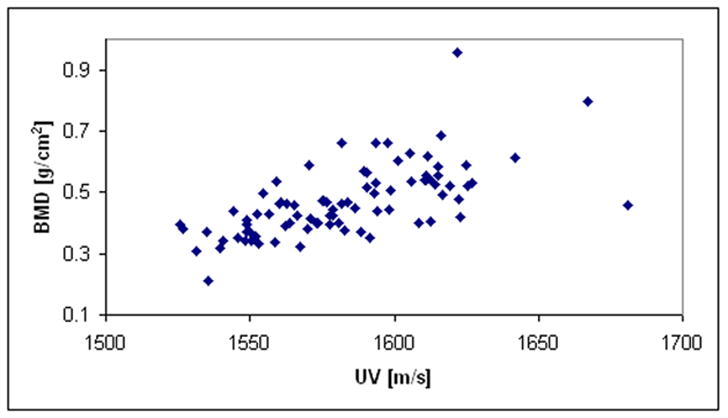
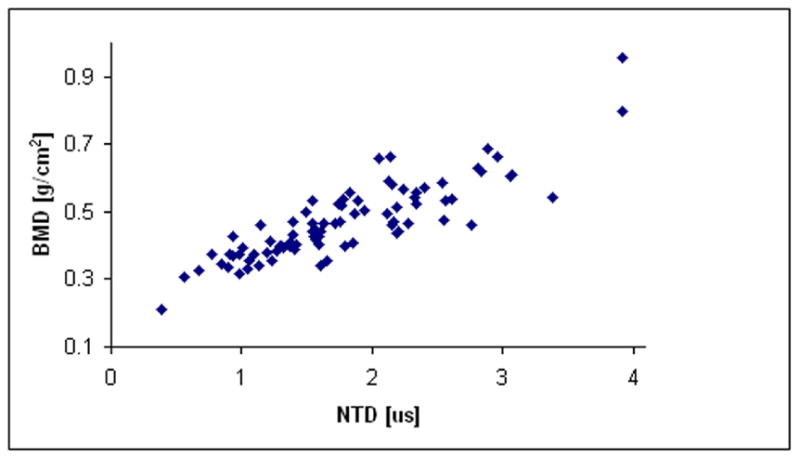
Fig. 8a. Plot of BMD vs. age for the clinical study.
Fig. 8b. Plot of BMD vs. velocity for the clinical study.
Fig. 8c. Plot of BMD vs. NTD for the clinical study.
Discussion and Conclusion
The data presented demonstrate that the new device and its associated ultrasound parameter, the NTD, is very sensitive to bone mass as measured by DXA scanners. In contrast, the data show that ultrasound velocity is much less correlated with BMD; this is a result of the variations between people in amount of overlying soft tissue thickness and in the calcaneus thickness. The correlation of NTD with BMD in the computer simulations was much higher, though, than the correlation obtained clinically. This was, we believe, due to two primary factors. The first is distance errors in the measurements of transducer separation due to shortcoming in hardware design; this has been dealt with in a subsequent revision of the device. The second is due to the lack of correspondence between the region of interest identified by the DXA scanner and the ultrasound region of interest in terms of BMD. Because the calcaneus exhibits a great deal of heterogeneity with respect to BMD, this lack of coincidence also led to a reduction in the correlation. Nevertheless, a linear regression of NTD and BMD produced a correlation of r = 0.88, which to our knowledge is higher than any other clinical correlation reported to date. For example, typical correlations reported for the calcaneus range from a minimum of r= 0.56 to r=0.80. [Langton and Langton, 2000].
The data clearly demonstrate that ultrasound is an excellent proxy for bone mass. Although motivation for using the NTD to estimate bone mass was based on an idealized parallel plate model, the fact that it also can provide estimates of bone mass in largely trabecular structures is, at first glance, somewhat unanticipated. It may be explained perhaps, by the facts that the wavelength of the received wave (~5 mm) is much larger than the size of individual trabecula (~0.1 mm). The 5 mm wavelength estimate was obtained by using a velocity of ultrasound associated with trabecular bone tissue (~2000 ms−1), and a center frequency of a received waveform after it has propagated through a calcaneus (~400 kHz). Thus the ultrasound wavefront, at least in terms of its transit time, does not “see” individual trabecula but is affected primarily by the amount of bone in its path.
Also somewhat surprising is that the use of a single pair of values for the ultrasound velocity in bone and soft tissue (through the regression coefficients) for all 85 subjects was able, nevertheless, to produce excellent results. This may be due to several factors. First we note that with respect to the soft tissue velocity, vs, a single value of 1540 m/s for all individuals and for all soft tissues has been used for decades by imaging devices with excellent results. Second, and with respect to the bone velocity, vb, differences between people (and for that matter differences between bone sites) will also be expected to affect the results. However, it should be noted that decreases in the velocity of ultrasound in bone (indicating less mineral content) would also lead to a decrease in the net time delay (and DXA values as well). Finally, it is useful to note that the best justification for using a single set of values for vs and vb is in the very good results produced.
The basic findings of these ultrasound investigations are visualized as translational research in their application to improve clinical diagnosis and treatment of weakened bone and fragility fractures as in osteoporosis. The overall goal will continue to explore to what degree the potential for ultrasound to measure other aspects of bone in particular architectural and structural features can be realized. For example, parameters related primarily to the magnitude of the acoustic transfer function relating the output ultrasound waveform to the input ultrasound waveform have been shown to be extremely sensitive not only to bone mass but also to architecture. These parameters include broadband ultrasound attenuation (BUA) and mean frequency (MF) [Luo et al., 1999; Kaufman and Einhorn, 1993; Gluer et al., 1993]. It has been shown that a fifty percent change in BUA resulted solely by changing the direction of ultrasound propagation through a trabecular bone sample from along the axis of the compressive trabeculae to an axis which was orthogonal [Gluer et al., 1993]]. Further research will be necessary to determine whether ultrasound can provide estimates of osteoporotic fracture risk superior to those already provided by bone mass alone. Two studies have already shown that ultrasound is predictive of future fractures, even when adjusted for BMD [Bauer et al., 1997; Stewart et al., 2006]. However, no studies have yet demonstrated statistical superiority of ultrasound to DXA. We are also extending the research to other anatomical sites, namely the wrist and finger, which are more practical for office monitoring than the heel.
In summary, a new device has been described that has the potential to enlarge the scope of ultrasound application in particular, and to bone screening in general. The portability, low cost, (it is anticipated that the device can be manufactured at an approximate cost of $400 US), and simplicity in use of ultrasound, combined with the lack of any ionizing radiation, provides the opportunity to expand the scope of studies on bone quality and fracture risk, and to study the natural history of bone health and disease in its application to individuals at all ages.
Acknowledgments
The kind support of the Carroll and Milton Petrie Foundation, the National Institute of Arthritis and Musculoskeletal and Skin Diseases (Grant Number 2 R44 AR45150) and the National Institute on Aging (Grant Number 1 R43 AG027722) of the National Institutes of Health, through the Small Business Innovative Research Program, and the generosity of interested donors, are all gratefully acknowledged. The funders had no role in the design and conduct of the study; collection, management, analysis, and interpretation of the data; and preparation, review, or approval of the manuscript. We would also like to acknowledge the assistance of Professor Jose Marcos Alves for the micro-CT data, and to Ms. Miriam Englander for assistance in the collection of the clinical data.
Footnotes
Publisher's Disclaimer: This is a PDF file of an unedited manuscript that has been accepted for publication. As a service to our customers we are providing this early version of the manuscript. The manuscript will undergo copyediting, typesetting, and review of the resulting proof before it is published in its final citable form. Please note that during the production process errors may be discovered which could affect the content, and all legal disclaimers that apply to the journal pertain.
References
- Anonymous. Osteoporosis prevention, diagnosis, and therapy. JAMA. 2001;285:785–95. doi: 10.1001/jama.285.6.785. [DOI] [PubMed] [Google Scholar]
- Attix FH. Introduction to Radiological Physics and Radiation Dosimetry. New York, NY: Wiley-Interscience; 1986. p. 531. [Google Scholar]
- Bamber JC. Speed of sound. In: Hill CR, editor. Physical Principles of Medical Ultrasonics. Chichester, UK: Ellis Horwood; 1986. pp. 200–224. [Google Scholar]
- Bauer DC, Gluer CC, Cauley JA, Vogt TM, Ensrud KE, Genant HK, Black DM. Broadband ultrasound attenuation predicts fractures strongly and independently of densitometry in older women. A prospective study. Study of Osteoporotic Fractures Research Group. Arch Intern Med. 1997;127:629–634. [PubMed] [Google Scholar]
- Blake GM, Fogelman I. Review - DXA scanning and its interpretation in osteoporosis. Hosp Med. 2003;64:521–5. doi: 10.12968/hosp.2003.64.9.2243. [DOI] [PubMed] [Google Scholar]
- Bonnick SL. Application and Interpretation. 2. Totowa, New Jersey: Humana Press; 2004. Bone Densitometry in Clinical Practice. [Google Scholar]
- Gluer CC, Wu CY, Genant HK. Broadband ultrasound attenuation signals depend on trabecular orientation: an in vitro study. Osteoporos Int. 1993;3:185–191. doi: 10.1007/BF01623674. [DOI] [PubMed] [Google Scholar]
- Johnell O, Kanis JA, Oden A, Johansson H, De Laet C, Delmas P, Eisman JA, Fujiwara S, Kroger H, Mellstrom D, Meunier PJ, Melton LJ, 3rd, O’Neill T, Pols H, Reeve J, Silman A, Tenenhouse A. Predictive value of BMD for hip and other fractures. J Bone Miner Res. 2005;20:1185–1194. doi: 10.1359/JBMR.050304. [DOI] [PubMed] [Google Scholar]
- Kanis J. Diagnosis of osteoporosis and assessment of fracture risk. The Lancet. 2002;359:1929–1936. doi: 10.1016/S0140-6736(02)08761-5. [DOI] [PubMed] [Google Scholar]
- Kaufman JJ, Einhorn TE. Review - Ultrasound Assessment of Bone. J Bone Miner Res. 1993;8:517–525. doi: 10.1002/jbmr.5650080502. [DOI] [PubMed] [Google Scholar]
- Kaufman JJ, Siffert RS. Non-invasive assessment of bone integrity. In: Cowin S, editor. Bone mechanics handbook. Boca Raton, FL: CRC Press; 2001. pp. 34.1–34.25. [Google Scholar]
- Langton CM, Langton DK. Comparison of bone mineral density and quantitative ultrasound of the calcaneus: site matched correlation and discrimination of axial BMD status. British Journal of Radiology. 2000;73:31–35. doi: 10.1259/bjr.73.865.10721317. [DOI] [PubMed] [Google Scholar]
- Luo G, Kaufman JJ, Chiabrera A, Bianco B, Kinney JH, Haupt D, Ryaby JT, Siffert RS. Computational methods for ultrasonic bone assessment. Ultrasound Med Biol. 1999;25:823–830. doi: 10.1016/s0301-5629(99)00026-5. [DOI] [PubMed] [Google Scholar]
- Melton LJ., III . Epidemiology of fractures. In: Riggs BL, Melton LJ III, editors. Osteoporosis: etiology, diagnosis, and management. New York, NY: Raven Press; 1988. pp. 133–154. [Google Scholar]
- Miller CW. Survival and ambulation following hip fracture. J Bone Joint Surg. 1978;60A:930–934. [PubMed] [Google Scholar]
- Serra J. Image Analysis and Mathematical Morphology Volume 1. London, England: Academic Press; 1982. [Google Scholar]
- Siffert RS, Luo GM, Cowin SC, Kaufman JJ. Dynamical relationships of trabecular bone density, architecture and strength in a computational model of osteopenia. Bone. 1996;18:197–206. doi: 10.1016/8756-3282(95)00446-7. [DOI] [PubMed] [Google Scholar]
- Siffert RS, Kaufman JJ. Ultrasonic Bone Assessment: “The Time Has Come”. Bone. 2007;40:5–8. doi: 10.1016/j.bone.2006.07.018. [DOI] [PMC free article] [PubMed] [Google Scholar]
- Stewart A, Kumar V, Reid DM. Long-term fracture prediction by DXA and QUS: a 10 year prospective study. J Bone Miner Res. 2006;21:413–418. doi: 10.1359/JBMR.051205. [DOI] [PubMed] [Google Scholar]
- Wear KA. The effects of frequency-dependent attenuation and dispersion on sound speed measurements: applications in human trabecular bone. IEEE Transactions on Ultrasonics, Ferroelectrics, and Frequency Control. 2000;47:265–273. doi: 10.1109/58.818770. [DOI] [PMC free article] [PubMed] [Google Scholar]