Abstract
Defining the mechanisms and consequences of protein adduction is crucial to understanding the toxicity of reactive electrophiles. Application of tandem mass spectrometry and data analysis algorithms enables detection and mapping of chemical adducts at the level of amino acid sequence. Nevertheless, detection of adducts does not indicate relative reactivity of different sites. Here we describe a method to measure the kinetics of competing adduction reactions at different sites on the same protein. Adducts are formed by electrophiles at Cys14 and Cys47 on the metabolic enzyme glutathione-S-transferase P1-1 and modification is accompanied by a loss of enzymatic activity. Relative quantitation of protein adducts was done by tagging N-termini of peptide digests with isotopically labeled phenyl isocyanate and tracking the ratio of light-tagged peptide adducts to heavy-tagged reference samples in liquid chromatography-tandem mass spectrometry analyses using a multiple reaction monitoring method. This approach was used to measure rate constants for adduction at both positions with two different model electrophiles, N-iodoacetyl-N-biotinylhexylenediamine and 1-biotinamido-4-(4′-[maleimidoethyl-cyclohexane]-carboxamido)butane. The results indicate that Cys47 was approximately 2–3-fold more reactive toward both electrophiles than was Cys14. This result was consistent with the relative reactivity of these electrophiles in a complex proteome system and with previously reported trends in reactivity of these sites. Kinetic analyses of protein modification reactions provide a means of evaluating the selectivity of reactive mediators of chemical toxicity.
Reactive electrophiles formed by xenobiotic metabolism and endogenous oxidative processes covalently modify proteins and these adducts are thought play critical roles both in toxicology and in the pathogenesis of chronic, degenerative diseases [1–3]. Proteomics approaches employing LC-MS-MS together with data analysis algorithms such as Sequest, SALSA and P-Mod have enabled identification of protein adducts [4–7]. MS-MS spectra not only identify the adducted proteins, but also pinpoint the amino acid residue where adduction occurs [5, 6, 8]. Recent application of liquid chromatography-tandem mass spectrometry (LC-MS-MS) proteomics methods and affinity tagged model electrophiles has revealed that protein covalent binding by electrophiles is selective and reproducible, yet highly dependent on the structure and chemistry of the electrophiles [9].
LC-MS-MS methods are also readily used in quantitation of proteins and protein adducts. Relative quantitation is done by incorporating stable isotope labels (2H, 13C, and 15N are most common) [10] into peptide sequences either metabolically [11] or by labeling with small molecule tags [12], which can bind covalently to specific amino acid residues or to peptide N- or C-termini. Our laboratory has described a method for relative quantitation using isotope-labeled phenyl isocyanate (PIC), which labels peptides at the N-terminus [13].
Selectivity of covalent binding governs the biological consequences of adduction. For example, the model electrophiles 1-biotinamido-4-(4′-[maleimidoethylcyclohexane]-carboxamido)butane (BMCC) and biotinyl-iodoacetamidyl-3,6-dioxaoctanediamine (PEO-IAB) both covalently adducted all three subunits of protein phosphatase 2A (PP2A), but only BMCC inhibited PP2A catalytic activity [14]. The inhibition was specifically mapped to adduction of two cysteine residues in the catalytic subunit. Similarly, the model electrophile N-iodoacetyl-N-biotinylhexylenediamine (IAB) and BMCC both adducted the electrophile sensor protein Keap1, but LC-MS-MS analyses revealed different patterns of adduction, which correlated with differential effects on stabilization of the transcription factor Nrf2 and activation of genes regulated by the antioxidant response element (ARE) [15].
A major problem in the analysis of protein adduction is that multiple sites on the same protein could be susceptible to adduction by electrophilic species. Which sites have the highest reactivity? We have adapted a stable isotope tagging method employing N-terminal labeling of peptides with PIC and selective quantiation of the adducted, PIC-labeled peptides by LC-MS-MS. This approach allows the simultaneous measurement of kinetic constants for multiple competing adduction reactions in the same protein. We have used this approach to study the covalent adduction of glutathione-S-transferase P1-1, (GSTP1-1), which has been the subject of previous investigations into the reactivity of cysteine residues and the effects of cysteine modification on GSTP1-1 function [16–19]. This system allowed us to compare the results of kinetic analyses to previously reported structure/function data. Our approach to measuring kinetic reactivity in covalent adduction will be useful for understanding the selectivity and biological consequences of protein modifications involved in chemical toxicity and disease.
EXPERIMENTAL PROCEDURES
Purification and characterization of His6-GSTP1-1 in vitro
Recombinant His6-GSTP1-1 was expressed and purified from E. coli strain BL21(DE3) (Novagen, Madison, WI). Cells were transformed with pET-His6-GSTP1-1-15b plasmid generously provided by Dr. Judy Bolton at the University of Illinois at Chicago and expressed as described previously [20]. Expressed protein was purified by immobilized metal affinity chromatography (IMAC) on His-select Nickel coated 96-well plates (Sigma, St. Louis, MO) using the manufacturer’s protocol. Final protein concentration was determined using a BCA assay kit (Pierce, Rockford, IL). His6-GSTP1-1 was identified by SDS-PAGE and Western blot techniques, using antibodies for glutathione-S-transferase (DAKO, Carpinteria, CA) and the His6-tag (Quiagen, Valencia, CA).
Following elution from Ni2+-coated 96-well plates, proteins were subjected to SDS-PAGE on NuPAGE® Novex Bis-Tris Gels (Invitrogen, Carlsbad, CA). Bands corresponding to His6-GSTP1-1 were excised, and the proteins were reduced, alkylated and digested with trypsin as described previously [21]. Peptides were re-suspended in 0.1% trifluoroacetic acid for analysis by liquid chromatography-tandem mass spectrometry (LC-MS-MS). Protein digests were also carried out in the Ni+2-coated plates. For in-plate digestions, 30 μL of a digest buffer containing 0.1 M ammonium bicarbonate (Sigma), 4 mM tris-carboxyethyl phosphine (TCEP, Pierce, Rockford, IL), and 10mM dithiothreitol (DTT; Sigma, St. Louis, MO) was added to each well and incubated for 30 min at 50° C. Then 5 μL of 200 mM iodoacetamide (IAM) (Sigma, St. Louis, MO) was then added to the samples and incubated for 15 min at room temperature. For tryptic digestions prior to PIC-labeling (see below), DTT was omitted. Trypsin Gold (Promega, Madison, WI) or chymotrypsin (Sigma, St. Louis, MO) was then added in a 1:50 w/w ratio and samples were incubated for 18–24 hours at 37° C. Following digestion, samples were analyzed by LC-MS-MS. Protein identification was done from MS-MS data using the Sequest algorithm [22] with filtering of matches based on criteria described previously [23].
Glutathione-S-transferase activity was determined as previously described [17, 24]. The assay was carried out in the 96-well plates by adding to each well 230 μL of assay buffer containing 0.2 M potassium phosphate, pH 6.5, 0.2 mM EDTA, and 5 mM GSH. After incubation at room temperature for 2 min, 1-chloro-2,4-dinitrobenzene (CDNB) was added to a final concentration of 1 mM and absorbance was monitored at 340 nm on a Dynex (Worthing, West Sussex, UK) 96-well plate reader over a five minute time course. GST activity assays with the immobilized protein on 96-well plates indicated GSTP1-1 activities of 0.464mmol mg−1 min−1 for conjugation of CDNB with GSH. Reaction rates in the absence of GSH were less than 5% of that for reactions with enzyme without electrophile treatment.
Adduction of GSTP with electrophiles
To study kinetics of electrophile adduction, immobilized GST proteins were incubated with electrophilic compounds in phosphate buffered saline (PBS) solution pH 7.2 at 37° C. Electrophiles used for these experiments included IAB and BMCC (Scheme 1) (Pierce, Rockford, IL) prepared in 0.1% DMSO. Each well on the 96-well plate corresponded to one replicate of a time point. Reactions were stopped by removing the solution from assigned wells and washing the well quickly with 250 μL PBS. Incubations with IAB were carried out in the dark. MS-MS spectra of adducted peptides were identified by analysis with Sequest (with IAB and BMCC adducts specified as variable modifications on cysteines) and P-Mod [25].
PIC-labeling of tryptic peptides
PIC-labeling of peptide N-termini was carried out as described previously [13] with slight modifications. Digested samples for each time point were pooled and reacted with either 12C6- PIC or a heavy isotope labeled (13C6-PIC or 2H5-PIC) (Isotec, St. Louis, MO) at a PIC concentration of 10 mM (from 0.1 M PIC stocks prepared in acetonitrile) at pH 8.0. For kinetic analyses, samples from the longest incubation time, representing maximum adduction (tmax), were labeled with the heavy PIC, while all other samples (t0,1,2…tmax) were labeled with the light PIC. After addition of PIC, each sample was mixed for 5 sec and then allowed to stand for at least 30 sec at room temperature. Reaction was stopped by addition of concentrated formic acid to 1% (v/v). Aliquots of each time point (labeled with light PIC) were mixed with an equivalent aliquot of the tmax (heavy PIC-labeled) sample prior to LC-MS-MS or matrix assisted laser desorption-time of flight (MALDI-TOF) MS analysis.
MALDI-TOF-MS and LC-MS-MS analysis
MALDI-TOF-MS analysis was done on a Voyager 4700 instrument (Applied Biosystems, Foster City, CA). Samples were evaporated to near-dryness and resuspended in 60% acetonitrile containing 0.1% TFA. A 0.3 μL aliquot of sample was spotted on a MALDI sample target and mixed with a 0.3 μL aliquot of α-cyano-4-hydroxycinnamic acid (CHCA; Sigma, St. Louis, MO) matrix solution, consisting of 30 mM CHCA and 4 mM ammonium citrate (Fluka, St. Louis, MO) in 60% acetonitrile containing 0.1% TFA and allowed to dry prior to analysis. Peptide spectra were acquired and processed in reflector positive mode for MS with laser settings being varied between 5100 and 6500. Spectral analysis was done with Data Explorer software.
LC-MS-MS analysis was done on a Thermo LTQ linear ion trap instrument equipped with a Thermo Surveyor high performance liquid chromatography (HPLC) pump and microelectrospray source and operated with Thermo Xcalibur software, version 1.4 (Thermo Electron, San Jose, CA). Peptides were resolved with an 11 cm, 100 μm ID, Monitor C18 (Column Engineering, Ontario, CA) microcapillary column with a 5–15 μm tip opening. The flow rate from the HPLC pump was adjusted to achieve 750 nL min−1. The gradient rose to 5% acetonitrile after 3 min, which increased to 50% at 36 min, 80% at 38 min, then to 90% at 40 min before decreasing to 1% at 44 min. The total analysis time for this method was 50 minutes.
Selective quantitation of PIC-labeled peptides was done by targeted MS-MS of m/z values corresponding to light and heavy PIC-labeled Cys14 adducts (CBMCC/IABAALR) and Cys47 adducts (ASCBMCC/IABLYGQLPK) in both doubly and triply charged forms. Thus, 4 different precursor ions were analyzed for each peptide adduct studied. LC-MS-MS quantitation was done by integrating selected ion chromatogram peak areas with Thermo Xcalibur software. Chromatograms were generated for each peptide form by plotting the sum of ion currents for the three most abundant product ions from each of the selected precursors. For example, to generate chromatograms for the light PIC-labeled form of the IAB modified Cys47 peptide, ion current for the b8+ (m/z 1337.6), b7+ (m/z 1224.5), and b5+ (m/z 1039.3) were summed and plotted, these being consistently the most intense product ions from MS-MS fragmentation of the doubly charged precursor ion at m/z 790.9. For the corresponding heavy PIC-labeled peptide (m/z 794.0), the sum of the ion currents for the b8+ (m/z 1343.7), b7+ (m/z 1230.5), and b5+ (m/z 1045.3) were plotted and integrated. The integrated peak areas then were used to generate a light:heavy ratio for the target peptide. This analysis was done for each peptide adduct at each time point in the analysis. Relative quantitation of adduct formation at each time point was done by determining ratios of light:heavy PIC-labeled peptides. Kinetic curves were generated by plotting of light:heavy ratios against time and rate constants (kobs.) were calculated by fitting the data to a one-phase exponential association with Prism 4.02 software for windows (Graph Pad, San Diego, CA).
RESULTS
Inhibition of GSTP1-1 activity and adduction of GSTP1-1 protein by BMCC and IAB
For studies of the reaction of the kinetics of electrophile adduction with GSTP1-1, we employed the biotinylated probes IAB and BMCC (Figure 1), which display electrophile chemistries commonly observed in reactive metabolites. IAB displays SN2 electrophilic chemistry analogous to toxicologically relevant electrophiles, such as aliphatic epoxides, alkyl halides and episulfonium ions. BMCC reacts with cysteine thiols by a Michael addition mechanism, which is typical of quinones and α,β -unsaturated carbonyls, including many lipid peroxidation products [26, 27]. Together, these two compounds mimic the reaction chemistry of many toxicologically relevent electrophiles.
Figure 1.
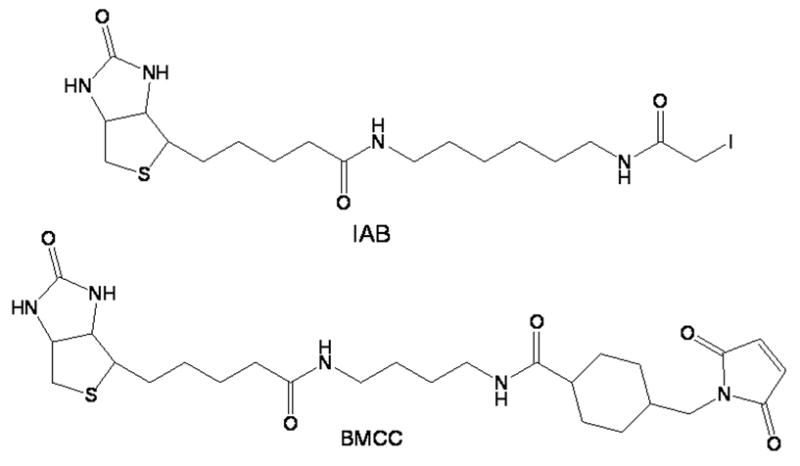
Structures of IAB and BMCC.
Treatment of immobilized GSTP1-1 with BMCC over a two hour time course resulted in an inhibition of enzymatic activity toward CDNB that was time dependent at each concentration studied (Figure 2). BMCC concentrations from 8–25 μM eliminated activity after two hours, whereas 4 μM BMCC reduced activity to 40% of control (not shown).
Figure 2.
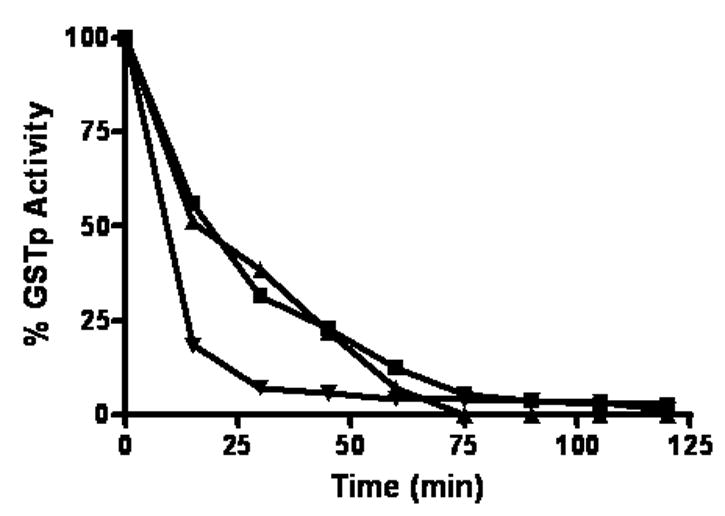
Time and concentration-dependent inhibition of GSTP1-1enzymatic activity following treatment with 8 (■), 16 (▲), and 25μM (▼) BMCC.
LC-MS-MS analysis of His6-GSTP1-1 following reaction with BMCC or IAB identified adducts on Cys14 and Cys47. The MS-MS spectra for the adducted tryptic peptides C14AALR and ASC47LYGQLPK exhibited b- and y-ion signals consistent with alkylation of cysteine by either BMCC (+533 amu) or IAB (+382 amu) (not shown). We did not observe adducts to Cys101, which is a tryptic dipeptide (sequence C101K). The reactivity of this residue toward electrophiles has been established previously [16, 17] and these adducts probably are formed with IAB and BMCC, but would have been relatively low molecular weight species with limited diagnostic fragmentation. These adducts were not pursued further.
Analysis of kinetics of adduction at Cys14 and Cys47 of GSTP1-1 by MALDI-TOF-MS
We initially explored the application of MALDI-MS to analyze PIC-labeled peptide adducts because of the relative simplicity and speed of this analytical platform. Samples from reaction of GSTP1-1 with 12.5, 16, 20, and 25 μM BMCC were taken over a two hour time course, digested with trypsin and derivatized with light or heavy (2H5) PIC as described under Experimental Procedures. The 120 min sample was labeled with the heavy PIC, whereas samples taken at the other time points were labeled with the light PIC. Each light-PIC labeled sample was combined with an equimolar portion of the heavy-PIC-labeled digest and the mixed samples then were subjected to MALDI-MS (Figure 3). A peak at m/z 1190.7 corresponds to the Cys14 tryptic peptide BMCC adduct with 2H5-PIC at the N-terminus. Analysis of samples from each time point indicated a peak at m/z 1185.7, which corresponds to the same peptide labeled with light PIC. Peak area ratios of light:heavy labeled peptides were calculated for each time point and plotted against time for a reaction with 12.5 and 25 μM BMCC. This ratio increased over the time course, but failed to display saturation kinetics appropriate to the pseudo-first order adduction reaction. The increase in light:heavy ratio should have asymptotically approached unity, but the plot appeared instead to be nearly linear (Figure 4). This may reflect interference by species other than the target peptides, which may have contributed to the measured signal. Attempts to perform this analysis with the Cys47 adduct were unsuccessful because the adducted, PIC-labeled peptide did not ionize under the analysis conditions used and was not observed in any of the spectra. For these reasons, the use of MALDI-MS analysis was not pursued further.
Figure 3.
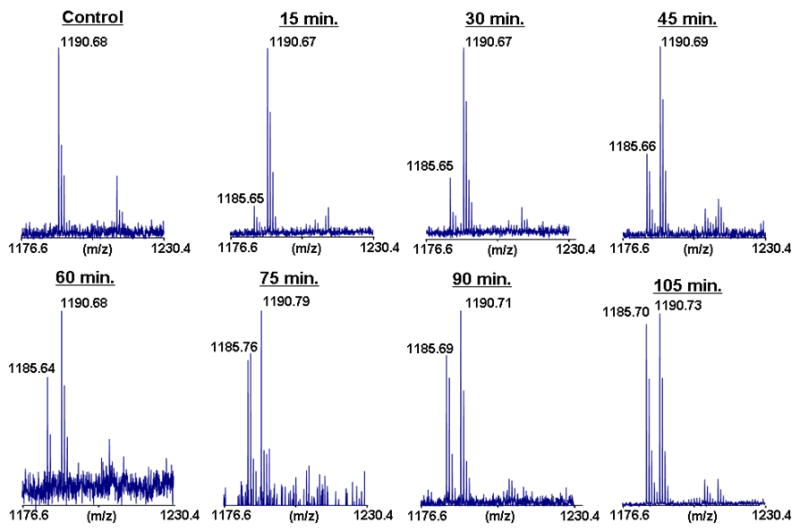
MALDI-TOF analysis of BMCC adduction at Cys14 of GSTP1-1. The spectra show the increasing formation of the d0-PIC-labeled peptide (m/z 1185.7) with time compared to the reference d5-PIC-labeled peptide (m/z 1190.7).
Figure 4.
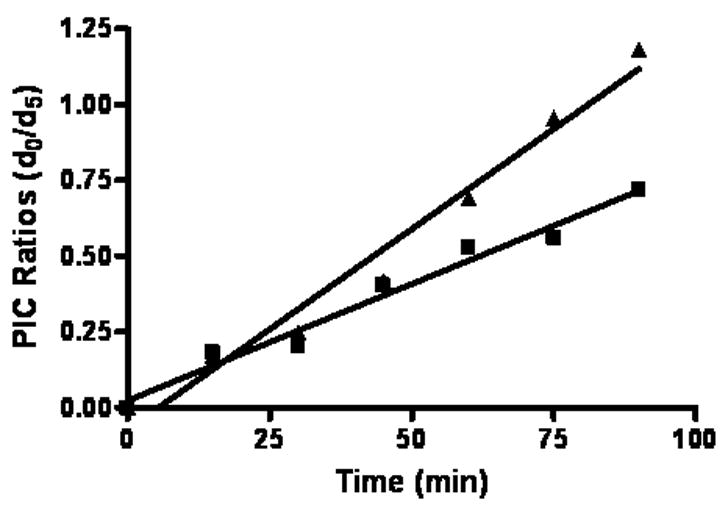
Plots of MALDI-TOF signal ratios for the BMCC-adducted, Cys14 GSTP1-1 tryptic peptide CAALR at 12.5 (■) and 25μM (▲) BMCC. The increase in the light:heavy ratio for the PIC-labeled adducts was approximately linear at both BMCC concentrations and failed to display saturation at a light:heavy ratio of 1:1 expected for a pseudo-first order adduction reaction.
Analysis of kinetics of adduction at Cys14 and Cys47 of GSTP1-1 by LC-MS-MS
To better analyze the kinetics of GSTP1-1 adduction at Cys14 and Cys47 simultaneously, LC-MS-MS analysis was used. Both the Cys14 and Cys47 peptide adducts ionize well in electrospray and are easily detected. A complication of stable isotope tagging strategies employing LC-MS-MS analyses is the partial chromatographic resolution of deuterated isotopomers from the unlabeled derivatives [13, 28], which complicates quantitation of the light and heavy forms. For this reason, we used 13C6-PIC as the heavy isotope label for LC-MS-MS studies.
The simplest approach to adduct quantitation is to detect the ions corresponding to the intact, PIC-labeled peptide adducts by SIM. A sample of IAB-adducted GSTP1-1 was digested and analyzed by LC-MS-MS with SIM of the precursor peptides at m/z 527.7 and 529.7, which correspond to the doubly charged ions of the light and heavy PIC-labeled Cys14 adducts, respectively. Similarly, SIM of m/z 791.0 and 794.0 detects the doubly charged ions of the light or heavy PIC-labeled Cys47 adducts. Figure 5 depicts signals detected by SIM of the precursor ion at m/z 794.0 with a signal to noise ratio of 11. A disadvantage of this mode of analysis is that other species of similar m/z that co-elute with the target peptide will bias quantitation.
Figure 5.
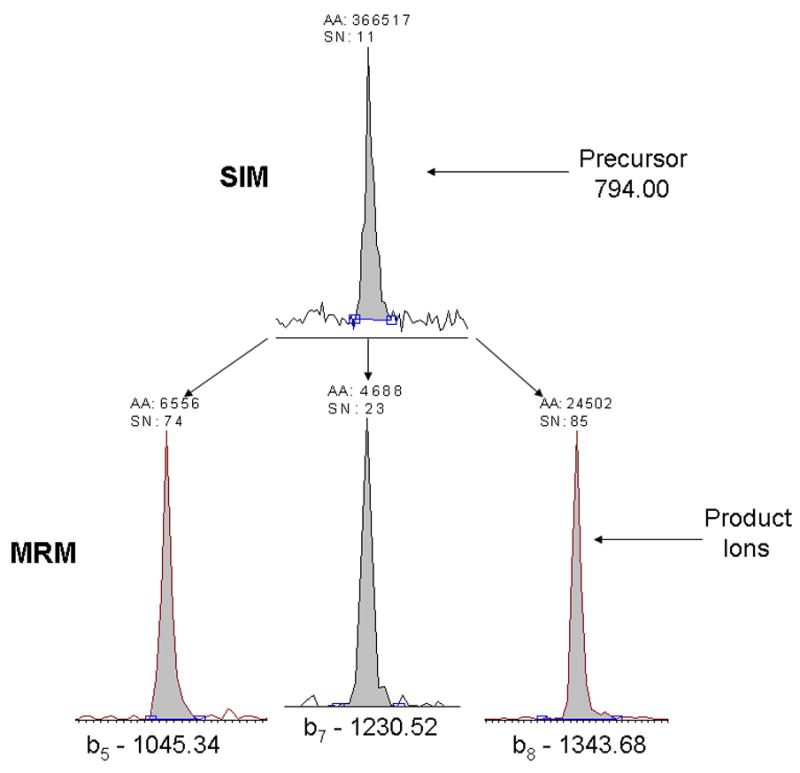
Comparison of signal-to-noise for SIM and MRM analyses of the 13C6-PIC-ASC47(BMCC)LYGQLPK adduct. The upper trace depicts SIM of the precursor ion. The lower traces depict MRM for the b8+ (m/z 1337.6), b7+ (m/z 1224.5), and b5+ (m/z 1039.3) product ions used for quantitation.
More sensitive, specific peptide quantitation can be achieved using multiple reaction monitoring (MRM), which acquires signals from specific product ions resulting from fragmentation of a selected precursor [29]. This approach generally improves signal to noise ratio for quantitative analyses. Accordingly, we also performed LC-MS-MS analyses of the same sample by targeting the doubly-charged precursor ions corresponding to the light and heavy PIC-labeled Cys14 and Cys47 adducts. In these analyses, the only MS scans acquired were the MS-MS spectra of these selected precursor ions. We then plotted the combined ion current for the three most abundant product ions in each spectrum. The m/z values of the precursors and the corresponding product ions used for quantitation are listed in Table 1 and a MS-MS spectrum of C47 peptide adducted with IAB showing these product ions is also shown (Figure 6). Comparison of the SIM and MRM approaches indicates an increase in signal to noise of up to 6-fold (Figure 5). We used the MRM approach for analyses of PIC-labeled Cys14 and Cys47 peptide adducts for all of the kinetic studies.
Table 1.
m/z values of all precursors and corresponding product ions used in SIM and SRM quantitation analysis.
| Cys-14 Adducts (m/z) | Cys-47 Adducts (m/z) | |||||||
|---|---|---|---|---|---|---|---|---|
| PIC | 13C6-PIC | PIC | 13C6-PIC | |||||
| Precursor | Product | Precursor | Product | Precursor | Product | Precursor | Product | |
| 593.24 | 827.04 | 526.27 | 833.09 | 866.55 | 1190.45 | 869.58 | 1196.50 | |
| BMCC | 898.12 | 904.17 | 1375.64 | 1381.68 | ||||
| adducts | 1011.28 | 1017.32 | 1488.79 | 1494.84 | ||||
| 517.66 | 604.80 | 520.67 | 610.84 | 790.97 | 1039.29 | 793.99 | 1045.34 | |
| IAB | 746.95 | 753.00 | 1224.47 | 1230.52 | ||||
| adducts | 860.11 | 866.16 | 1337.63 | 1343.68 | ||||
Figure 6.
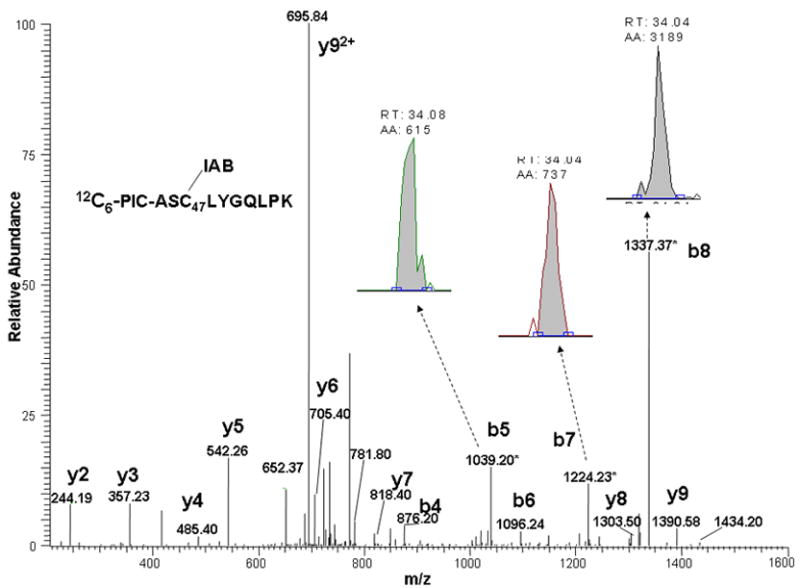
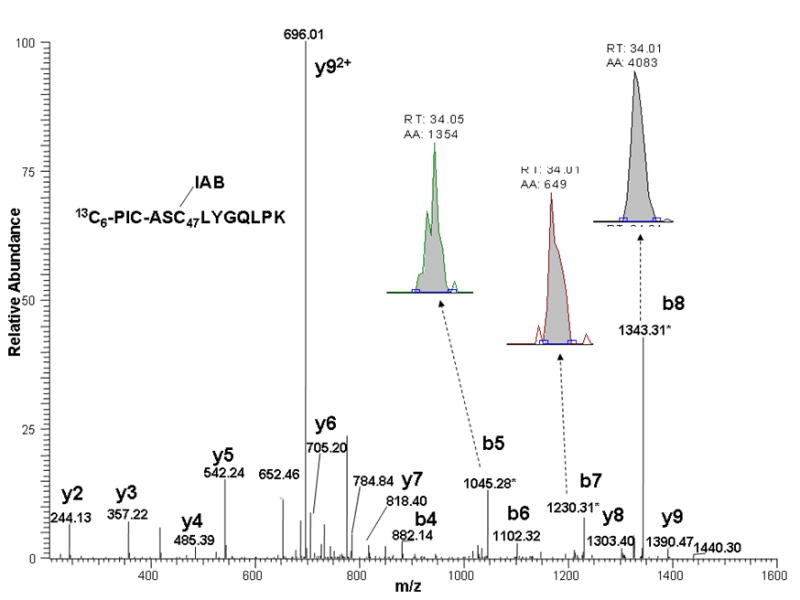
MS-MS spectra of ASC47(IAB)LYGQLPK peptide adducts from GSTP1-1 adducted with IAB and labeled with either 12C6-PIC (top), or 13C6-PIC (bottom). Spectra show b- and y-ions and those product ion peaks chosen for quantitation.
GSTP1-1 was incubated with several different concentrations of IAB or BMCC for either an eight or five hour time course respectively. Tryptic peptides from treated samples then were PIC-labeled and analyzed by MRM LC-MS-MS as described above. Chromatographic peaks corresponding to the light and heavy PIC-labeled adducts were generated from selected product ions by MRM and ratios of peak areas for light and heavy forms were plotted against reaction time.
Plots of light:heavy peptide adduct ratios vs. time were fitted to first-order rate equations with Prism software for treatments of GSTP1-1 with both IAB (Figure 7) and BMCC (Figure 8). Data were plotted to a one-phase exponential association equation, Y = Ymax · (1-e−k·X), which yielded the observed rate constant (kobs) for each electrophile concentration. In these experiments, [electrophile]⋙ [GSTP1-1] and thus k is a pseudo-first order rate constant. Measurements of kobs were made at several concentrations of electrophile. The value of the pseudo-first order rate constant k was obtained from the slope of plots of kobs against electrophile concentration for both IAB (Figure 7) and BMCC (Figure 8).
Figure 7.
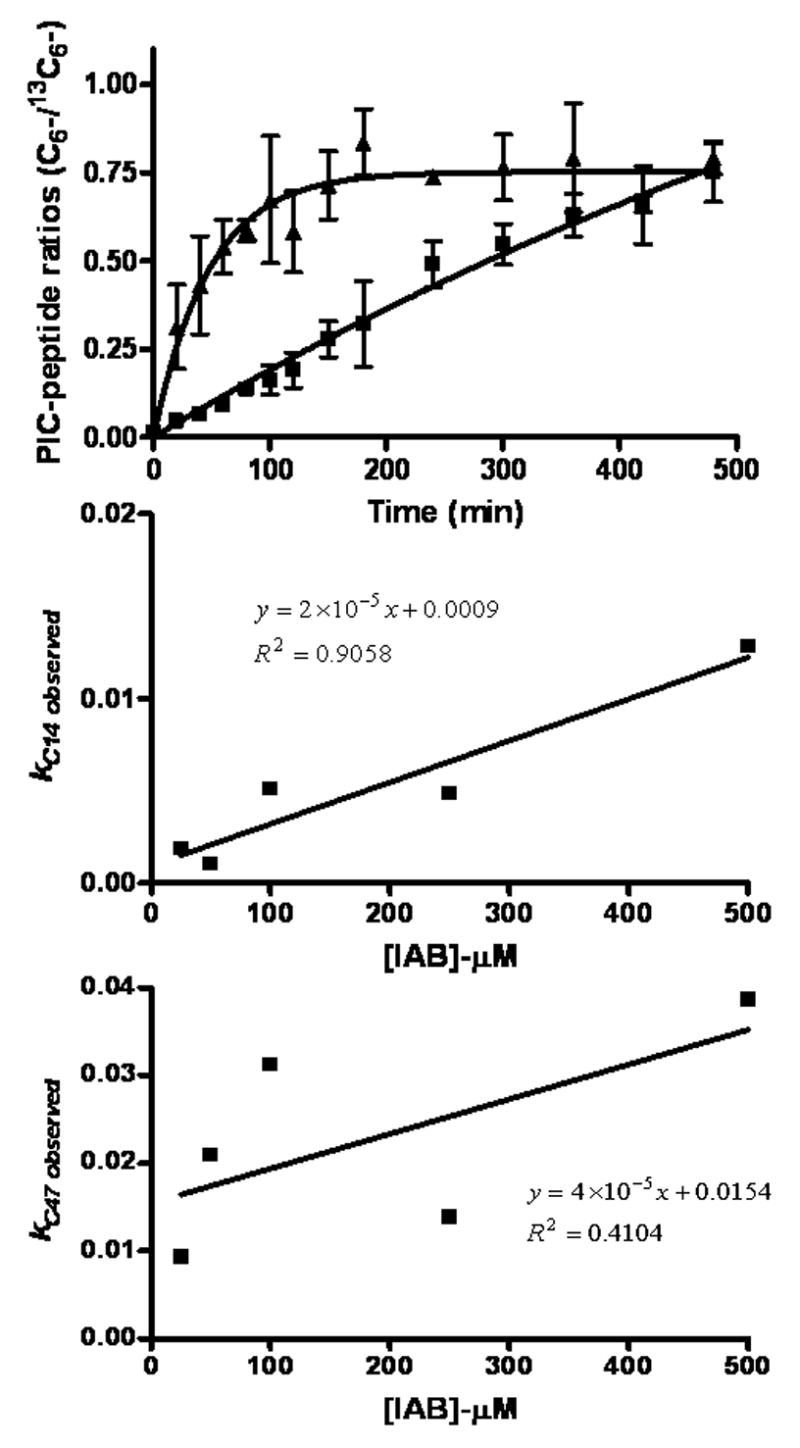
Kinetics of formation of adducts on Cys14 (■) and Cys47 (▲) of GSTP1-1 during treatment with 50 μM IAB. Ratios of 12C6-/13C6-PIC-labeled peptide adducts approached unity over time. Values of k obs were plotted against [IAB] to derive pseudo-first order rate constants (k) from resulting slopes of these plots for alkylation of GSTP1-1 at Cys14 (2 x 10⁻⁵ min−1) and at Cys47 (4 x 10⁻⁵ min−1).
Figure 8.
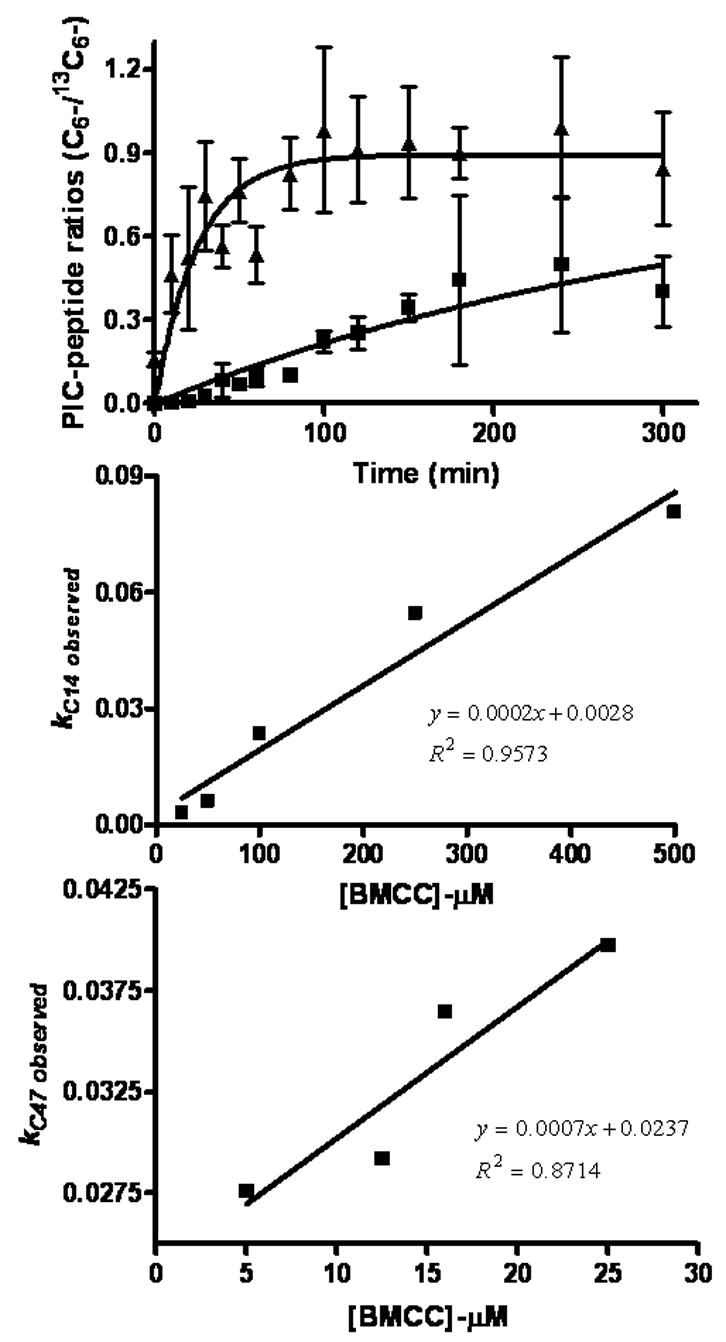
Kinetics of formation of adducts on Cys14 (■) and Cys47 (▲) of GSTP1-1 during treatment with 25 μM BMCC. Ratios of 12C6-/13C6-PIC-labeled peptide adducts approached unity over time. Values of k obs were plotted against [BMCC] to derive pseudo-first order rate constants (k) from resulting slopes of these plots for alkylation of GSTP1-1 at Cys14 (2 x 10⁻⁴ min−1) and at Cys47 (7 x 10⁻⁴ min−1).
These analyses indicated a significant difference between the k values measured for adduction of Cys14 and Cys47 and for the relative reactivity of the two electrophiles. The k values measured at both Cys14 (2 x 10⁻⁴ min−1) and Cys47 (7 x 10⁻⁴ min−1) for BMCC exceeded those measured for IAB by at least 10-fold at Cys14 ( 2 x 10⁻⁵ min−1) and Cys47 (4 x 10⁻⁵ min−1), respectively. For both IAB and BMCC, k values for adduction at Cys47 were approximately 2–3 times that for adduction at Cys14. This suggests that, regardless of other competing reactions of the electrophiles, Cys47 adducts will be formed at levels approximately 2–3-fold higher than Cys14 adducts. Complete lists of kobs values are shown in Table 2.
Table 2.
Values of observed reaction rate constants (kobs) for adduction of GSTP1-1 by IAB and BMCC1.
| Cys14 | Cys47 | Cys14 | Cys47 | |||
|---|---|---|---|---|---|---|
| [BMCC] μM | kobs (min−1) | [BMCC] μM | kobs (min−1) | [IAB] μM | kobs (min−1) | kobs (min−1) |
| 25 | 0.003 ± 0.002 | 5 | 0.028 ± 0.004 | 25 | 0.002 ± 0.001 | 0.009 ± 0.002 |
| 50 | 0.006 ± 0.002 | 12.5 | 0.030 ± 0.006 | 50 | 0.001 ± 0.001 | 0.021 ± 0.003 |
| 100 | 0.023 ± 0.007 | 16 | 0.036 ± 0.008 | 100 | 0.005 ± 0.001 | 0.031 ± 0.011 |
| 250 | 0.055 ± 0.010 | 25 | 0.040 ± 0.008 | 250 | 0.005 ± 0.001 | 0.014 ± 0.002 |
| 500 | 0.081 ± 0.016 | 500 | 0.012 ±0.002 | 0.039 ± 0.024 |
Analyses were done by LC-MS-MS as described under “Experimental Procedures”.
DISCUSSION
The analysis of protein posttranslational modifications and xenobiotic adducts is essential to understanding the effects of toxicants on proteins and proteomes. Proteomics approaches to analyze modifications to date have identified modification sites, but have not addressed the kinetics of modifications. Protein damage by reactive electrophiles is a dynamic process that reflects rates of generation of electrophiles, rates of competing reactions with targets, rates of adduct decomposition and rates of turnover of adducted proteins. To address this problem, we have adapted a stable isotope tagging approach that we introduced for relative quantitation of protein adducts [13]. In contrast to the thiol-reactive isotope-coded affinity tag (ICAT) reagents [12], PIC can label peptides and peptide adducts regardless of their amino acid composition. Because the tagging reagent PIC reacts with peptide N-termini, essentially any peptide can be analyzed in light and heavy PIC-labeled forms. Our approach to kinetic analyses employs comparative quantitation of heavy and light PIC-labeled forms over time, which makes absolute quantitation of the adducts unnecessary. We have used this approach to analyze the relative reactivities of two electrophile target sites in GSTP1-1. The measured rate constants reflect the observed reactivity of the protein toward similar electrophiles in a complex proteome mixture.
Our results clearly show the differences in reactivity of two model electrophiles. The N-alkylmaleimide BMCC was at least 10-fold more reactive than the alkyl iodide IAB at both Cys14 and Cys47 of GSTP1-1. This suggests that measurements of adduction kinetics for model compounds on selected proteins could prove useful in predicting and comparing relative reactivities of known toxicants. For example, Michael acceptor compounds could be compared with SN2 alkylators, would include alkyl halides, aliphatic epoxides, and episulfonium ions. It is important to point out our experiment involved a relative comparison of a maleimide group with a primary alkyl halide and did not take into account critical factors such as steric effects. In fact, the structures of the two compounds used in this study (Scheme 1) differ not only in the electrophile moiety, but also in the linker structure. The cyclohexyl ring in the linker makes the BMCC molecule somwhat more bulky, rigid and hydrophobic than to IAB. These factors should be considered in interpreting reactivities based on alkylation kinetics.
Our kinetic data clearly indicate that Cys47 is the more reactive of the two alkylation sites we observed. This supports previous work on the structure of GSTP1-1 showing Cys47 to be solvent accessible, thus allowing it to be highly reactive toward alkylating agents [18]. Additional studies have shown an additional influence on the reactivity of Cys47 to be its interaction with Lys-54, which is positioned in such a way to facilitate deprotonation of the thiol group of Cys47 [30,31]. This interaction results in a shift in the pKa value of C47 from 9.5 to 4.2, so at physiological pH, Cys47 exists as a thiolate ion (R—S−) stabilized by the interaction with Lys-54 and accounts for its higher reactivity compared with the other cysteine residues of GSTP1-1. Using the PROPKA web interface software (http://propka.chem.uiowa.edu/), the pKa of Cys14 was estimated to be 10.22, while pKa values for C101 and C169 were estimated to be 12.69 and 9.10 respectively [32]. Similar values were also obtained with the PDB2PQR feature with the web software[33].
We have identified adducts on two of four Cysteine residues of GSTP1-1 and shown that alkylation of these residues inhibits its enzymatic activity. Cys47 is located near the glutathione binding site and alkylation of this residue inhibits activity by lowering the enzyme’s affinity to bind glutathione [18]. It is unclear weather the alkylation of Cys14 has any effect on this inhibition or if it is simply alkylated as a result of a conformational change following Cys47 adduction. Other studies with mutant Cys-Ser enzymes have suggested that alkylation of Cys101 and Cys169 could affect enzyme function, as Cys101 is thought to play a role in GSTP1-1 homodimerization [17,19]. These adducts were not observed in our LC-MS-MS analyses.
Our data provide interesting comparison to previous work that has examined the reactivity of GSTP1-1 cysteines with electrophiles. Previous studies estimated reactivity of Cys14 and Cys47 by comparing sensitivity of mutant enzymes to inactivation by electrophiles [17,19] and through detection of Cys47 and Cys101 peptide adducts following treatment with quinones to form GSTP1-1 monoadducts [16]. Our kinetic measurements provide quantitative measures of site-specific reactivity that are consistent with those observations, although our analyses did not extend to adduction at Cys101.
We recently have reported a proteome-scale inventory of targets of BMCC and the IAB analog (+)-biotinyl-iodoacetamidyl-3, 6-dioxaoctanediamine and found that GSTP1-1 was alkylated in cytoplasmic proteome mixtures [9]. However, the only adduct detected was at Cys47. One interpretation of this result is that multiple alkylation reactions will only be observed if the rate constants differ by less than 3-fold. It is also possible that interaction of GSTP1-1 with another protein masked the Cys14 site and prevented alkylation. Thus, the order of rate constants for alkylation of a purified protein in vitro may not necessarily predict the sites of alkylation observed in vivo.
Our study describes a method that can simultaneously compare the kinetics of competing protein adduction reactions using quantitative mass spectrometry. This is an extension of a quantitative analysis approach employing PIC labeling we described previously [13]. LC-MS-MS with MRM provides selective and specific quantitation of the modified peptides of interest. Although MALDI-MS analysis of adducted peptides could, in principle, provide a fast, convenient method to acquire kinetic data our results indicate that the Cys47 adducts were not detected and the signals for the Cys14 adducts failed to accurately represent the saturation kinetics expected for the adduction reaction and which were observed by LC-MS-MS. Our results indicate that MALDI-MS is poorly suited to the quantitative analysis of peptide adducts by stable isotope labeling.
Acknowledgments
We thank Dr. Judy L. Bolton from the University of Illinois at Chicago for providing His-tagged GSTP1-1 expression vector. This research was supported by NIH Grants ES010056, ES06694 and ES07091.
Footnotes
Publisher's Disclaimer: This is a PDF file of an unedited manuscript that has been accepted for publication. As a service to our customers we are providing this early version of the manuscript. The manuscript will undergo copyediting, typesetting, and review of the resulting proof before it is published in its final citable form. Please note that during the production process errors may be discovered which could affect the content, and all legal disclaimers that apply to the journal pertain.
References
- 1.Liebler C, Guengerich FP. Elucidating mechanisms of drug-induced toxicity. Nat Rev Drug Discov. 2005;4:410. doi: 10.1038/nrd1720. [DOI] [PubMed] [Google Scholar]
- 2.Evans C, Watt AP, Nicoll-Griffith DA, Baillie TA. Drug-protein adducts: an industry perspective on minimizing the potential for drug bioactivation in drug discovery and development. Chem Res Toxicol. 2004;17:3. doi: 10.1021/tx034170b. [DOI] [PubMed] [Google Scholar]
- 3.West D, Marnett LJ. Endogenous reactive intermediates as modulators of cell signaling and cell death. Chem Res Toxicol. 2006;19:173. doi: 10.1021/tx050321u. [DOI] [PubMed] [Google Scholar]
- 4.Liebler C. Introduction to Proteomics: Tools for the New Biology. Humana Press; Totowa, NJ: 2001. [Google Scholar]
- 5.Liebler C, Hansen BT, Davey SW, Tiscareno L, Mason DE. Peptide sequence motif analysis of tandem MS data with the SALSA algorithm. Anal Chem. 2002;74:203. doi: 10.1021/ac0155512. [DOI] [PubMed] [Google Scholar]
- 6.Hansen T, Jones JA, Mason DE, Liebler DC. SALSA: a pattern recognition algorithm to detect electrophile-adducted peptides by automated evaluation of CID spectra in LC-MS-MS analyses. Anal Chem. 2001;73:1676. doi: 10.1021/ac001172h. [DOI] [PubMed] [Google Scholar]
- 7.Hansen T, Davey SW, Ham AJ, Liebler DC. P-Mod: An algorithm and software to map modifications to peptide sequences using tandem MS data. J Proteome Res. 2005;4:358. doi: 10.1021/pr0498234. [DOI] [PubMed] [Google Scholar]
- 8.Hansen T, Davey SW, Ham AJ, Liebler DC. P-Mod: An algorithm and software to map modifications to peptide sequences using tandem MS data. J Proteome Res. 2005;4:358. doi: 10.1021/pr0498234. [DOI] [PubMed] [Google Scholar]
- 9.Dennehy K, Richards KAM, Wernke GW, Shyr Y, Liebler DC. Cytosolic and nuclear protein targets of thiol-reactive electrophiles. Chem Res Toxicol. 2006;9:20. doi: 10.1021/tx050312l. [DOI] [PubMed] [Google Scholar]
- 10.Julka S, Regnier F. Quantification in proteomics through stable isotope coding: a review. J Proteome Res. 2004;3:350. doi: 10.1021/pr0340734. [DOI] [PubMed] [Google Scholar]
- 11.Oda Y, Huang K, Cross FR, Cowburn D, Chait BT. Accurate quantitation of protein expression and site-specific phosphorylation. Proc Natl Acad Sci U S A. 1999;96:6591. doi: 10.1073/pnas.96.12.6591. [DOI] [PMC free article] [PubMed] [Google Scholar]
- 12.Gygi SP, Rist B, Gerber SA, Turecek F, Gelb MH, Aebersold R. Quantitative analysis of complex protein mixtures using isotope-coded affinity tags. Nat Biotechnol. 1999;17:994. doi: 10.1038/13690. [DOI] [PubMed] [Google Scholar]
- 13.Mason DE, Liebler DC. Quantitative analysis of modified proteins by LC-MS-MS of peptides labeled with phenyl isocyanate. J Proteome Res. 2003;2:265. doi: 10.1021/pr0255856. [DOI] [PubMed] [Google Scholar]
- 14.Codreanu SG, Adams DG, Dawson ES, Wadzinski BE, Liebler DC. Inhibition of protein phosphatase 2A activity by selective electrophile alkylation damage. Biochemistry. 2006;45:10020. doi: 10.1021/bi060551n. [DOI] [PubMed] [Google Scholar]
- 15.Hong F, Sekhar KR, Freeman ML, Liebler DC. Specific patterns of electrophile adduction trigger Keap1 ubiquitination and Nrf2 activation. J Biol Chem. 2005;280:31768. doi: 10.1074/jbc.M503346200. [DOI] [PubMed] [Google Scholar]
- 16.Lemercier J, Meier B, Gomez J, Thompson JA. Inhibition of glutathione S-transferase P1-1 in mouse lung epethelial cellsby the tumor promoter 2,6-di-tert-butyl-4-methylene-2,5-cyclohexadienone (BHT-quinone methide): Protein adducts investigated by electrospray mass spectrometry. Chem Res Toxicol. 2004;17:1675. doi: 10.1021/tx049811x. [DOI] [PubMed] [Google Scholar]
- 17.van Iersel ML, Ploemen JP, Lo BM, Federici G, van Bladeren PJ. Interactions of alpha, beta-unsaturated aldehydes and ketones with human glutathione S-transferase P1-1. Chem Biol Interact. 1997;108:67. doi: 10.1016/s0009-2797(97)00096-3. [DOI] [PubMed] [Google Scholar]
- 18.Vega MC, Walsh SB, Mantle TJ, Coll M. The three-dimensional structure of Cys-47-modified mouse liver glutathione S-transferase P1-1. Carboxymethylation dramatically decreases the affinity for glutathione and is associated with a loss of electron density in the alphaB-310B region. J Biol Chem. 1998;273:2844. doi: 10.1074/jbc.273.5.2844. [DOI] [PubMed] [Google Scholar]
- 19.Chang M, Shin YG, van Breemen RB, Blond SY, Bolton JL. Structural and Functional Consequences of Inactivation of Human Glutathione S-Transferase P1-1 Mediated by the Catechol Metabolite of Equine Estrogens, 4-Hydroxyequilenin. Biochem. 2001;40:4811. doi: 10.1021/bi002513o. [DOI] [PubMed] [Google Scholar]
- 20.Chang M, Bolton JL, Blond SY. Expression and purification of hexahistidine-tagged human glutathione S-transferase P1-1 in Escherichia coli. Protein Expr Purif. 1999;17:443. doi: 10.1006/prep.1999.1149. [DOI] [PubMed] [Google Scholar]
- 21.Ham AJ. Proteolytic Digestion Protocols. In: Caprioli RM, Gross ML, editors. The Encyclopedia of Mass Spectrometry, Volume 2 Biological Applications Part A: Peptides and Proteins. Elsevier Ltd; Kidlington, Oxford, UK: 2005. pp. 10–17. [Google Scholar]
- 22.Eng JK, McCormack AL, Yates JR. An Approach to Correlate Tandem Mass-Spectral Data of Peptides with Amino-Acid-Sequences in A Protein Database. J Am Soc Mass Spectrom. 1994;5:976. doi: 10.1016/1044-0305(94)80016-2. [DOI] [PubMed] [Google Scholar]
- 23.Peng J, Elias JE, Thoreen CC, Licklider LJ, Gygi SP. Evaluation of multidimensional chromatography coupled with tandem mass spectrometry (LC/LC-MS/MS) for large scale protein analysis: the yeast proteome. J Proteome Res. 2003;2:43. doi: 10.1021/pr025556v. [DOI] [PubMed] [Google Scholar]
- 24.Habig WH, Pabst MJ, Jakoby WB. Glutathione S-transferases. The first enzymatic step in mercapturic acid formation. J Biol Chem. 1974;249:7130. [PubMed] [Google Scholar]
- 25.Hansen BT, Davey SW, Ham AJ, Liebler DC. P-Mod: An algorithm and software to map modifications to peptide sequences using tandem MS data. J Proteome Res. 2005;4:358. doi: 10.1021/pr0498234. [DOI] [PubMed] [Google Scholar]
- 26.Marnett LJ, Riggins JN, West JD. Endogenous generation of reactive oxidants and electrophiles and their reactions with DNA and protein. J Clin Invest. 2003;111:583. doi: 10.1172/JCI18022. [DOI] [PMC free article] [PubMed] [Google Scholar]
- 27.Porter NA, Caldwell SE, Mills KA. Mechanisms of free radical oxidation of unsaturated lipids. Lipids. 1995;30:277. doi: 10.1007/BF02536034. [DOI] [PubMed] [Google Scholar]
- 28.Zhang R, Sioma CS, Thompson RA, Xiong L, Regnier FE. Controlling deuterium isotope effects in comparative proteomics. Anal Chem. 2002;74:3662. doi: 10.1021/ac025614w. [DOI] [PubMed] [Google Scholar]
- 29.Gerber SA, Rush J, Stemman O, Kirschner MW, Gygi SP. Absolute quantification of proteins and phosphoproteins from cell lysates by tandem MS. Proc Natl Acad Sci U S A. 2003;100:6940. doi: 10.1073/pnas.0832254100. [DOI] [PMC free article] [PubMed] [Google Scholar]
- 30.Lo Bello M, Parker MW, Desideri A, Polticelli F, Falconi M, Del Boccio G, Penneli A, Federici G, Ricci G. Peculiar Spectroscopic and Kinetic Properties of Cys-47 in Human Placental Glutathione Transferase. J Biol Chem. 1993;268:19033. [PubMed] [Google Scholar]
- 31.Lo Bello M, Battistoni A, Mazzetti AP, Board PG, Muramatsu M, Federici G, Ricci G. Site-directed Mutagenesis of Human glutathione Transferase P1-1. Spectral, kinetic, and structural properties of Cys-47 and Lys-54 mutants. J Biol Chem. 1995;270:1249. [PubMed] [Google Scholar]
- 32.Li H, Robertson AD, Jensen JH. Very fast empirical prediction and rationalization of protein pKa values. Proteins. 2005;61:704. doi: 10.1002/prot.20660. [DOI] [PubMed] [Google Scholar]
- 33.Dolinsky TJ, Nielsen JE, McCammon JA, Baker NA. PDB2PQR: an automated pipeline for the setup of Poisson-Boltzmann electrostatics calculations. Nucleic Acids Res. 2004;32:W665–W667. doi: 10.1093/nar/gkh381. [DOI] [PMC free article] [PubMed] [Google Scholar]


