Abstract
Purpose
To investigate the in vitro in vivo correlation of a sustained release formulation for human growth hormone (hGH) based on hydroxyethyl methacrylated dextran (dex-HEMA) microspheres in Pit-1 deficient Snell dwarf mice and in healthy human volunteers.
Materials and Methods
A hGH-loaded microsphere formulation was developed and tested in Snell dwarf mice (pharmacodynamic study) and in healthy human volunteers (pharmacokinetic study).
Results
Single subcutaneous administration of the microspheres in mice resulted in a good correlation between hGH released in vitro and in vivo effects for the hGH-loaded microsphere formulation similar to daily injected hGH indicating a retained bioactivity. Testing the microspheres in healthy volunteers showed an increase (over 7–8 days) in hGH serum concentrations (peak concentrations: 1–2.5 ng/ml). A good in vitro in vivo correlation was obtained between the measured and calculated (from in vitro release data) hGH serum concentrations. Moreover, an increased serum concentration of biomarkers (insulin-like growth factor-I (IGF-I), IGF binding protein-3 (IGFBP-3) was found again indicating that bioactive hGH was released from the microspheres.
Conclusions
Good in vitro in vivo correlations were obtained for hGH-loaded dex-HEMA microspheres, which is an important advantage in predicting the effect of the controlled drug delivery product in a clinical situations.
Key words: dex-HEMA microspheres, hGH, dextran, in vitro in vivo correlation
INTRODUCTION
Since the introduction of recombinant human Growth Hormone (hGH) in 1985, the treatment of patients suffering from pediatric growth hormone deficiencies has improved considerably. However, hGH replacement therapy still suffers from the burden of daily injections, which negatively affects patient compliance and comfort. The availability of injectable systems, delivering hGH with a controlled rate over a period of 1 week to 1 month would be a significant improvement of the current daily treatment.
Several parenteral sustained release systems for the controlled delivery of growth hormone have been investigated (1–6). The best known hGH sustained delivery system consists of polylactide-co-glycolide acid (PLGA) based microspheres, containing up to 22.5 mg hGH per injection, which was designed for monthly and bi-weekly treatment of growth hormone deficient patients (2,7,8).
In general, PLGA microsphere systems have several drawbacks, such as a high burst release of the active ingredient, the use of organic solvents for the microsphere preparation and acidification of the PLGA matrix during release of the active ingredient which can lead to protein aggregation when no stabilizers are added (9–12). High burst release results in the loss of significant amounts of active during a short period of time and reduces the efficacy of the formulation. Importantly, the release of aggregated protein may result in an immunogenic response (13,14). Especially for proteins these issues will limit successful application of PLGA as controlled release matrix.
Hydrophilic matrices such as hydrogels are generally gentler for sensitive proteins than hydrophobic matrices such as PLGA (15,16). We have developed hydrogel microspheres, consisting of degradable networks of crosslinked dextran (17,18). Therapeutic proteins can be physically entrapped in the network and released by degradation of the network upon administration. Typical release profiles of proteins from these hydrogels range from zero-order to sigmoidal with a duration of typically 1 to 4 weeks (18,19). Details on the preparation and properties of dex-HEMA microspheres have been described previously (18,20–27).
At present, no information is available about the in vitro in vivo correlation (IVIVC) of protein-loaded dex-HEMA microsphere formulations. Once a correlation is established, in vitro release tests can serve as a guide to formulation development.
In this study, we designed an hGH-loaded dex-HEMA microsphere formulation which releases the protein for 7 days. The IVIVC of this formulation in Pit-1 deficient Snell dwarf mice and in healthy human volunteers was investigated. In dwarf mice, increase in body length and in body weight were measured after a single subcutaneous injection of hGH loaded dex-HEMA microspheres and compared with data from daily subcutaneously injected solutions of hGH in saline during a period of 4 weeks. In a clinical setting, hGH serum concentrations were compared to the calculated theoretical serum concentrations, based on the in vitro release profile of hGH after a single subcutaneous injection with hGH loaded dextran microspheres. To investigate the biological activity of released hGH serum levels of IGF-1 and IGFBP-3, two biomarkers for hGH, were also monitored.
MATERIALS AND METHODS
Chemicals Poly(ethylene glycol) (PEG) 10 kDa and potassium peroxodisulfate (KPS) were obtained from Merck, Darmstadt, Germany. N,N,N′,N′-tetramethylethylenediamine (TEMED), sucrose and carboxymethylcellulose were purchased from Fluka (Buchs, Switzerland). Hydroxyethyl methacrylate derivatized dextrans (dex-HEMA) with a degree of HEMA substitution (DS, number HEMA groups per 100 glucose units) of 12, 16 and 20 were synthesized and characterized according to Van Dijk-Wolthuis et al. (17) and obtained from Polymer Service Center Groningen (PSCG, Groningen, the Netherlands). HGH-190 (Somatogen®), which is a truncated form (lacking one phenylalanine residue) of the natural human growth hormone) was kindly supplied by Biotechna Sicor Inc. (Irvine, CA, USA).
Microsphere Preparation
Formulation Development Different batches dex-HEMA microspheres were prepared at 5 g scale with various DS, KPS concentrations and protein load (Table I). The preparation procedure was based on the water-in-water emulsion technique as described elsewhere (18,21). In detail, for microspheres with an initial water content of 50% and a protein load of 3% w/w (weight hGH/weight dex-HEMA), 61 mg of dex-HEMA was dissolved in 0.6 ml hGH solution (3.2 mg/ml hGH in 10 mM phosphate buffer pH 7.4 containing mannitol and glycine) and the resulting solution was freeze dried (Lyostar, FTS Systems, Inc. Stone Ridge, USA). Next, the obtained cake was hydrated in 4.9 g of a 27% w/w PEG solution in 25 mM phosphate buffer pH 7.0. The mixture was vortexed for 1 min and subsequently 100 μl of a TEMED solution [20% (v/v), pH neutralized with 4 M hydrochloric acid] was added, followed by vortexing for 20 s. Then, 180 μl KPS (concentration 50 mg/ml in PBS) was added, the emulsion was shaken gently and allowed to polymerize for 1 h at room temperature. The formed microspheres were washed five times with 5 ml 25 mM phosphate buffer pH 7.4.
Table I.
Characteristics of the Different hGH Containing Dex-HEMA Formulations
| Formulation | DS | Initial Protein Loading (% w/w) | KPS Concentration (mg/ml) | Recovery (%) | Time to Release 90% (days) | Burst (%) | |||
|---|---|---|---|---|---|---|---|---|---|
| ≥90%a | ≥7 daysa | ≤10%a | |||||||
| 1 | 12 | 3 | 50 | 87 | − | 5.5 | − | 11 | − |
| 2 | 12 | 10 | 13 | 96 | + | 3.7 | − | 32 | − |
| 3 | 12 | 16 | 50 | 97 | + | 4.3 | − | 28 | − |
| 4 | 12 | 20 | 50 | 100 | + | 3.1 | − | 40 | − |
| 5 | 16 | 3 | 50 | 84 | − | 6.9 | − | 8 | + |
| 6 | 16 | 10 | 50 | 91 | + | 7.7 | + | 9 | + |
| 7 | 16 | 20 | 13 | 94 | + | 6.6 | − | 11 | − |
| 8 | 20 | 3 | 13 | 72 | − | 9.9 | + | 10 | − |
| 9 | 20 | 3 | 50 | 86 | − | 12.4 | + | 12 | − |
| 10 | 20 | 20 | 50 | 95 | + | 7.6 | + | 14 | − |
a+ and − indicate whether the formulation requirements are met (+) and or not (−). The values are the mean of two independent measurements that deviated less than 10%.
Percentage of aggregation was not investigated in this study as in a previous study, it was demonstrated that formulation parameters did not effect the percentage aggregation of the released hGH (27).
Animal Trial Material (ATM) For the animal trial, two different batches of hGH-loaded microspheres (dex-HEMA DS16, initial water content of 50% and target protein loading of 10% hGH w/w dry weight (ATM 1) or initial protein loading of 10% hGH w/w dry weight (ATM 2)) and placebo microspheres (dex-HEMA DS16 initial water content of 50%) were prepared. The microspheres were prepared at 30 g scale (corresponding with 0.4 g dry weight of microspheres). Apart from scale and amounts of raw materials and reagents adjustments, the preparation procedure of the microspheres was the same as described in the previous section. Only, the preparation procedure of the microspheres of ATM2 slightly deviated from the standard preparation procedure. These microspheres were obtained by homogenization of the dex-HEMA/PEG emulsion for 4 min at 10,000 psi with an Avestin C5 homogenizer (ATA scientific, Lucas Heights, Australia), prior to polymerization. The microspheres were washed with water by five centrifugation (3,500 rpm, 20 min) and washing steps (90 ml water). Finally, the microspheres were resuspended in 5.5 ml 25 mM phosphate buffer pH 7.4 also containing 3% (w/v) carboxy methyl cellulose (CMC) to prevent sedimentation of the microspheres and freeze-dried.
Clinical Trial Material (CTM) The hGH loaded dex-HEMA microspheres for the study in volunteers were prepared at a 1 kg process scale (12 g dex-HEMA). Except for scale adjustment of amounts of raw materials and reagents, microspheres (dex-HEMA DS16, 50% initial water content, 10% hGH w/w dry weight) were prepared essentially according to the procedure described above. Briefly, the PEG/dex-HEMA/buffer mixture was emulsified for 55 min at 1,500 rpm in an autoclavable 2-l jacketed Bioreactor unit equipped with baffles and a three bladed impeller (4.5 cm in diameter; Applikon B.V., Schiedam, the Netherlands). Next, 4 ml TEMED solution [20% (v/v), pH neutralized with 4 M hydrochloric acid] was added and stirring was continued for 5 min. The stirring rate was set to 500 rpm and 2.7 ml of 50 mg/ml KPS-solution was added. The stirring was stopped after 5 min and the emulsion was incubated at room temperature for 60 min to polymerize the dextran grafted HEMA groups. Removal of PEG, KPS and TEMED was performed by crossflow filtration with a FiberFlo hollow fiber capsule filter (0.22 μm: Minntech, Mineappolis, USA) using 5.5 l 5 mM phosphate buffer pH 7.4 containing 3% w/w sucrose. The microspheres were suspended in 450 ml 5 mM phosphate buffer pH 7.4 containing 3% w/w sucrose and concentrated over the filter to 500 ml. The resulting microsphere suspension was pumped into 20 ml vials (7.3 g per vial) and freeze-dried (Lyostar, FTS Systems, Inc. Stone Ridge, USA). The hGH content of the microspheres was determined by amino acid analysis (Ansynth, Roosendaal, The Netherlands). Briefly, about 1 g of microsphere suspension (10 mg microspheres/g) was incubated with HCl (6 M) by incubation at 110°C for 22 h to hydrolyze the matrix and the protein. The sample solution was mixed with internal standard solution (Sigma, USA) and analyzed for amino acid concentration with an amino acid analyzer (Biochrom 20, Pharmacia, Uppsala, Sweden), using a weakly acidic cation exchange column (Bio20 Lithium, 250 × 4.6 mm, Ultropac 8 Li-form, Pharmacia, Uppsala, Sweden).To ensure the sterility of both the animal and clinical trial material, the microspheres were produced aseptically. Prior to use, all solutions were pumped through a sterile Millipak 200 filter into the vials. All equipment was autoclaved before use (30 min 121°C, Sauter autoclave; Sauter AG, Sulgen, Switzerland) and vials were heated for 4 h at 250°C.Average particle diameters and size distributions of the microspheres were measured with a Malvern Mastersizer 2000 (Malvern instruments Ltd, Worcestershire, United Kingdom) with water as diluent.
In Vitro Release Characteristics of hGH Microspheres
Freeze dried microspheres (40 mg) were hydrated in 5 ml 25 mM phosphate buffer pH 7.4 at 37°C. At different time points, the microspheres were centrifuged for 5 min at 3,200 × g; 3 ml supernatant was removed and replaced by 3 ml of the same buffer. The hGH concentration in the samples was determined by GPC (see next section). The burst release is defined as the percentage of the encapsulated amount hGH released after 7 h of incubation. The recovery is defined as percentage of the total amount of released hGH (after 4–20 days; dependent on the formulation) divided by the encapsulated amount hGH. The encapsulated amount of hGH in the microspheres was determined by summation of the total amount released from the microspheres and the amount of hGH present in the microspheres after the release period (after 4–20 days; dependent on the formulation) determined with nitrogen analysis (see nitrogen analysis).
Size Exclusion Chromatography High performance size exclusion chromatography (HP-SEC) was used to determine the hGH concentration in the release samples. The HPLC system consisted of a pump series 200, a vacuum degasser series 200, an autosampler series 200, a column LC 101 oven, and a UV detector series 200 (all Perkin Elmer Instruments, Norwalk, USA), thermostated (35°C) Thosohaas TSKgel G300SWXL column and a Thosohaas TSKgel SWXL guardcolumn (Montgomeryville, PA, USA). The flow rate was 0.7 ml/min and a mobile phase containing phosphate buffer (64 mM, pH 7.0) and 3% (v/v) isopropanol was used. The chromatograms were recorded and analyzed with the Totalchrom data acquisition system (Perkin Elmer Instruments, Norwalk, USA).
Nitrogen Analysis The amount of protein present in the microspheres (corrected for the nitrogen content in placebo microspheres) at the end of the release period (after 4–20 days; dependent on the formulation) was determined. by nitrogen anlaysis. The samples (500 μl) were injected using an autoinjector (ELS 2100) into a nickel boat, which was subsequently transported into the furnace tube TN 3000. The analyzer was equipped with a cold trap TX/TS module and a UV detector (both thermo Euroglass corp. Delft, Holland). The argon flow was set at 340 ml/min, the oxygen flow was set at 15 ml/min and the ozonator was set at 110 ml/min. The temperature of the furnaces was set at 1,000°C, while temperature of the NOx scrubber was set at 320°C. A calibration curve was obtained injecting 500 μl of an aqueous glycine solution (0.1–10 μg/ml). The hGH-190 concentration was calculated by assuming it contains 16.7% w/w nitrogen (28). The data were recorded and analyzed with the data acquisition system of Thermo Euroglass DIN 38409 (Thermo Euroglass corp. Delft, Holland).
Animal Experiments
Pit-1 deficient Snell dwarf mice were bred and kept under standardized laboratory conditions (24°C, relative humidity 60%). Dwarfs were bred by mating heterozygous females (+/dw) to dwarf males (dw/dw), rendered fertile by treatment with 1 mg l-thyroxine and 50 mg prolactin 5 days a week for at least 4 weeks. After weaning at 4–5 weeks, the dwarfs were maintained on a diet of commercial food pellets, supplemented with a mixture of milk powder, wheat embryo, and raw egg (1:2:2) suspended in 10% glucose in water (29). All animals were weighed and their length was measured weekly under ether anesthesia (30). Since growth patterns of male and female dwarfs turned out to be similar, groups contained both males and females (age 6–8 weeks).
Study Procedure and Assay Methods
The dwarf mice were selected to obtain equal initial means and standard deviations for length and weight and an equal distribution over both sexes and age at the start of the experiment. The mice were divided over five groups each consisting of five animals. Group 1 received 0.1 ml phosphate buffered saline (PBS for 5 days a week for 4 weeks, once daily); group 2, hGH-190, 8.3 μg dissolved in 0.1 ml saline for 5 days a week for 4 weeks, once daily (total dose of hGH administered 166 μg); group 3 received only at the start of the experiment 0.1 ml of a hGH loaded dex-HEMA microsphere (ATM1; releasing 232 μg hGH) suspension in saline; group 4 received only at the start of the experiment 0.1 ml of a hGH loaded dex-HEMA microsphere (ATM2; releasing 156 μg hGH) suspension in saline.
Weekly, body length and weight were measured. Local reactions of the injected microspheres were assessed during the course of the experiment and just before the animals were killed by decapitation, 4 weeks after the start of the experiment, by two independent researchers. Four weeks after the start of the experiment and 2 h after the last injection of animals from groups 1 and 2 all animals were killed by decapitation under etheranaesthesia. Blood was collected, and the sera were pooled per group. To investigate the formation of hGH ntibodies, sera were incubated overnight at 4°C with 125I-labeled-hGH [obtained as described by Salacinski et al. (31) and purified by chromatography on Sephadex G-50 followed by Sephadex G-100 (32)] at different dilutions. Separation of bound and free hormone was performed by adding 100 μl Sac-Cel anti-rat IgG coated cellulose suspension (Immunodiagnostic Systems, Boldon UK). After 30 min of complexation at room temperature, 0.5 ml distilled water was added, and the samples were centrifuged at 10,000 × g for 4 min. Radioactivity in the pellets was counted in a Packard γ-counter.
Clinical Trial
Subjects
Subjects were enrolled at the Clinic of Cardiology in Tartu, Estonia, for a single-dose pharmacokinetic study in healthy elderly volunteers. Institutional Review Board approval was obtained and patient signed informed consent forms were obtained before screening. Healthy men between 50 and 80 years were recruited for this study. All subjects passed pre-study physical examination, laboratory tests and ECG. Entry criteria included body mass index between 22 and 27 kg/m2, peak growth hormone level <3 μg/l and IGF-1 level <280 μg/l and absence of indications of major diseases. Subjects were excluded if they had a history of diabetes mellitus, or active thyroid function abnormalities, or active hepatic, renal, metabolic or endocrine diseases.
Study Treatment
After a 2-day baseline period, ten volunteers received one dose of hGH loaded dex-HEMA microspheres formulation (age, 62 ± 7 years; body weight, 82 ± 13 kg; BMI, 27 ± 3 kg/m2; peak growth hormone level <3 μg/l and IGF-1 level <280 μg/l) equivalent to 14 mg hGH. Each subject received the above treatments by subcutaneous injection in the abdomen. The dose was administered in volumes of approximately 1.1 ml (75 mg microspheres/ml) by four subcutaneous injections, each at a different abdominal site.
Study Procedure and Assay Methods
Subjects were screened for eligibility within 3 weeks prior to the institutionalisation period. After fulfilling all inclusion and exclusion criteria subjects were institutionalised from the evening before day−2 up to the morning after the day study medication has been administered (day 2). Hereafter subjects returned to the institute on day 3, 5, 7, 8, 9, 10, 11, 12, 14, 24 and 38. Subjects returned for a last follow-up visit to the institute on day 90 (±3 days). Growth hormone serum levels were measured during screening, at baseline and after treatment up to day 38. From day 3 to 38 after drug administration, three blood samples were taken at 30-min intervals, on each assessment day. Endogenous growth hormone is released from the pituitary in a pulsatile fashion [short peak every 2 h (33)], and a single growth hormone sample might coincide with an endogenous growth hormone peak, thus masking the growth hormone levels due to the hGH loaded dex-HEMA microsphere treatment. To minimize this risk, three samples were taken as described, and the lowest growth hormone value of each triplet sample was taken to account for endogeneous hGH spikes. On the basis of this minimum-out-of-three approach, mean growth hormone profiles for all treatment groups were obtained.
The collected blood samples for the determination of growth hormone, IGF-1 and IGFBP-3 were collected using 4 ml clot-activator tubes, and later centrifuged for 10 min at 1,100–1,300 × g to collect the serum. Serum was stored at −20°C until analysis. Samples were labeled by a bar code, which contained the subject number, sample number, study day and study code. Analysis were performed by HTI Laboriteenuste AS (Hiiu 44, Tallinn, Estonia). Serum concentrations of hGH, IGF-1 and IGFBP-3 were determined by a two-site chemiluminescent enzyme immunometric assay standard kit (Immulite, Diagnostic Products Corporation, Los Angeles, USA) using an IMMULITE 2000 Analyzer (Diagnostic Products Corporation, Los Angeles, USA).
In Vitro In Vivo Correlation
The serum hGH concentration in humans as function of time was calculated with Modelmaker 4 (AP Benson, Oxfordshire, UK) from the in vitro release data, using a one-compartment linear model (34). In this model, blood is considered as a single compartment and the serum concentration as function of time is calculated from the absorption of subcutaneous hGH into the blood and the hGH elimination from the blood. Furthermore, it is assumed that equilibrium between the hGH serum concentration and that in extravascular tissues is rapidly formed, and that the excretion and absorption follow first order kinetics. In Fig. 1a schematic overview is given of the calculations in Modelmaker 4. Briefly, from the in vitro release data, the amount of hGH released subcutaneously per unit of time was calculated. From these data, following first order reaction kinetics, the rate of hGH absorption (mg hGH/unit of time) into the blood was calculated, using the absorption rate constant in humans derived from absorption half life in humans (t1/2,a = 0.7 h) obtained by Jorgenson et al. for subcutaneous administration of hGH (35) and a bioavailability of 75% (36) using:
 |
1 |
Where, A1 is the amount of hGH present subcutaneously, R(t) is the amount of hGH released from the microspheres per unit of time, ka is the absorption rate constant, B is the bioavailability of hGH.
Fig. 1.
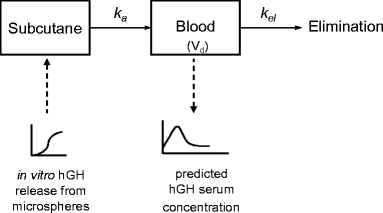
Schematic overview of model used to predict the in vivo serum concentration of hGH.
Again following first order reactions kinetics, the amount of hGH in the serum as function of time was calculated from the absorption rate data using the elimination rate constant in humans (derived from elimination half life in humans t1/2,el = 12 min; (35) according to:
 |
2 |
Here A2 is the amount of hGH present in serum and kel is the elimination rate constant. Finally, the serum hGH concentration followed from dividing this amount by the average distribution volume (Vd) of the elderly male human volunteers (70 ml/kg body weight). The in vitro in vivo correlation was evaluated by comparing the calculated serum concentration time data to the measured serum concentration time data.
RESULTS
Formulation Development
Figure 2 shows some typical cumulative release curves of hGH from these dex-HEMA microspheres. The results of all formulations are summarized in Table I. Figure 2 shows that hGH was released with almost zero order kinetics from dex-HEMA microspheres for 5–15 days, dependent on the formulation. This figure also shows that the time to release more than 90% of hGH increased with an increasing DS and decreasing protein loading, which is consistent with previous observations (18,26). The results in Table I show that the time to release 90% of hGH decreased with increasing KPS concentration (e.g. compare formulation 8,9). Furthermore, the burst release ranged between 8 and 40% of the loading and increased with increasing protein loading (e.g. compare formulation 1,3,4). The recovery of hGH ranged respectively between 71 and 100% and no obvious effects of KPS concentration, loading and DS on recovery were found.
Fig. 2.
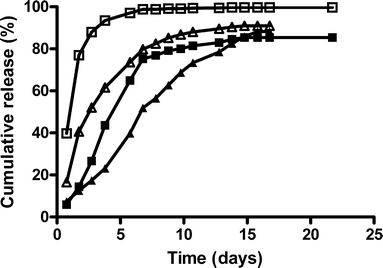
Cumulative release of hGH from DS 12 (closed squares, open squares), and 20 (closed triangles, open triangles) microspheres. The initial water content was 50% and the protein load was 3% (closed symbols) and 20% (open symbols). The values are the average of two independent measurements and deviated less than 10%.
In Table I, the formulations are scored for the preferred characteristics (time to release 90% >7 days, burst release <10%, recovery >90%). Only formulation 6 meets all the requirements. Therefore, the processing parameters identified for the preparation of this formulation were used for the preparation of microspheres for both the animal trial (ATM) and the clinical trial (CTM) microsphere batches.
Formulation and In Vitro Release Characteristics of Animal Trial Material (ATM) and Clinical Trial Material (CTM)
In Table II, the characteristics of the dex-HEMA microspheres prepared for the animal trial and for the clinical trial are presented. The homogenization of the emulsion resulted in substantially smaller particles than without homogenization (compare the median volume diameter of ATM1 and ATM2; d(0.5)=19.7 μm and d(0.5)=4.6 μm, respectively). For the preparation of the CTM batch, no homogenization was used, which resulted in the formation of hGH loaded dex-HEMA microspheres with a [d(0.5)=18.0 μm].
Table II.
Characteristics of ATM and CTM hGH-Loaded Dex-HEMA Microsphere Batches
| Formulation | Median Volume-Based Diameter [d(0.5); μm] | Recovery (%) | Time to Release 90% (days) | Burst (%) |
|---|---|---|---|---|
| hGH loaded dex-HEMA microspheres (ATM1) | 19.7 | 98 | 9.0 | 8 |
| hGH loaded dex-HEMA microspheres (ATM2) | 4.6 | 66 | 8.8 | 10 |
| hGH loaded dex-HEMA microspheres (CTM) | 18.0 | 100 | 8.5 | 1 |
The values are the average of two independent measurements that deviated less than 10%.
In Fig. 3, the cumulative release profiles of hGH from the ATM1 and ATM2 batches are shown. For both batches, near zero-order release of hGH was observed for 9 days. Both ATM1 and ATM2 showed a small burst release of 8 and 10% respectively (Table II). A recovery of 66 and 100% was obtained for the homogenized (ATM2) and the not homogenized batch (ATM1; Table II), respectively. Figure 4 shows the release curve of the clinical trial material (CTM). In contrast to the microspheres prepared at 30 g scale, microspheres produced in the bioreactor at a 1 kg scale had a more sigmoidal release profile with a delay of approximately 3 days.
Fig. 3.
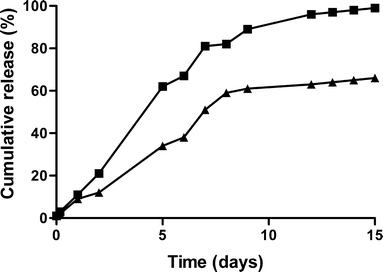
Cumulative release of hGH from dex-HEMA microsphere (DS 16, initial water content 50%, initial protein loading 10% w/w) batches prepared without homogenization (ATM1, Table II; closed squares) and with homogenization of the emulsion prior to polymerization (ATM2, Table II; closed triangles). ATM1 and ATM2 were used in the animal study. The values are the average of two independent measurements and deviated less than 15%.
Fig. 4.
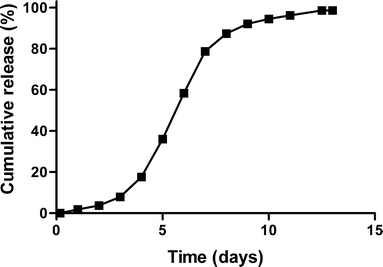
Cumulative release of hGH from dex-HEMA microspheres (DS 16, initial water content 50%, initial protein loading) used in the clinical study (CTM, Table II). The values are the average of two independent measurements and deviated less than 5%.
Dwarf Mice Study
In Fig. 5 the growth curves of dwarf mice injected with an hGH solution, hGH-loaded microspheres (ATM1, ATM2), and PBS are shown. These figures show that after repeated injection of an hGH solution as well as a single subcutaneous injection of hGH loaded dex-HEMA microspheres, both weight and length of the mice steadily increases in time (over a period of 28 days for mice injected with single subcutaneous injections and over a period of 14 days for mice injected with ATM1,2). In Fig. 6 the cumulative in vitro release of hGH (ATM1, ATM2) and the cumulative administered amount of hGH (control) are plotted against the observed pharmacodynamic effect (increase in body length). The Fig. 6a shows that the pharmacodynamic effect almost perfectly follows the in vitro release of hGH. Importantly, Fig. 6b demonstrates that the growth per μg of hGH is comparable both for hGH loaded dex-HEMA microspheres and for the repeated injection of an hGH solution.
Fig. 5.
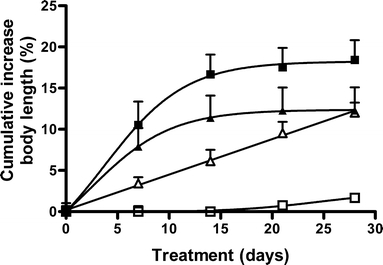
Cumulative % increase in body length of dwarf mice during 4 weeks after sc injection of saline (open squares), hGH 8.3 μg/per day for 28 days (open triangles), ATM1 microspheres (closed squares) and ATM2 microspheres (closed triangles). Mean ± S.E. (n = 5). Curves are significant different (P < 0.05).
Fig. 6.
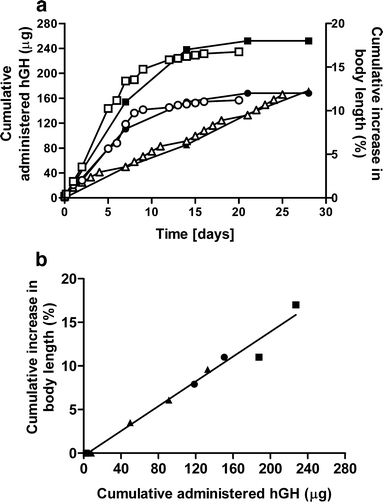
aIn vitro in vivo correlation between cumulatively administered/released hGH (open symbols) and cumulative increase in body length (closed symbols) for hGH 8.3 μg/per day (open triangles, closed triangles), microspheres of ATM1 (open squares, closed squares) and microspheres ATM2 (open circles, closed circles) and b cumulatively administered/released hGH vs cumulative increase in body length for hGH 8.3 μg/per day (closed triangles), microspheres of ATM1 (closed squares) and microspheres ATM2 (closed circles).
Although hGH-190 is active in Snell dwarf mice, it is a foreign protein for mice, and therefore can induce the formation of antibodies and give rise to local site effects. Figure 7 indeed shows that 4 weeks after administration of hGH, hGH-specific antibodies were detected in the sera of the mice. In this figure the binding of radioactively labeled hGH (125I-hGH) to formed hGH antibodies present in the pooled sera of mice is shown. HGH-specific antibodies were found 4 weeks after the start of treatment with hGH. The ED50 for the binding of 125I-hGH to antibodies in the serum was obtained at serum dilutions of approximately 200×, 800× and 1,200× for free hGH, hGH released from microspheres from ATM1 and ATM2 respectively. Apparently, both free hGH and hGH released from the microspheres evoked an immune response in these mice. Mice that had received the smaller ATM2 microspheres showed higher antibody levels than mice injected with the larger ATM1 microspheres. Moreover, a higher incidence of palpable local injection site reactions for ATM2 was found; one out of five mice developed an injection site reaction after injection with ATM1, while ATM2 caused injection site nodule formation in all mice.
Fig. 7.
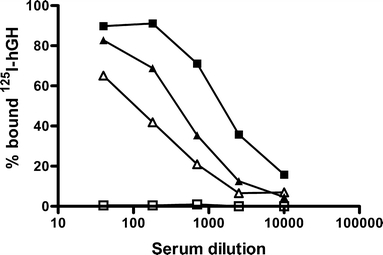
Binding of 125I-hGH to hGH-antibodies present in sera of Snell dwarf mice having received a single injection microspheres of ATM1 (closed squares) and microspheres of ATM2 (closed triangles) and daily injection of saline (open squares) or daily injection of a solution containing 8.3 μg hGH-190 (open triangles).
Clinical Study
Figure 8 shows the serum hGH concentration in male elderly volunteers after subcutaneous administration of dex-HEMA microspheres. A short-lived rise in serum growth hormone concentration was observed directly after administration. Hereafter, hGH concentrations started to rise from day 2, peaking and leveling off approximately on days 7 and 8 after injection. The peak hGH serum concentrations were approximately between 1.0 and 2.5 ng/ml all subjects. Also shown in this figure are the serum concentration time data calculated from the in vitro release curve of hGH from the dex-HEMA microspheres of the clinical trial material using the model described in the materials and methods (Fig. 4). The calculated serum concentration is in good agreement with the measured average serum hGH concentration.
Fig. 8.
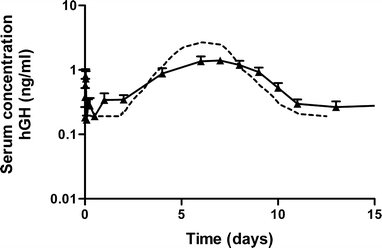
Measured hGH concentration in serum of human volunteers after administration of CTM microspheres, (closed triangles) and hGH concentration in serum (dotted line) calculated from the in vitro release of hGH using the model as described in the materials and methods. Mean ± S.E. (n = 10).
The serum concentrations of biomarkers IGF-1 and IGFBP-3 are shown in Figs. 9 and 10. The average serum profiles followed the average serum growth hormone profile well.
Fig. 9.
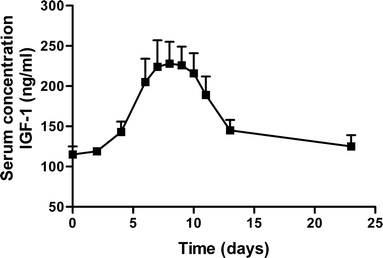
Serum concentration IGF-1 after administration of CTM microspheres. Mean ± S.E. (n = 10).
Fig. 10.
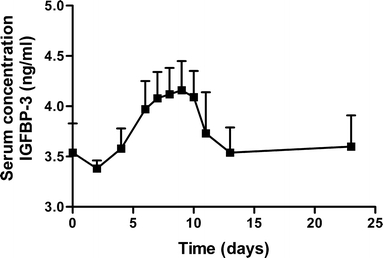
Serum concentration IGFBP-3 after administration of CTM microspheres. Mean ± S.E. (n = 10).
DISCUSSION
To save protein, the primary screening for a suitable protein loaded microsphere formulation is generally performed with microsphere formulations prepared at small-scale. However, to obtain enough material for in vivo studies preparation at larger scales is necessary. Differences between process parameters (such as stirring speed, process time) at small scale and at larger scales sometimes induce differences in microsphere characteristics. In this study, microsphere characteristics were initially not affected by preparation at 5 g scale or 30 g scale (ATM1). However, introduction of an extra homogenization step in the emulsification of dex-HEMA and PEG prior to the polymerization of the dex-HEMA at 30 g scale (ATM2) resulted in smaller microspheres [d(0.5)=4.6 μm ATM2; d(0.5)=19.7 μm ATM1; Table II] with a low recovery of hGH (66%; Table II). As previously observed, higher shear forces (here induced by homogenization with a turrax) applied during emulsification finally results in smaller microspheres (21). The low recovery of hGH from the microspheres prepared with the extra homogenization step (ATM2, Table II) is likely also caused by the higher shear forces which might induce irreversible denaturation of the protein resulting in the formation of aggregates, which are subsequently encapsulated in the microspheres. Importantly, the clinical material (CTM batch, Table II) showed quantitative recovery of hGH.
The microspheres produced in the bioreactor at a 1 kg scale (CTM batch) had a more sigmoidal release profile with a delay of approximately 3 days (Fig. 4), while microspheres prepared at 30 g scale (ATM1,2) had a zero-order release profile (Fig. 3). This difference is attributed to the differences in process time (one h emulsification time for the production of the CTM material; 1 and 5 min emulsification time for respectively ATM1 and ATM2). It is known that PEG and dextran can cause precipitation of hGH (6,27,37). An emulsification time of 1 h might result in the formation of large precipitates, which were subsequently encapsulated in the microspheres. Previously, it was shown that protein precipitates entrapped in dex-HEMA microspheres, as once sufficient crosslinks are hydrolyzed, first the precipitate needs to dissolve before the dissolved protein molecules can be released, which results in a delayed release for especially for large precipitates (26,27).
The pharmacodynamic effects of the hGH-loaded dex-HEMA microspheres (ATM) were assessed in Snell dwarf mice. The animal study was designed in such a way that without the performance of an extensive PK-study (take blood samples to investigate serum hGH or biomarker (IGF-1 IGFBP3 concentration) the effectiveness of the tested formulation could be screened easily by measuring the increase in body growth of the mice. The validity of the dwarf mouse as a model for studying growth was previously demonstrated by van Buul-Offers and Van den Brande (38,39).
Figure 5 clearly demonstrate that administration of hGH containing microspheres induces a dose dependent increase in both body length. Fig. 6a demonstrates that there is a good correlation between the amount of released hGH and the pharmacodynamic effects as the increase in body length almost perfectly follows the in vitro release curves. Furthermore, Fig. 6b shows that hGH released from dex-HEMA microspheres is as effective as hGH administered via daily injections as there is no difference between growth response to a certain amount hGH administered by single daily injection of a solution of hGH and to the same amount of hGH released from either small microspheres (ATM2) or large microspheres (ATM1). This indicates that released hGH has mainly retained its bioactivity.
The microsphere formulations induced formation of antibodies in the mice. The highest antibody levels were observed after administration of small microspheres (batch ATM2). In addition, a higher incidence of palpable local injection site reactions was observed after the administration microspheres from this batch than after the administration large microspheres (batch ATM1). These observations might be ascribed to the size of the microspheres [d(0.5)=4.6 μm ATM2; d(0.5)=19.7 μm ATM1]. Microspheres smaller than 10 μm in diameter can be phagocytosed (Anderson and Shive, 1997). The observed higher antibody response after administration of ATM2 might therefore indicate that these microspheres were phagocytosed by antigen presenting cells. In addition, for ATM2 a recovery of 66% was obtained (Table II), these microspheres might contain more hGH aggregates, which might be the cause of the higher antibody response. Importantly, antibody formation does not affect the growth pattern, which suggests that the antibodies were not neutralizing.
Figure 8 shows that the shape of the serum hGH curve follows the cumulative in vitro release profile well, demonstrating a good in vitro in vivo correlation after subcutaneous administration of hGH loaded dex-HEMA microspheres to elderly male human volunteers. The delay observed in the in vitro release curve is also observed in the average serum hGH concentration in the first 3 days. The curve of the calculated hGH serum concentration was in good agreement with the measured hGH serum concentration (Fig. 8). The short-lived rise in serum human growth hormone serum concentration is probably caused by a small amount of non-encapsulated hGH in the hGH loaded dex-HEMA microsphere formulation. It should be noted that Fig. 4 does not show burst release as the microspheres were washed to remove the carboxy methyl cellulose before starting the in vitro release and therefore, small amounts hGH retrieved in the wash fractions were not included in the vitro release profile. The short elimination half-life of hGH [12 min; (40)] parallels the rapid disappearance of this observation.
Figures 9 and 10 show that the serum concentration of the biomarkers IGF-1 and IGFBP-3 followed the hGH serum concentrations. Generally, growth hormone exposure induces hepatic IGF-I production by increasing transcription of IGF-I mRNA (41). Since this is not a rapid process, the serum levels of IGF-1 do not follow the pulse in hGH serum levels, but instead the serum levels were paralleled by a delayed (∼36 h) increase in IGF-1 and IGFBP-3 that leveled out to correlate to average hGH levels. IGFBP-3 is the major carrier of IGFs in serum. More than 90% of IGF-1 and IGF-2 is bound to IGFBP-3 (42). IGFBP-3 may provide a storage pool for IGF-1 and may be involved in the transport of IGF-1 to tissues. Serum concentrations of IGFBP-3 are fairly constant throughout the day and are controlled by hGH and IGF-1 levels (43). The average serum profiles IGF-1 and IGFBP-3 followed the average serum growth hormone profile well, which suggests the preservation of bioactivity of released hGH from microspheres. Moreover, IGF-1 is considered the main driver for growth promotion (44,45). Generally the hGH dose applied in this study (40 μg kg−1 day−1) may not be considered optimal for growth stimulation (50–100 μg kg−1 day−1). Nevertheless, here a 6-day period with average IGF-1 levels of more than 200 ng/ml was observed, which may be sufficient for growth promotion (46).
In conclusion, a strong correlation between in vitro release and pharmacodynamic or pharmacokinetic effects is important to predict the effect of a controlled drug delivery formulation in a clinical situation. It allows prediction of clinical pharmacokinetics with in vitro data, and it gives more robustness to the protein delivery system. The good in vitro in vivo correlation is therefore an important advantage of dex-HEMA based microspheres as a parenteral protein delivery system.
References
- 1.J. L. Cleland, E. Duenas, A. Daugherty, A. Marian, J. Yang, M. Wilson, A. C. Celniker, A. Shahzamani, V. Quarmby, H. Chu, V. Mukku, A. Mac, M. Roussakis, N. Gillette, B. Brooks, D. Yueng, D. Brooks, Y.-F. Maa, C. Hsu, and J. S. Jones. Recombinant human growth hormone poly(lactic-co-glycolic acid) (PLGA) microspheres provide long lasting effect. J. Control. Rel.49:193–205 (1997). [DOI]
- 2.O. L. Johnson, J. L. Cleland, H. J. Lee, M. Charnis, E. Duenas, W. Jaworowicz, D. Shepard, A. Shahzamani, A. J. S. Jones, and S. D. Putney. A month-long effect from a single injection of microencapsulated human growth hormone. Nat. Med.2:795–799 (1996). [DOI] [PubMed]
- 3.M. Katakam, W. R. Ravis, and A. K. Banga. Controlled release of human growth hormone in rats following parenteral administration of poloxamer gels. J. Control. Rel.49:21–26 (1997). [DOI]
- 4.M. Reslow, M. Joensson, and T. Laakso. Sustained-release of human growth hormone from PLG-coated starch microspheres. Drug Del. Sys. Sci.2:103–109 (2002).
- 5.S. Takada, Y. Yamagata, M. Misaki, K. Taira, and T. Kurokawa. Sustained release of human growth hormone from microcapsules prepared by a solvent evaporation technique. J. Control. Release88:229–242 (2003). [DOI] [PubMed]
- 6.P. Van de Wetering, A. T. Metters, R. G. Schoenmakers, and J. A. Hubble. Poly(ethylene glycol) hydrogels formed by conjugate addition with controllable swelling, degradation, and release of pharmaceutically active proteins. J. Control. Rel.102:619–627 (2005). [DOI] [PubMed]
- 7.E. O. Reiter, K. M. Attie, T. Moshang, B. L. Silverman, S. F. Kemp, R. B. Neuwirth, K. M. Ford, and P. Saenger. A multicenter study of the efficacy and safety of sustained-release growth hormone in the treatment of naive pediatric patients with growth hormone deficiency. J. Clin. Endocrinol. Metab.86:4700–4706 (2001). [DOI] [PubMed]
- 8.B. L. Silverman, S. L. Blethen, E. O. Reiter, K. M. Attie, R. B. Neuwirth, and K. M. Ford. A long-acting human growth hormone (Nutropin DepotR): efficacy and safety following two years of treatment in children with growth hormone deficiency. J. Pediatr. Endocrinol. Metab.15:715–722 (2002). [DOI] [PubMed]
- 9.K. Fu, C. Pack, A. M. Klibanov, and R. Langer. Visual evidence of acidic environment within degrading pol(lactic-co-glycolic acid) (PLGA) microspheres. Pharm. Res.17:100–106 (2000). [DOI] [PubMed]
- 10.W. Lu and T. G. Park. Protein release from poly(lactic-co-glycolic acid) microspheres: protein stability problems. PDAJ. Pharm. Sci. Tech.49:13–19 (1995). [PubMed]
- 11.S. P. Schwendeman. Recent advances in the stabilization of proteins encapsulated in injectable PLGA delivery systems. Crit. Rev. Ther. Drug Carrier Syst.19:73–98 (2002). [DOI] [PubMed]
- 12.M. Van de Weert, W. E. Hennink, and W. Jiskoot. Protein Instability in Poly(Lactic-co-Glycolic Acid) Microparticles. Pharm. Res.17:1159–1167 (2000). [DOI] [PubMed]
- 13.S. Hermeling, D. J. A. Crommelin, H. Schellekens, and W. Jiskoot. Structure–immunogenicity relationships of therapeutic proteins. Pharm. Res.21:897–903 (2004). [DOI] [PubMed]
- 14.W. V. Moore and P. Leppert. Role of aggregated human growth hormone (hGH) in development of antibodies to hGH. J. Clin. Endocrinol. Metab.51:691–697 (1980). [DOI] [PubMed]
- 15.R. Langer and N. A. Peppas. Advances in biomaterials, drug delivery, and bionanotechnology. AICHe J.49:2990–3006 (2003). [DOI]
- 16.N. A. Peppas, P. Bures, W. Leobandung, and H. Ichikawa. Hydrogels in pharmaceutical formulations. Eur. J. Pharm. Biopharm.50:27–46 (2000). [DOI] [PubMed]
- 17.W. N. E. Van Dijk-Wolthuis, S. K. Y. Tsang, J. J. Kettenes-van den Bosch, and W. E. Hennink. A new class of polymerizable dextrans with hydrolyzable groups: Hydroxyethyl methacrylated dextran with and without oligolactate spacer. Polymer38:6235–6242 (1997). [DOI]
- 18.O. Franssen, L. Vandervennet, P. Roders, and W. E. Hennink. Chemically degrading dextran hydogels: controlled release of a model protein from cylinders and microspheres. J. Control. Rel.60:211–221 (1999). [DOI] [PubMed]
- 19.J. A. Cadée, C. J. de Groot, W. Jiskoot, W. den Otter, and W. E. Hennink. Release of recombinant human interleukin-2 from dextran-based hydrogels. J. Control. Rel.78:1–13 (2002). [DOI] [PubMed]
- 20.J. A. Cadée Brouwer, W. den Otter, W. E. Hennink, and M. J. A. van Luyn. A comparative biocompatibility study of microspheres based on crosslinked dextran or poly(lactic-co-glycolic)acid after subcutaneous injection in rats. J. Biomed. Mater. Res.56:600–609 (2001). [DOI] [PubMed]
- 21.R. J. H. Stenekes, O. Franssen, E. M. G. van Bommel, D. J. A. Crommelin, and W. E. Hennink. The preparation of dextran microspheres in an all-aqueous system: Effect of the formulation parameters on particle characteristics. Pharm. Res.15:557–561 (1998). [DOI] [PubMed]
- 22.R. J. H. Stenekes and W. E. Hennink. Equilibrium water content of microspheres based on cross-linked dextran. Int. J. Pharm.189:131–135 (1999). [DOI] [PubMed]
- 23.R. J. H. Stenekes, S. C. De Smedt, J. Demeester, G. Sun, Z. Zhang, and W. E. Hennink. Pore sizes in hydrated dextran microspheres. Biomacromol.1:696–703 (2000). [DOI] [PubMed]
- 24.R. J. H. Stenekes and W. E. Hennink. Polymerization kinetics of dextran-bound methacrylate in an aqeous two-phase system. Polymer41:5563–5569 (2000). [DOI]
- 25.J. T. Chung, K. D. F. Vlugt-Wensink, W. E. Hennink, and Z. Zhang. Effect of polymerization conditions on the network properties of dex-HEMA microspheres and macro-hydrogels. Int. J. Pharm.288:51–61 (2005). [DOI] [PubMed]
- 26.K. D. F. Vlugt-Wensink, T. J. H. Vlugt, W. Jiskoot, D. J. A. Crommelin, R. Verrijk, and W. E. Hennink. Modelling the release of proteins from degrading dex-HEMA microspheres using kinetic Monte Carlo simulations. J. Control. Rel.111:117–127 (2005). [DOI] [PubMed]
- 27.K. D. F. Vlugt-Wensink, Y. M. Meijer, M. van Steenbergen, R. Verrijk, W. Jiskoot, D. J. A. Crommelin, and W. E. Hennink. Effect of excipients on the encapsulation efficiency and release of human growth hormone from dextran microspheres. Eur. J. Pharm. Biopharm. DOI 10.1016/j.ejpb.2007.04.11 (2007). [DOI] [PubMed]
- 28.E. Y. Chen, Y. C. Liao, D. H. Smith, H. A. Barrera-Saldana, R. E. Gelinas, and P. H. Seeburg. The human growth hormone locus: nucleotide sequence, biology, and evolution. Genomics4:479–497 (1989). [DOI] [PubMed]
- 29.S. C. Van Buul-Offers, I. Ueda, and J. L. Van den Brande. Biosynthetic somatomedin C (SM-C/IGFI) increases the length and weight of Snell dwarf mice. Pediatr. Res.20:825–827 (1986). [DOI] [PubMed]
- 30.P. C. R. Hughes and J. M. Tanner. A longitudinal study of the growth of the black-hooded rat: methods of measurement and rates of growth for skull, limbs, pelvis, nose–rump and tail lengths. J. Anat.106:349–370 (1970). [PMC free article] [PubMed]
- 31.P. R. P. Salacinski, C. McLean, J. E. C. Sykjes, V. Clement-Josnes, and P. J. Lowrly. Iodination of proteins, glycoproteins and peptides using a solid phase iodinizing agent, 1,3,4,6-tertachloro-3 a, 6 a-diphenyl glycoluril (iodogen). Anal. Biochem.117:136–146 (1981).adioreceptor assay. [DOI] [PubMed]
- 32.L. S. Haro and F. J. Talamantes. Secreted mouse prolactin (prolactin) and stored ovine prolactin. II. Tole of amides in receptor binding and immunoreactivity. Endocrinology116:353–358 (1985b). [DOI] [PubMed]
- 33.K. Goji. Pulsatile characteristics of spontaneous growth hormone (GH) concventration profiles in boys evaluated by an ultrasensitive immonoradiometric assay: evidence for ultradian periodicity of GH secretion. J. Clin. Endocrinol. Metab.76:667–670 (1993). [DOI] [PubMed]
- 34.M. Rowland and T. N. Tozer. (eds.), Balado D. Clinical pharmacokinetics; concepts and applications. London: Lea & Febiger books, pp. 35–50 (1995).
- 35.O. J. Jorgensen. Human growth hormone replacement therapy: pharmacological and clinical aspects. Endocr. Rev.12:189–207 (1991). [DOI] [PubMed]
- 36.T. Laursen, J. Moller, J. O. Jorgensen, H. Orskow, and J. S. Christiansen. Bioavailability and bioactivity of intravenous vs subcutaneous infusion of growth hormone in GH-deficient patients. Clin.Endocrinol.45:333–339 (1996). [DOI] [PubMed]
- 37.T. C. Laurent. The Interaction between polysaccharides and other macromolecules. The solubility of proteins in the presence of dextran. Biochem. J.89:253–257 (1963b). [DOI] [PMC free article] [PubMed]
- 38.S. Van Buul-Offers and J. L. Van den Brande. Biosynthetic human growth hormone: effects on growth of Snell dwarf mice. Horm. Metab. Res.17:20–24 (1986). [DOI] [PubMed]
- 39.S. Van Buul-Offers and J. L. Van den Brande. The growth of different organs of normal and dwarfed Snell mice, before and during growth hormone therapy. Acta Endocrinol.96:46–58 (1981). [DOI] [PubMed]
- 40.L. S. Mathews, G. Norstedt, and R. D. Palmiter. Regulation of insulin-like growth factor gene by growth hormone. Proc. Natl. Acad. Sci. U. S. A.83:9343–9347 (1986). [DOI] [PMC free article] [PubMed]
- 41.P. Singh. Insuline-like growth factor system in growth, development and carcionegenisis. J. Clin. Ligand Assay23:214–232 (2000).
- 42.R. Monzavi and P. Cohen. IGFs and IGFBPs: role in health and disease. Best Pract. Res. Clin. Endocrinol. Metab.16:433–447 (2002). [DOI] [PubMed]
- 43.M. M. Rechler. Insuline-like growth factor binding proteins. Vitam. Horm.47:1–114 (1993). [DOI] [PubMed]
- 44.T. Laursen, J. O. Jorgensen, and J. S. Christiansen. Metabolic response to growth hormone (GH) administered in a pulsatile, continuous or combined pattern. Endocrinol. Metab.1:33–40 (1994).
- 45.V. Tillmann, L. Patel, M. S. Gill, A. J. Whatmore, D. A. Price, M. S. Kibirige, J. K. Wales, and P. E. Clayton. Monitoring serum insulin-like growth factor-I (IGF-I), IGF binding protein-3 (IGFBP-3), IGF-I/IGFBP-3 molar ratio and leptin during growtn hormone treatment for disordered growth. Clin. Endocrin.53:329–336 (2000). [DOI] [PubMed]
- 46.P. Park and P. Cohen. Insulin-like growth factor I (IGF-I) measurements in growth hormone (GH) therapy of iodopathic short stature (ISS). Growth Horm. IGF Res.15:S13–S20 (2005). [DOI] [PubMed]


