

Abstract
The use of heart rate measures in research requires accurate detection and timing of beat-to-beat values. Numerous technologies are available to researchers; however, benchmarking of a specific apparatus is seldom conducted. Since heart rate variability provides a portal to the neural regulation of the heart, accurate detection and timing of beat-to-beat values is essential to both basic physiological research and the clinical application of heart rate variability measures. The current study evaluated the accuracy of an ambulatory system, the LifeShirt® (Vivometrics), relative to a standard laboratory-based heart rate monitoring equipment (Biopac), during baseline and exercise conditions. LifeShirt® performed equivalently to the Biopac during both conditions, experienced few errors of detection, generated similar times between sequential heart periods, and produced similar summary indices of heart rate and heart rate variability.
Keywords: ambulatory monitoring, heart period, respiratory sinus arrhythmia, baseline, exercise
Accurate detection and timing of beat-to-beat heart rate is necessary in medical, psychophysiological, and physiological research. To obtain accurate measurements with msec accuracy, researchers have been limited to laboratory-based equipment. An ability to obtain accurate beat-to-beat measures of heart rate in an ambulatory device would provide important opportunities to evaluate the dynamic regulation of the heart in contexts consistent with naturally occurring demands. Vivometrics recently introduced a noninvasive physiological monitoring system (LifeShirt®) with capabilities to monitor multiple physiological parameters including R-R intervals and several respiratory parameters. While several researchers have used the LifeShirt® system in various studies (Grossman, 2004; Keenan, 2004; Keenan & Wilhelm, 2005a; Keenan & Wilhelm, 2005b; Wilhelm et al., 2003) or acknowledged the potential applicability of the LifeShirt® in future studies (Bruton & Thomas, 2006; Stefanov et al., 2004), the accuracy and precision of the LifeShirt® in the detection of beat-to-beat heart rate has yet to be tested against a standard laboratory-based heart rate monitoring equipment. Thus, the purpose of the study is to compare the accuracy and precision of heart rate detections by the ambulatory LifeShirt® with the values generated by a laboratory-based physiological monitoring system. The Biopac MP35 (Bipoac Systems, Goleta, CA, USA) was chosen as the standard for comparison, since it is frequently used as both a teaching and research tool, has been cited in over 1200 published articles (Search Engine: HighWire Press), and has a precision of timing R-R intervals to the nearest msec. The current study contrasts the R-wave detections from both systems during baseline and exercise conditions.
Methods
Data archive
The analyses used de-identified data from a data archive at the Brain-Body Center at the University of Illinois at Chicago. The data were collected from 15 individuals between 2003–2006 during routine benchmarking of equipment and the training of research assistants. The analyses and manuscript development were exempt by the University of Illinois at Chicago IRB. Age and other demographic information (gender, race, and ethnicity) were not collected, since these variables were not hypothesized to influence the goals of the study. All data were collected from individuals in good health.
Physiological measures
Heart period data were continuously recorded simultaneously using two different monitoring systems: LifeShirt® and Biopac. Each system required three self-adhering electrodes (Meditrace) placed directly onto the skin on the upper chest and on the lateral surface of the abdomen. The electrodes for each system were adjacent, but not overlapping. Each device applies a proprietary algorithm to detect the peak of the R-wave from the digitized ECG. The LifeShirt® samples the ECG at 200 Hz and the Biopac samples the ECG at 1000 Hz.
Procedure
The data were collected in a research room at the UIC Brain-Body Center. At the beginning of the study, participants were escorted to the restroom, and asked to remove their shirt to put on the LifeShirt®. Once the LifeShirt® was fitted, the participants returned to the research room, wherein the LifeShirt® was activated and the Biopac electrodes were attached. Heart period data were collected during two sequential conditions, baseline and exercise. The baseline condition was included to assess the accuracy of the LifeShirt® during periods of minimal movement. The exercise condition was included to assess accuracy of detection during a period of continuous movement when detections could be influenced by motion artifact. The clocks for the Vivometrics and Biopac systems were synchronized and the time was noted at the beginning and end of each condition.
During the baseline condition, participants were asked to sit on the seat of the recumbent stationary bicycle for 10 minutes. Participants were given the option to listen to music, read or sit quietly. Immediately following conclusion of baseline data collection, participants were asked to remain seated and slowly pedal the stationary bicycle for 10 minutes. Participants were asked to pedal 10–12 mph in order to minimize motion-related artifacts. Following the conclusion of the exercise condition, the electrodes and the LifeShirt® were removed and participants were thanked for their assistance.
Data analysis
The data analyses were structured to evaluate number of detection errors, msec deviations in the timing precision of R-R intervals, and deviations in commonly used summary statistics of heart rate and heart rate variability. Across all data files, a total of 11182 data points were analyzed during the baseline condition, and a total of 13082 data points were analyzed during the exercise condition.
R-wave detection errors
Sequential heart periods collected from LifeShirt® and Biopac were aligned in adjacent columns of a data spreadsheet for each participant for each condition. Errors were defined as a difference of more than 20 msec between LifeShirt® and Biopac data. Errors were assigned to one of five categories and resolved accordingly (Gamelin et al., 2006). A Type I error occurred when there was a single discrepant point between LifeShirt® and Biopac. A Type I error was resolved by replacing the erroneous LifeShirt® value with an interpolated value from the two adjacent LifeShirt® R-R intervals. A Type II error occurred when the LifeShirt® detected a long interval immediately followed by a short interval, and was resolved by averaging the two erroneous values. A Type III error occurred when the LifeShirt® detected a short interval immediately followed by a long interval, and was likewise resolved by averaging the two erroneous values. A Type IV error occurred when the value of a LifeShirt® data point was equivalent to 2 or 3 values in the Biopac data. The Type IV error was resolved by dividing the erroneous LifeShirt® data point by 2 or 3 (according to the number of R-waves detected.) A Type V error occurred when the value of 2 or 3 LifeShirt® data points were equivalent to 1 value in the Biopac data. The Type V error was resolved by summing the erroneous LifeShirt® data points. While the errors in the Biopac data were not categorized, the errors in the Biopac data were identified via visual screening of the data to identify large atypical increases and decreases in sequential R-R intervals that might be caused by ventricular arrhythmias or movement. These errors were resolved via integer arithmetic in a manner similar to the above description. Thus, files that required editing were corrected for both LifeShirt® and Biopac.
Timing precision of R-R interval
To determine the extent to which the data recorded from each system differed in the timing precision of sequential R-R intervals, difference scores were computed from data files collected from both systems. Absolute difference scores in msec were derived to describe differences between the LifeShirt® and Biopac for each sequential R-R interval.
Differences in commonly used summary statistics
Analyses were conducted to determine whether the slight beat-to-beat changes in R-R interval between the systems would influence commonly used summary statistics of heart rate and heart rate variability.
Time-domain analyses
For each data file, the mean R-R interval, mean heart rate, ln variance of the R-R intervals and the ln variance of amplitude of respiratory sinus arrhythmia (RSA) were calculated using MXedit software (Brain-Body Center, University of Illinois at Chicago). MXedit incorporates procedures developed by Porges (1985) that quantify the amplitude of RSA using parameters that are sensitive to the frequency of spontaneous breathing that are specific to each experimental condition. In the analysis of the baseline condition, (1) sequential R-R intervals were resampled into 500 msec intervals to produce time-based data; (2) the time-based series was detrended by a 21-point cubic moving polynomial (Porges & Bohrer, 1990); (3) the detrended time series was bandpassed to extract the variance in the R-R interval pattern associated with spontaneous breathing in adults (i.e., 0.12-.40 Hz); and (4) the natural logarithm (ln) of the variance of the bandpassed time series is calculated as the measure of the amplitude of RSA (Riniolo & Porges, 1997). In the analysis of the exercise condition, sequential R-R intervals were resampled into 250 msec intervals, then detrended by a 51-point cubic moving polynomial prior to the application of a bandpass filter associated with spontaneous breathing in adults during exercise (i.e., .12 – 1.00 Hz.) These procedures are statistically equivalent to frequency domain methods (i.e., spectral analysis) that sum the spectral densities in the frequency band associated with spontaneous breathing for the calculation of the amplitude of RSA when R-R interval data are stationary (Porges & Byrne, 1992). Ten minutes of R-R interval data for the LifeShirt® and Biopac were analyzed across all participants during each condition. Average R-R interval, average heart rate, ln variance and RSA were quantified across each entire condition (i.e., 600 second epochs).
Frequency-domain analyses
For each data file, the AR spectrum power (msec2) was computed using Biosignal software (University of Kuopio). A linear detrend (1st order) was applied to all data files prior to frequency analysis. The frequency bands, defining RSA (HF) for each condition, were identical to those used in the time-domain analyses for baseline and exercise (i.e., .12–40 Hz, .12-1.00 Hz). The interpolation rate was set at 4 Hz, and the AR model order was set at 16. The AR spectrum power was then transformed (using natural log) to stabilize the distribution of the spectral densities and to provide a metric comparable to the time-domain analyses.
Results
R-wave detection errors
For the entire data set of R-R intervals, only 3 detections errors occurred during the baseline condition in a data set consisting of 11,182 R-R intervals and only 24 detection errors occurred during the exercise in a data set consisting of 13,082 R-R intervals. LifeShirt® recorded few errors during the exercise condition (.18%), and fewer during the baseline condition (.03%).
The number and type of errors in the LifeShirt® data during each condition are displayed in Table 1 [insert Table 1]. Three errors in the LifeShirt® data could not be categorized as Type I – V. Thus, the Type VI error was defined as a cluster of erroneous data points that required multiple additions (5 or less) and a division to resolve. Two additional errors that could not be classified as Type I – VI occurred when there was a 38 msec difference between LifeShirt® and Biopac for two consecutive data points during exercise, but impossible to determine in which system the error occurred. To be conservative, the decision was made to neither count the points as errors nor resolve them in either data stream. The distribution of errors by participant during baseline indicated that three participants (S10, S11, and S14) each had 1 error. The distribution of errors by participant during exercise indicated that most of the errors were attributed to one participant (S10). This participant contributed 1 Type III error, 12 Type V errors, and 3 Type VI errors. One other participant (S2) had 2 errors, and 4 other participants (S3, S11, S12, and S15) had 1 error during exercise.
Table 1.
Description and distribution of errors in LifeShirt® data.
| Type of Error | Description of Error | Baseline (n = 11182) | Exercise (n = 13082) |
|---|---|---|---|
| I | Single interval of discrepancy | 0 | 0 |
| II | Long interval and short interval | 0 | 0 |
| III | Short interval and long interval | 1 | 3 |
| IV | Too few intervals detected | 1 | 0 |
| V | Too many intervals detected | 1 | 18 |
| VI | Complex error | 0 | 3 |
Timing precision of R-R interval
Deviation scores in msec were calculated by differencing the synchronized sequential R-R intervals from both systems. Standard deviation, range, and mean absolute deviation in msec of the difference between sequential R-R intervals for the two systems in participants who had data that did not require any editing in either the LifeShirt or the Biopac times series. [insert Table 2] The mean absolute deviations between the two systems ranged between .39 – 2.32 msec during baseline and between .46 – 3.29 msec during exercise. In general, for most participants with unedited data, the average deviation between the two systems during baseline or exercise was less than 1 msec (Table 2). Correlations between the sequential R-R intervals for LifeShirt® and Biopac, as presented in Table 2, uniformly approached unity.
Table 2.
Descriptive statistics (mean, SD, range) and correlations between LifeShirt® and Biopac data during baseline and exercise (unedited data only).
| Condition | Participant | SD of mean deviation (msec) | Range of mean deviation (msec) | Mean absolute deviation (msec) | Correlation |
|---|---|---|---|---|---|
| Baseline | 1 | .90 | −3 to 3 | .64 | 1.00 |
| 4 | .85 | −2 to 2 | .60 | 1.00 | |
| 5 | 2.90 | −9 to 8 | 2.32 | 1.00 | |
| 6 | .90 | −3 to 3 | .63 | 1.00 | |
| 7 | 1.33 | −4 to 4 | 1.02 | 1.00 | |
| 9 | .96 | −3 to 3 | .70 | 1.00 | |
| 12 | 1.62 | −4 to 4 | 1.29 | 1.00 | |
| 13 | .63 | −1 to 2 | .39 | 1.00 | |
| Mean (SE) | .95 (.22) | ||||
|
| |||||
| Exercise | 1 | 1.09 | −3 to 3 | .80 | 1.00 |
| 5 | 4.44 | −11 to 11 | 3.29 | .99 | |
| 7 | 1.61 | −5 to 5 | 1.25 | .99 | |
| 8 | 1.00 | −3 to 4 | .70 | 1.00 | |
| 13 | .70 | −2 to 2 | .46 | 1.00 | |
| 14 | .78 | −3 to 2 | .53 | 1.00 | |
| Mean (SE) | 1.17 (.44) | ||||
Bland-Altman plots for unedited data are presented in Figures 1 and 2. [insert Figures 1 and 2] Figure 3 and 4 illustrate the cumulative percentage of errors by deviation in msec during baseline and exercise. [insert Figures 3 and 4] Note that most of the participants asymptote within +/− 3 msec, while the same two participants (S5, S10) express greater deviations during both the baseline and exercise conditions.
Figure 1.
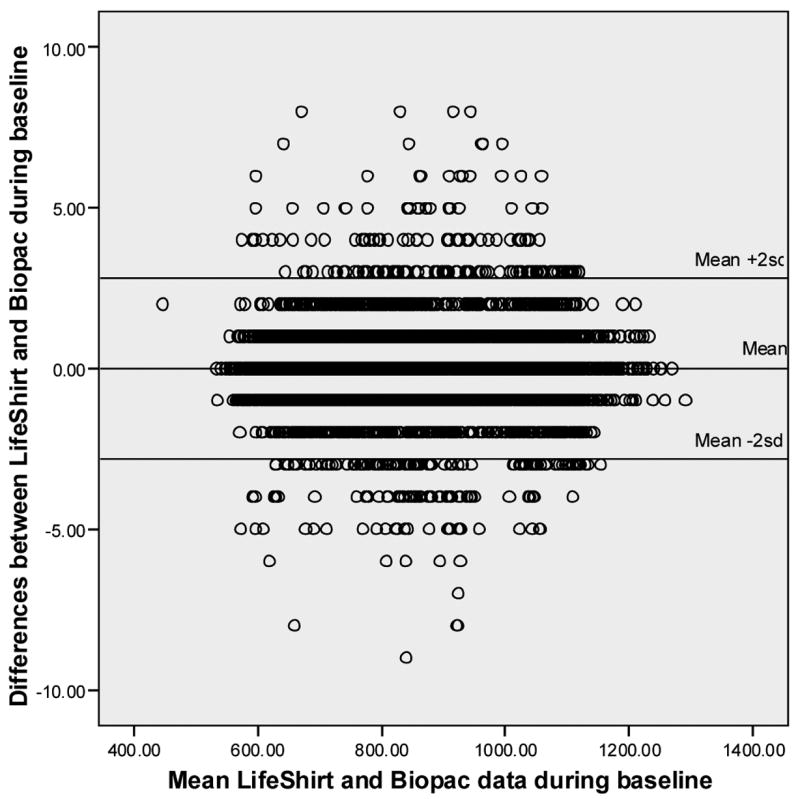
Bland-Altman plot for baseline data (unedited data only).
Figure 2.
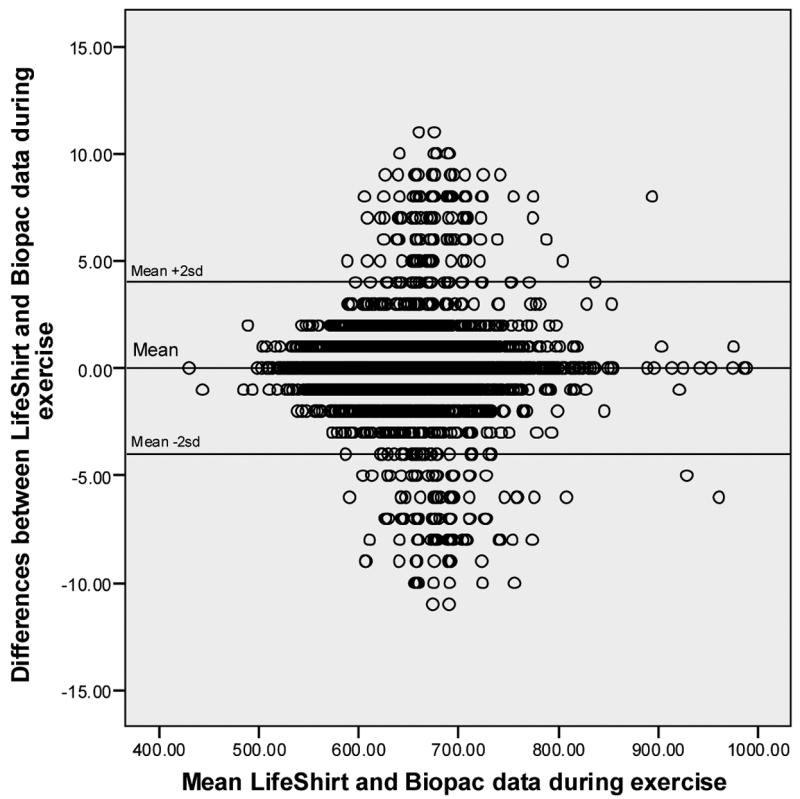
Bland-Altman plot for exercise data (unedited data only).
Figure 3.
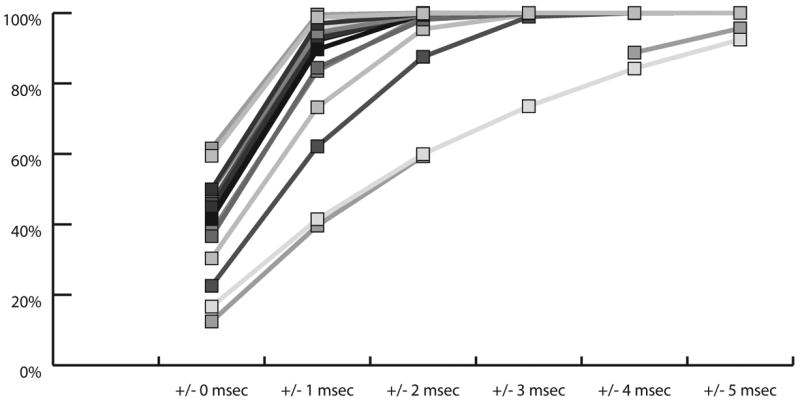
Cumulative percentage by deviation in msec for each participant during baseline.
Figure 4.
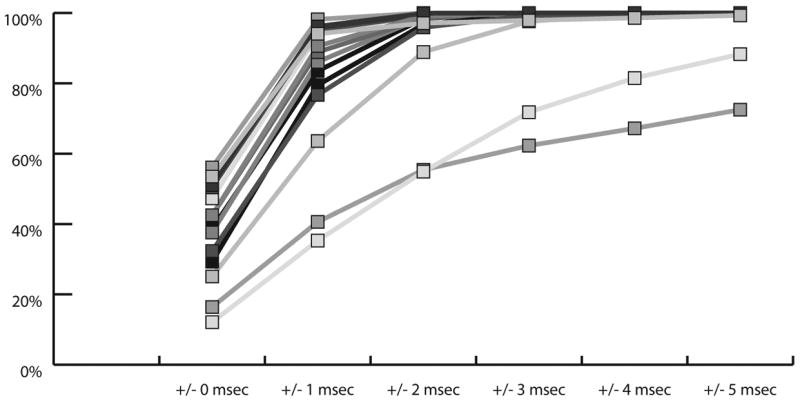
Cumulative percentage by deviation in msec for each participant during exercise.
Deviations of commonly used summary statistics
Summary statistics were generated from each participant during each condition. Average R-R interval, average heart rate, ln variance, ln RSA, and ln power (msec2) were calculated and are included in Table 3 (baseline condition) and Table 4 (exercise condition). [insert Tables 3 and 4] Although there are individual variations in the deviations between the two systems in timing R-R intervals, these small differences do not influence the descriptive statistics. In addition, the data requiring or not requiring editing of the detection errors during both conditions provided virtual identical estimates of the summary statistics.
Table 3.
Summary statistics, by participant, during the baseline condition.
| Participant | R-R interval (msec) | Heart rate | Ln variance | Ln RSA | Ln [Power(msec2)] | Participant | R-R interval (msec) | Heart rate | Ln variance | Ln RSA | Ln [Power(msec2)] |
|---|---|---|---|---|---|---|---|---|---|---|---|
| S1 | S9 | ||||||||||
| LS | 950.21 | 63.54 | 8.62 | 7.47 | 6.28 | LS | 800.23 | 75.20 | 7.53 | 5.21 | 3.47 |
| Biopac | 950.22 | 63.54 | 8.62 | 7.47 | 6.28 | Biopac | 800.24 | 75.20 | 7.54 | 5.21 | 3.50 |
| Difference | −.01 | 0 | 0 | 0 | 0 | Difference | −.01 | 0 | −.01 | 0 | −.03 |
| S2* | S10* | ||||||||||
| LS | 1099.61 | 54.72 | 8.14 | 6.81 | 5.37 | LS | 999.79 | 61.13 | 9.72 | 8.50 | 6.92 |
| Biopac | 1099.63 | 54.72 | 8.14 | 6.83 | 5.38 | Biopac | 999.80 | 61.13 | 9.72 | 8.50 | 6.92 |
| Difference | −.02 | 0 | 0 | −.02 | −.01 | Difference | −.01 | 0 | 0 | 0 | 0 |
| S3* | S11* | ||||||||||
| LS | 751.69 | 80.16 | 7.78 | 5.32 | 3.09 | LS | 765.58 | 78.92 | 8.29 | 6.58 | 5.43 |
| Biopac | 751.70 | 80.16 | 7.78 | 5.32 | 3.14 | Biopac | 765.59 | 78.92 | 8.29 | 6.58 | 5.42 |
| Difference | −.01 | 0 | 0 | 0 | −.05 | Difference | −.01 | 0 | 0 | 0 | .01 |
| S4 | S12 | ||||||||||
| LS | 671.71 | 89.55 | 7.05 | 4.69 | 1.61 | LS | 1055.59 | 57.02 | 8.08 | 6.43 | 5.21 |
| Biopac | 671.72 | 89.54 | 7.05 | 4.68 | 1.61 | Biopac | 1055.60 | 57.02 | 8.08 | 6.44 | 5.22 |
| Difference | −.01 | .01 | 0 | .01 | 0 | Difference | −.01 | 0 | 0 | −.01 | −.01 |
| S5 | S13 | ||||||||||
| LS | 854.44 | 71.56 | 9.43 | 8.29 | 7.30 | LS | 643.53 | 93.62 | 7.45 | 6.19 | 4.65 |
| Biopac | 854.45 | 71.55 | 9.43 | 8.30 | 7.30 | Biopac | 643.54 | 93.62 | 7.45 | 6.19 | 4.65 |
| Difference | −.01 | .01 | 0 | −.01 | 0 | Difference | −.01 | 0 | 0 | 0 | 0 |
| S6 | S14* | ||||||||||
| LS | 1037.86 | 58.52 | 9.38 | 7.57 | 6.52 | LS | 698.52 | 86.59 | 8.21 | 5.65 | 4.26 |
| Biopac | 1037.88 | 58.52 | 9.38 | 7.57 | 6.53 | Biopac | 698.51 | 86.59 | 8.21 | 5.67 | 4.25 |
| Difference | −.02 | 0 | 0 | 0 | −.01 | Difference | .01 | 0 | 0 | −.02 | .01 |
| S7 | S15* | ||||||||||
| LS | 758.46 | 79.68 | 8.34 | 7.06 | 5.42 | LS | 582.12 | 103.45 | 7.11 | 4.28 | 1.10 |
| Biopac | 758.47 | 79.68 | 8.34 | 7.07 | 5.43 | Biopac | 582.13 | 103.45 | 7.11 | 4.27 | 1.10 |
| Difference | −.01 | 0 | 0 | −.01 | −.01 | Difference | −.01 | 0 | 0 | .01 | 0 |
| S8* | |||||||||||
| LS | 939.55 | 64.43 | 8.92 | 7.36 | 5.92 | ||||||
| Biopac | 939.56 | 64.43 | 8.92 | 7.36 | 5.91 | ||||||
| Difference | −.01 | 0 | 0 | 0 | .01 | ||||||
required editing for detection errors
Table 4.
Summary statistics, by participant, during the exercise condition.
| Participant | R-R interval (msec) | Heart rate | Ln variance | Ln RSA | Ln [Power(msec2)] | Participant | R-R interval (msec) | Heart rate | Ln variance | Ln RSA | Ln [Power(msec2)] |
|---|---|---|---|---|---|---|---|---|---|---|---|
| S1 | S9* | ||||||||||
| LS | 634.59 | 95.25 | 8.05 | 5.66 | 4.37 | LS | 727.44 | 82.69 | 7.15 | 5.76 | 3.81 |
| Biopac | 634.60 | 95.25 | 8.05 | 5.65 | 4.37 | Biopac | 727.45 | 82.68 | 7.12 | 5.69 | 3.64 |
| Difference | −.01 | 0 | 0 | .01 | 0 | Difference | −.01 | .01 | .03 | .07 | .17 |
| S2* | S10* | ||||||||||
| LS | 832.32 | 72.17 | 6.66 | 5.90 | 4.26 | LS | 758.07 | 80.44 | 9.34 | 8.70 | 7.20 |
| Biopac | 832.34 | 72.17 | 6.67 | 5.91 | 4.26 | Biopac | 758.18 | 80.45 | 9.35 | 8.65 | 7.21 |
| Difference | −.02 | 0 | −.01 | −.01 | 0 | Difference | −.11 | −.01 | −.01 | .05 | −.01 |
| S3* | S11* | ||||||||||
| LS | 699.33 | 86.13 | 7.54 | 5.80 | 3.14 | LS | 597.02 | 100.75 | 6.86 | 5.71 | 3.66 |
| Biopac | 699.35 | 86.12 | 7.54 | 5.80 | 3.09 | Biopac | 597.01 | 100.75 | 6.86 | 5.71 | 3.76 |
| Difference | −.02 | .01 | 0 | 0 | .05 | Difference | .01 | 0 | 0 | 0 | −.10 |
| S4* | S12* | ||||||||||
| LS | 732.92 | 82.17 | 7.60 | 6.10 | 4.01 | LS | 829.00 | 72.62 | 7.72 | 5.65 | 3.93 |
| Biopac | 732.93 | 82.17 | 7.60 | 6.10 | 4.01 | Biopac | 829.01 | 72.63 | 7.72 | 5.68 | 3.97 |
| Difference | −.01 | 0 | 0 | 0 | 0 | Difference | −.01 | −.01 | 0 | −.03 | −.04 |
| S5 | S13 | ||||||||||
| LS | 681.94 | 88.25 | 7.29 | 6.43 | 3.71 | LS | 601.27 | 100.31 | 7.58 | 6.19 | 4.01 |
| Biopac | 681.96 | 88.25 | 7.29 | 6.42 | 3.74 | Biopac | 601.55 | 100.26 | 7.57 | 6.20 | 4.01 |
| Difference | −.02 | 0 | 0 | .01 | −.03 | Difference | −.28 | .05 | .01 | −.01 | 0 |
| S6* | S14 | ||||||||||
| LS | 802.55 | 75.21 | 8.27 | 6.97 | 5.38 | LS | 639.44 | 94.31 | 7.75 | 5.49 | 3.97 |
| Biopac | 802.56 | 75.21 | 8.27 | 6.97 | 5.37 | Biopac | 639.45 | 94.31 | 7.75 | 5.50 | 3.99 |
| Difference | −.01 | 0 | 0 | 0 | .01 | Difference | −.01 | 0 | 0 | −.01 | −.02 |
| S7 | S15* | ||||||||||
| LS | 638.96 | 94.20 | 7.21 | 6.37 | 4.69 | LS | 547.32 | 109.70 | 5.36 | 3.49 | 2.20 |
| Biopac | 638.95 | 94.20 | 7.21 | 6.35 | 4.68 | Biopac | 547.32 | 109.70 | 5.35 | 3.45 | 2.20 |
| Difference | .01 | 0 | 0 | .02 | .01 | Difference | 0 | 0 | .01 | .04 | 0 |
| S8 | |||||||||||
| LS | 690.01 | 87.25 | 7.45 | 5.96 | 4.43 | ||||||
| Biopac | 690.08 | 87.24 | 7.45 | 5.97 | 4.43 | ||||||
| Difference | −.07 | .01 | 0 | −.01 | 0 | ||||||
required editing for detection errors
Discussion
The above analyses demonstrate that the LifeShirt® is both accurate in the detection of R-waves and in the timing of R-R intervals during baseline and exercise in adults. The few errors of R-wave detection observed in the LifeShirt® data were easily detected and corrected. The exercise data contained only a few additional errors than the baseline data. The ambulatory LifeShirt® has several advantages over traditional laboratory-based heart rate monitoring systems in research areas related to sports, exercise and clinically relevant contexts such as work or performance environments. First, the LifeShirt® system is a self-contained system for the recording of physiological data including R-R intervals and several respiratory parameters. The system is mobile and can be worn outside of a research laboratory setting for data collection during naturalistic settings, such as walking, jogging or bicycling outdoors. Second, the LifeShirt® is able to simultaneously monitor several physiological systems and thus allowing for assessments of the interactions among various physiological parameters. Additionally, the LifeShirt® provides a measure of activity, an important covariate that should be considered in the interpretation of physiological variables. Even with a slower than optimal sampling rate (i.e., 200 Hz), the LifeShirt® algorithm for R-wave detection and the timing precision are sufficiently robust to provide summary statistics that are equivalent to the Biopac. In summary, the LifeShirt® system is highly accurate in the detection of R-waves, provides an accurate timing of R-R intervals, and has advantages over standard laboratory-based heart rate monitoring systems by facilitating the ambulatory applications and by providing the capability of monitoring several physiological systems simultaneously.
Acknowledgments
The project described was supported, in part, by grants MH 067446, MH 60625 and MH067631 from the National Institutes of Health. Its contents are solely the responsibility of the authors and do not necessarily represent the official views of NIH. We would like to thank Vivometrics (with special thanks to Mark Durston) for providing a LifeShirt® system for evaluation as described in the manuscript. We would also like to thank Alexis Kramer, Jocelyn Lebow and Kara Furman for assistance with data collection and analyses.
Footnotes
Publisher's Disclaimer: This is a PDF file of an unedited manuscript that has been accepted for publication. As a service to our customers we are providing this early version of the manuscript. The manuscript will undergo copyediting, typesetting, and review of the resulting proof before it is published in its final citable form. Please note that during the production process errors may be discovered which could affect the content, and all legal disclaimers that apply to the journal pertain.
References
- Bruton A, Thomas M. Breathing therapies and bronchodilator use in asthma. Thorax. 2006;61(8):643–645. doi: 10.1136/thx.2005.057422. [DOI] [PMC free article] [PubMed] [Google Scholar]
- Gamelin FX, Berthoin S, Bosquet L. Validity of the Polar S810 heart rate monitor to measure R-R intervals at rest. Medicine & Science in Sports & Exercise. 2006;35(5):887–893. doi: 10.1249/01.mss.0000218135.79476.9c. [DOI] [PubMed] [Google Scholar]
- Grossman P. The LifeShirt®: A multi-function ambulatory system monitoring health, disease, and medical intervention in the real world. Studies in Health Technology and Informatics. 2004;108:133–41. [PubMed] [Google Scholar]
- Keenan DB. Continuous monitoring of cardiac output from TCG signals. Biomedical Sciences Instrumentation. 2004;40:343–9. [PubMed] [Google Scholar]
- Keenan DB, Wilhelm FH. Classification of locomotor activity by acceleration measurement: Validation in Parkinson disease. Biomedical Sciences Instrumentation. 2005a;41:329–34. [PubMed] [Google Scholar]
- Keenan DB, Wilhelm FH. Adaptive and wavelet filtering methods for improving accuracy of respiratory measurement. Biomedical Sciences Instrumentation. 2005b;41:37–42. [PubMed] [Google Scholar]
- Porges SW. Method and apparatus for evaluating rhythmic oscillations in aperiodic physiological response systems. 4,510. US patent. 1985:944.
- Porges SW, Bohrer RE. Analyses of periodic processes in psychophysiological research. In: Caccioppo TJ, Tassinary LG, editors. Principles of Psychophysiology: Physical, Social, and Inferential Elements. New York: Cambridge University Press; 1990. pp. 708–753. [Google Scholar]
- Porges SW, Byrne EA. Research methods for measurement of heart rate and respiration. Biological Psychology. 1992;34(2–3):93–130. doi: 10.1016/0301-0511(92)90012-j. [DOI] [PubMed] [Google Scholar]
- Riniolo T, Porges SW. Inferential and descriptive influences on measures of respiratory sinus arrhythmia: sampling rate, R-wave trigger accuracy, and variance estimates. Psychophysiology. 1997;34(5):613–21. doi: 10.1111/j.1469-8986.1997.tb01748.x. [DOI] [PubMed] [Google Scholar]
- Stefanov DH, Bien Z, Bang WC. The smart house for older persons and persons with physical disabilities: Structure, technology arrangements, and perspectives. IEEE Transactions on Neural Systems and Rehabilitation Engineering. 2004;12(2):228–250. doi: 10.1109/TNSRE.2004.828423. [DOI] [PubMed] [Google Scholar]
- Wilhelm FH, Roth WT, Sackner MA. The LifeShirt®: An advanced system for ambulatory measurement of respiratory and cardiac function. Behavior Modification. 2003;27(5):271–91. doi: 10.1177/0145445503256321. [DOI] [PubMed] [Google Scholar]