Abstract
The outer dynein arms (ODAs) of the flagellar axoneme generate forces needed for flagellar beating. Elucidation of the mechanisms underlying the chemomechanical energy conversion by the dynein arms and their orchestrated movement in cilia/flagella is of great importance, but the nucleotide-dependent three-dimensional (3D) movement of dynein has not yet been observed. In this study, we establish a new method for reconstructing the 3D structure of the in vitro reconstituted ODA–microtubule complex and visualize nucleotide-dependent conformational changes using cryoelectron microscopy and image analysis. As the complex went from the rigor state to the relaxed state, the head domain of the β heavy chain shifted by 3.7 nm toward the B tubule and inclined 44° inwards. These observations suggest that there is a mechanism that converts head movement into the axonemal sliding motion.
Introduction
Cilia and flagella are elaborate organelles that play important roles in generating extracellular fluid currents in eukaryotes (Haimo and Rosenbaum, 1981; Goodenough and Heuser, 1985; Satir and Christensen, 2007). For example, left-right asymmetry in mammals is established by the nodal flow generated by the rotary movement of cilia (Hirokawa et al., 2006). The beating motion of cilia/flagella is driven by ciliary dyneins, which produce sliding forces between outer doublet microtubules (MTs) using ATP as an energy source (Gibbons, 1996). Elucidation of the mechanisms underlying the mechanochemical energy conversion by the dyneins is of great importance.
Since its discovery four decades ago (Gibbons and Rowe, 1965), the outer dynein arm (ODA) has been extensively studied by biochemical and structural methods. The Chlamydomonas reinhardii ODA molecule is composed of three heavy chains and several smaller proteins (Mitchell, 2000; DiBella and King, 2001; Kamiya, 2002), and its total mass is ∼2 MD. Isolated ODAs have three heads connected to a common base through thin stems (Goodenough and Heuser, 1982; Johnson and Wall, 1983; Tsukita et al., 1983; Witman et al., 1983). The head domain contains six tandemly linked AAA+ (ATPases associated with diverse cellular activities) modules, which form a ringlike structure (Neuwald et al., 1999; Samso and Koonce, 2004). Quick-freeze deep-etch (QFDE) EM studies of axonemes revealed that ODA has an elliptical head, which binds to the A tubule through two spherical feet (P foot and D foot), and a slender stalk that binds to the B tubule in an ATP-dependent manner (Goodenough and Heuser, 1982, 1984; Tsukita et al., 1983; Burgess, 1995; Lupetti et al., 2005). It has been hypothesized that the N-terminal stem and/or the stalk domains serve as lever arms that amplify ATP hydrolysis–dependent conformational changes within the head domain (Vallee and Gee, 1998; King, 2000; Asai and Koonce, 2001; Burgess et al., 2003; Kon et al., 2005; Reck-Peterson et al., 2006), but these hypotheses are based on studies of isolated dyneins in the absence of MTs. To elucidate the mechanism by which dynein generates force under physiological conditions, it is necessary to investigate the structural changes of MT-bound dyneins.
Recently, cryoelectron tomography revealed the 3D architecture of the axoneme and showed how ODAs and other components are arranged in situ (Nicastro et al., 2006); however, the tomograph only shows the structure in the rigor state. In addition, other components of the axoneme, such as the inner dynein arms, interdoublet links, and radial spokes, may affect the structural change of the ODA molecule. To elucidate mechanisms of power generation by ODA, it is therefore necessary to observe the nucleotide-dependent 3D conformational changes of ODA in the absence of other axonemal components.
In this study, we established a method for reconstructing the 3D structure of in vitro–reconstituted ODA–MT complexes and visualized their nucleotide-dependent conformational changes by cryo-EM and image analysis. By comparing the relaxed and rigor states of the ODA–MT complex, we observed the conformational changes that occur in the head domains. These results suggest that our system has a high potential to reveal the mechanism of dynein power generation.
Results
Characterization of the ODA–MT complex
To obtain dynein–MT complexes suitable for 3D reconstruction, we reconstituted the ODA–MT complex in vitro. This complex has a structure similar to the axoneme, is periodically decorated with ODAs, provides many views necessary for 3D reconstruction, and has MT translocation activity.
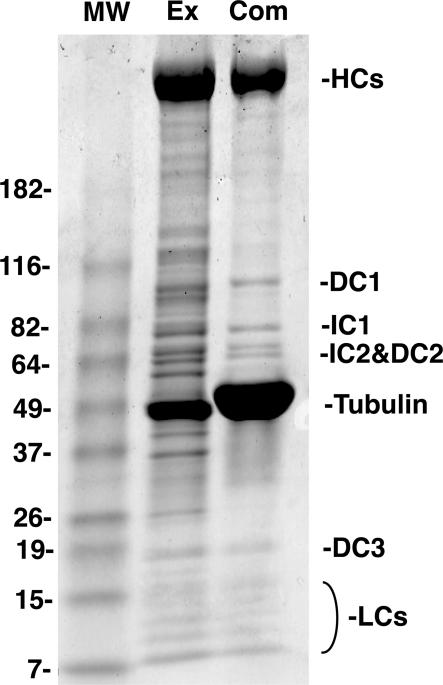
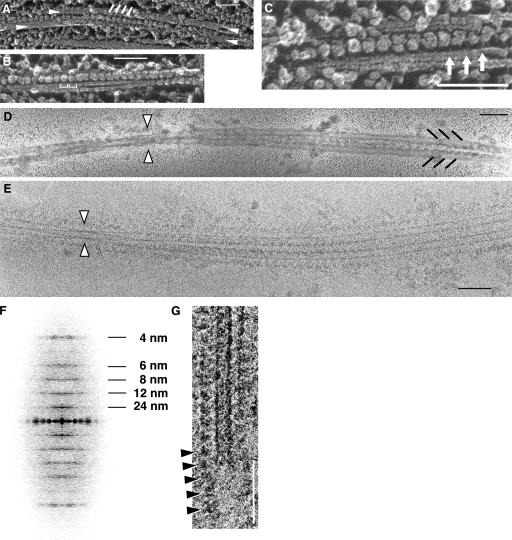
The dynein–MT complex is formed by copolymerizing tubulin in the presence of axonemal dyneins from C. reinhardii (Haimo et al., 1979). SDS-PAGE analysis of the complex suggests that it contains the heavy, intermediate, and light chains as well as the docking complex (Fig. 1; Sakato and King, 2004). Because two MTs are cross-bridged by ODA, we refer to the complex as the ODA–cross-bridged MT (ODA–CB-MT) complex. QFDE-EM observation of the ODA–CB-MT complex revealed that, like axonemes, ODA has a longitudinal 24-nm periodicity (Fig. 2, A–C; Goodenough and Heuser, 1982; Tsukita et al., 1983). The globular ODA molecules align along a MT (Fig. 2 B) and extend stalks to the other MT (Fig. 2 C, arrows).
Figure 1.
SDS-PAGE analysis of the ODA–CB-MT complex. The high-salt extract from Chlamydomonas axonemes (Ex) and the purified ODA–CB-MT complex (Com) were separated by SDS-PAGE and stained with Coomassie brilliant blue. HCs, heavy chains; DC1–3, docking complex protein 1–3; IC1/2, intermediate chain 1/2; LCs, light chains; MW, molecular weight marker.
Figure 2.
EM images of the ODA–CB-MT complex by QFDE, negative-staining, and cryo-EM. A–C, QFDE; D, negative staining; E, cryo-EM. (A) A pair of cross-bridged MTs, as indicated by the arrowheads. The white lines show the row of ODAs. (B) The 24-nm periodicity is indicated by brackets. (C) The globular heads and the thin stalks (arrows) are shown. (D and E) The crossover points are indicated with arrowheads. The black lines indicate the ODAs. (F) The averaged diffraction pattern of the cryo-EM images of five ODA–CB-MT complexes showing the prominent 24-nm layer line. The layer line periodicities are indicated. (G) The interdynein connections observed by cryo-EM. The row of ODAs extending past the end of the MT is indicated with arrowheads. Bars, 100 nm.
When we observed the ODA–CB-MT complex by negative staining and cryo-EM, we found that two MTs twist over each other (Fig. 2, D and E; arrowheads). This twisting provides many views of the complex, allowing 3D reconstruction. The computed diffraction pattern of the cryo-EM image again shows a uniform 24-nm periodicity (Fig. 2 F). The distance between the two MTs of the ODA–CB-MT complex is 24 nm, which is the same as that observed by cryo-electron tomography of the axoneme (Nicastro et al., 2006). The moiré pattern of the MTs shows that both of the MTs in the complex have the same polarity (Sosa and Chretien, 1998).
3D reconstruction of the ODA–CB-MT complex
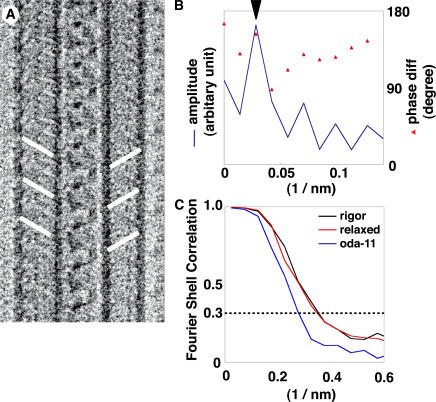
To reconstruct the 3D structure of the ODA–CB-MT complex, we first determined the helical arrangement of the complex from its cryo-EM images. In the layer line–filtered image (Fig. 3 A), the two rows of ODA molecules are staggered. This arrangement was also quantitatively confirmed by comparing the near- and far-side layer line at 24 nm. In principle, the phase difference between the two sides allows the determination of whether the left- and right-side ODAs is in phase (0°) or out of phase (180°; Moore et al., 1970). Judging from the phase difference at the amplitude peak (Fig. 3 B, arrowhead), ODAs are staggered as shown in Fig. 3 A. Therefore, we concluded that the complex has a twofold screw symmetry along its longitudinal axis.
Figure 3.
Arrangement of ODAs within the ODA–CB-MT complex and resolution estimation of the reconstructions. (A) A 24-nm filtered cryo-EM image of the ODA–CB-MT complex showing the staggered arrangement of the ODAs. Lines indicate the positions of ODAs. (B) An amplitude and phase plot of the 24-nm layer line from the ODA–CB-MT complex. Phase diff: the phase difference between the near and far sides. The theoretical phase difference is 180° if the two rows of ODAs are staggered. Amplitude: the amplitude of the layer line. The phase value at the amplitude peak (arrowhead) indicates the staggered arrangement of the ODAs. (C) The Fourier shell correlation curves for each reconstruction. The intersection between each curve and the horizontal line at 0.3 was taken as the effective resolution. The effective resolutions are 2.7 nm, 2.7 nm, and 3.5 nm for the rigor state, the relaxed state, and the oda-11 mutant, respectively.
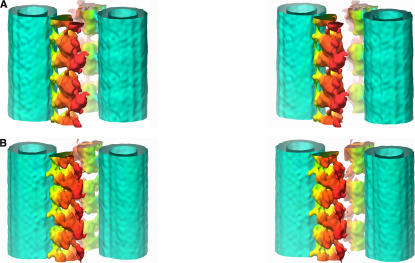
Using this helical arrangement, we reconstructed the 3D structure of the ODA–CB-MT complex (Fig. 4 A and Video 1, available at http://www.jcb.org/cgi/content/full/jcb.200609038/DC1). Because the long twisting of the two MTs does not always follow the ideal helical symmetry, we combined single-particle analysis and helical image analysis to correct the distortions. We divided the images into 48-nm-long segments and calculated the rotation on the longitudinal axis from the distance between the two MTs. Translational alignment of the segments along the longitudinal axis was based on the 24-nm periodicity. Therefore, no assumption was made regarding the ODA structure. After 10–15 cycles of refinements, the 3D structures converged, and the effective resolution was determined to be 2.7 nm for the wild-type complex in the rigor state from the Fourier shell correlation (Fig. 3 C; van Heel, 1987).
Figure 4.
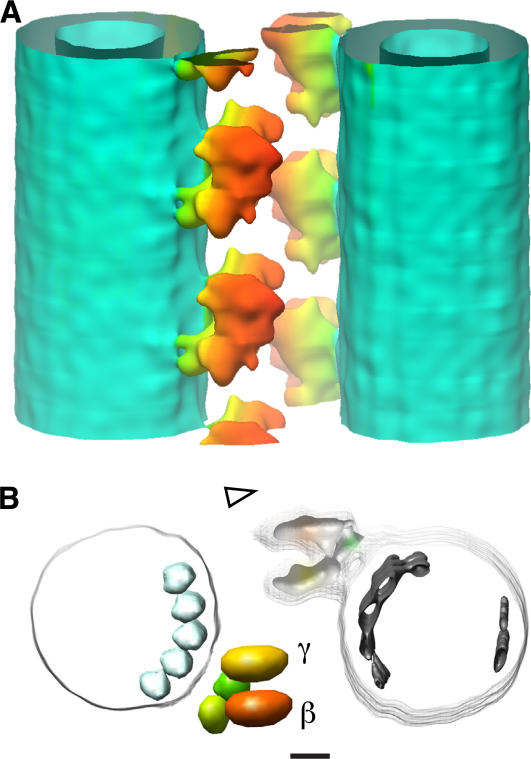
3D reconstructions of the ODA–CB-MT complex from the wild type in two nucleotide states. A, rigor state; B, relaxed state. Stereo pairs are presented. The color reflects the distance from the center of the MT. The surfaces represent the isosurface of 120% of the volume estimated from the molecular weight of ODA.
Domain organization of ODA
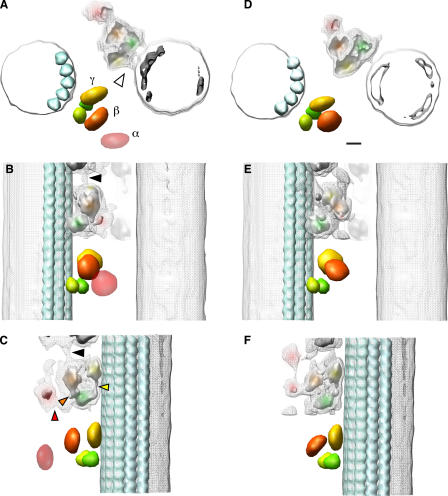
Understanding the domain organization of ODA is essential for interpreting its structural changes. The end-on view of the ODA–CB-MT complex shows a pair of MTs cross-bridged by two rows of ODA molecules (Fig. 5 A). The 3D structure of the ODA–CB-MT complex in the rigor state is roughly divided into four domains: the α, β, and γ head domains and a base complex (Fig. 5, A–C). The stalk domain, which binds to MTs in a nucleotide-dependent manner (Johnson, 1985), should be located between the head domains and the B tubule. Although the stalk is visible in the quick-freeze replica (Fig. 2 C), it did not appear in the 3D reconstruction, possibly because of its flexibility and its thin structure. An ODA molecule binds to the A tubule through a thicker end, which we refer to as a base complex (Fig. 5, A–C; faint green densities). The base complex may contain two intermediate chains, which have WD repeat domains (Fig. 5, A–C; green bodies; Ogawa et al., 1995; Wilkerson et al., 1995; Madrona and Wilson, 2004).
Figure 5.
3D reconstructions of the ODA–CB-MT complex in the rigor state and in the relaxed state. A–C, rigor state; D–F, relaxed state. (A and D) The views from the plus end of the MT. (B and E) The side views with the plus end up. (C and F) The 120° rotated side view seen from the inside of the complex. The mesh and solid surfaces represent the isosurface of 120% and 60% volumes, respectively, estimated from the molecular weight of ODA. The domains and fitted objects are colored as follows: the α head is pink, the β head is orange, the γ head is yellow, the base complex is green, and the MTs are light blue. The dark gray isosurface (A and D) shows the position of the protofilaments. The disk-shaped objects were placed according to the center of gravity of the head domain densities, and spherical objects were manually fitted to the densities of the base complex. The atomic models of the tubulins (Lowe et al., 2001) were fitted to the densities of the MT protofilaments (gray). The black arrowheads in B and C indicate the positions of the interdynein connections. The arrowhead in A indicates the position of the connection between the γ head domain and the MT. The red arrowhead in C indicates the connection between the α and β head domains. The orange and yellow arrowheads indicate the base complex β head domain and the base complex γ head domain connections, respectively. In C and F, the β head domain tilts 44° toward the MT in the relaxed state. Bar, 5 nm.
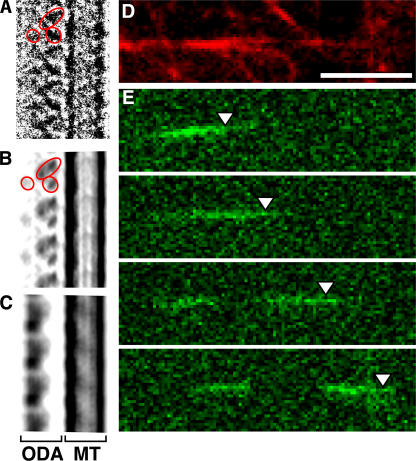
To determine which side of the ODA–CB-MT complex harbors the ATP-sensitive MT-binding sites of ODA (Johnson, 1985), the complex was treated with 20 μM ATP and observed by cryo-EM (Fig. 6 A). Because ATP treatment disrupts the ATP-sensitive binding of the ODAs, in the presence of ATP, the cross-bridged MTs separate, whereas the ATP-insensitive binding remains intact (Haimo and Rosenbaum, 1981). Haimo and Rosenbaum (1981) also reported that ATP depolymerizes the MTs. To prevent this depolymerization, the MTs were stabilized by the addition of taxol. The cryo-EM image of this hemicomplex showed that the 24-nm periodicity of the ODAs was unaffected by ATP treatment. We compared the averaged cryo-EM image of the hemicomplex with different projections from the 3D reconstruction of the ODA–CB-MT complex. We found that the characteristic triangular shape of the ODA density is also seen in the projection of the ODA bound to the MT by its base complex side (Fig. 6 B). The similarity in the 2D projection was also supported by the high cross-correlation value between the cryo-EM image of the hemicomplex and the projection of ODA. These results demonstrate that the base complex side of ODA–MT binding is ATP insensitive, which is consistent with the findings by Johnson (1985).
Figure 6.
Demonstration of the motility of the ATP-treated ODA–CB-MT complex. (A) A cryo-EM image of the ATP-treated ODA–CB-MT complex. The ODA–CB-MT complex was treated with 20 μM ATP for 3 min before freezing. The signal of the ODA was enhanced by averaging seven molecules. The overall shape appears triangular. (A and B) The red circles indicate the domains of ODA. (B) A 2D projection of the 3D reconstruction of the ODA–CB-MT complex in the rigor state representing the view in which the ODA is bound to the MT by its base side. The projection resembles the image in A in the position of the domains and the triangular shape. (C) A projection representing the view in which the ODA is bound to the MT by its stalks. (D and E) In vitro motility assay of the ODA–MT complex. (D) The AlexaFluor543-labeled ODA–CB-MT complex was treated with 20 μM ATP and immobilized on the glass coverslips (red). (E) An image sequence of the AlexaFluor488-labeled plain MT (green) showing an MT sliding along the ODA–CB-MT complex. The time interval between each image is 0.5 s. The arrowheads indicate a reference point on the sliding MT. Bar, 5 μm.
To examine the motor activity of the ODAs in the ODA– CB-MT complex, we performed a motility assay using the ATP-treated ODA–MT complex. We attached the AlexaFluor543-labeled ODA–MT complex onto a glass coverslip (Fig. 6 D, red) and applied AlexaFluor488-labeled plain MTs (Fig. 6 E, green). MT translocation was initiated by the addition of 100 μM ATP. All of the sliding MTs translocated along the ODA–MT complex (Fig. 6 E, arrowheads; and Video 3, available at http://www.jcb.org/cgi/content/full/jcb.200609038/DC1). The sliding velocity by the ODA–MT complex was 4.0 ± 2.6 μm/s (n = 20), which is similar to that by the αβ particle of ODA (Sakakibara and Nakayama, 1998). This result demonstrates that the row of ODAs in the ODA– CB-MT complex has motor activity.
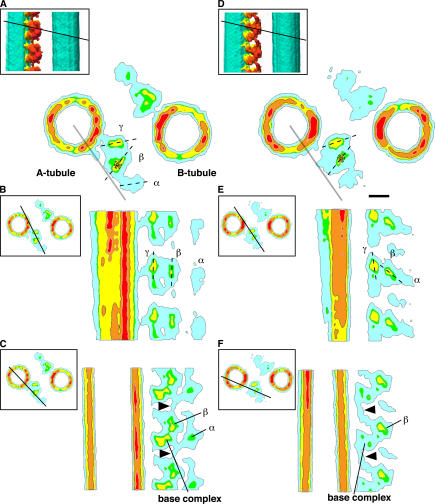
The three heavy chains of ODA have different structures and functions (King et al., 1985; Marchese-Ragona et al., 1989; Sakakibara et al., 1991, 1993; Sakakibara and Nakayama, 1998). To assign α, β, and γ heavy chains, we compared the 3D structures between the wild type and the oda-11 mutant (Fig. 7). The lack of an α heavy chain in oda-11 appeared as a loss of the outermost density in the top view of the ODA–CB-MT complex (Fig. 7 B, arrowhead). Together with the thin-section EM study by Sakakibara et al. (1991), this allowed assignment of the α, β, and γ heavy chains from the outermost to innermost positions (Fig. 5 A). If viewed from the side, the planes of the head domain rings appear parallel to the longitudinal axis of the MT (Figs. 5 C and 8 B), which is consistent with recent observations by Nicastro et al. (2006). The top view (Fig. 5 A) and cross section (Fig. 8 A) of our reconstruction also revealed that the planes of the head domain rings are not exactly parallel but rather tangential to the circumference of the B tubule (Figs. 5 A and 8 A). In addition, the three head domains are offset from each other longitudinally (Figs. 5 C and 8 B). The disk-shaped objects in the densities of the head domains (Fig. 5) summarize the aforementioned interpretations. The positions and orientations of the disks were determined from the center of gravity and the long axis of the densities, respectively (Fig. 8, A, B, D, and E).
Figure 7.
3D reconstruction of the ODA–CB-MT complex from the oda-11 α heavy chain–lacking mutant in the rigor state. (A) A stereo pair of the 3D reconstruction with the plus end up. (B) The view from the plus end of the MT. The arrowhead indicates the expected position of the α heavy chain densities. Bar, 5 nm.
Figure 8.
Cross sections of the ODA–CB-MT complex in the rigor state and in the relaxed state. A–C, rigor state; D–F, relaxed state. The plane of each section is indicated in the top left corner (solid lines). The nucleotide-induced displacement (A and D) and inclination (B and E) of the β head domain is shown. The dotted lines indicate the long axes of the head domains. (A and D) The asterisks indicate the centers of gravity of the β head domain. The gray lines are placed as a reference. The β head domain in the relaxed state displaced 3.7 nm compared with its position in the rigor state. The position of the inter-ODA linker is indicated with arrowheads in C and F. The blue contour corresponds to the 120% volume isosurface; green, yellow, orange, and red indicate increasing density. Bar, 10 nm.
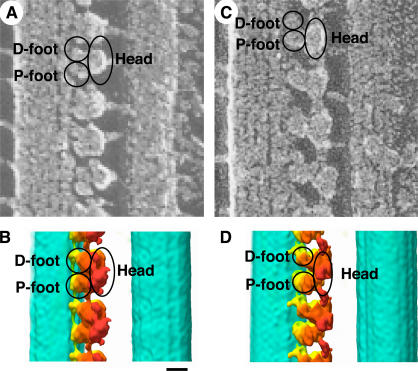
We correlated the surface structures observed by QFDE-EM with our 3D structure (Fig. 9; Goodenough and Heuser, 1982). The elliptical head corresponds to the α head domain and a part of the β head domain. The boundary between the α and β head domains appears as a medial cleft within the head by QFDE-EM (see Figs. 7 and 8 in Goodenough and Heuser, 1982). The D foot corresponds to the γ head domain and part of the β head domain, and the P foot corresponds to the base complex.
Figure 9.
A comparison of the QFDE-EM images of the axoneme and the corresponding views of the ODA–CB-MT complex in the rigor state and in the relaxed state. (A and C) QFDE-EM images of the axoneme (Goodenough and Heuser, 1982). (B and D) Corresponding views of the ODA–CB-MT complex. Views in the rigor state (A and B) and in the relaxed state (C and D). The densities corresponding to the D foot, P foot, and head are indicated. Bar, 10 nm.
Interdomain connections
The interdomain connections (Fig. 5, A–C; arrowheads) indicate that the three heavy chains are functionally distinct. The α head domain is connected to the base complex (Fig. 5 C, red arrowhead). The β head domain has two densities extending to the base complex: one density extends toward the base complex within the same ODA molecule (Fig. 5, B and C; orange arrowhead), and the other extends toward the adjacent base complex (Fig. 5, B and C; and Fig. 8, C and F; arrowheads). ODAs are connected even in the absence of MTs (Fig. 2 G), suggesting that the inter-ODA connection is stable. The γ head domain is connected to the base complex (Fig. 5 C, yellow arrowhead) and also directly binds to the MT (Fig. 5 A, arrowhead). These observations suggest functional differentiation among the three head domains (see Discussion).
Nucleotide-induced conformational changes
To observe the ODA–CB-MT complex in the relaxed state, we analyzed it in the presence of ATP and vanadate (Fig. 4 B and Video 2, available at http://www.jcb.org/cgi/content/full/jcb.200609038/DC1). It is known that the addition of ATP to vanadate-treated axonemes causes them to straighten and reduces their elastic bending resistance, which is referred to as the relaxation of axonemes (Sale and Gibbons, 1979; Okuno, 1980). Treatment with ATP and vanadate also causes large structural changes of ODA (Goodenough and Heuser, 1982; Tsukita et al., 1983; Burgess, 1995). To prepare the ODA–CB- MT complex in the relaxed state, we treated the complex in the rigor state with vanadate and ATP. The complex retained the cross-bridging, and the radius of the complex in the relaxed state did not change. Therefore, we applied the same image analysis methods as for the rigor state.
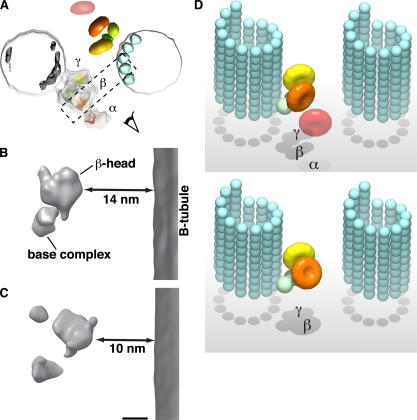
The conformational changes are different among the three head domains (Figs. 5 and 8, D–F). The density of the α head domain is unclear (Fig. 5 F), probably because of high heterogeneity. The center of gravity of the β head domain shifted 3.7 nm toward the B tubule (Fig. 8, A and D), and its head plane inclined 44° inward (Fig. 8, B and E) compared with its conformation in the rigor state. In contrast, the γ head domain remained in almost the same position as in the rigor state (Fig. 8, A and D). As a result of the conformational change, the distance between the β head domain and the B tubule became shorter (Fig. 5, A and D; and Fig. 10, B–D), from 14 nm in the rigor state to 10 nm in the relaxed state. Considering the reported length of the stalk domain (∼15 nm; Goodenough and Heuser, 1982, 1984; Gee et al., 1997), the change in the distance may affect the orientation of the stalk domain.
Figure 10.
Head domain displacement between the rigor state and the relaxed state. (A) An end-on view of the 3D reconstruction of the ODA–CB-MT complex in the rigor state. The box used for the slab view in B and C is shown as a dashed rectangle. (B and C) A comparison between the β head domains in the rigor state (B) and the relaxed state (C) showing the change in distance to the B tubule. The double arrows indicate the changes of distance between the β head domain and B tubule from 14 (rigor state) to 10 nm (relaxed state). (D) Model images of the ODA–MT complex in the rigor state (top) and the relaxed state (bottom). The α head domain is omitted from the relaxed state because of the uncertainty of the position. Bar, 5 nm.
Our reconstruction and the QFDE-EM image in the relaxed state are similar except for the D foot (Fig. 9, C and D). The D foot in the QFDE-EM image is apart from the P foot of the adjacent ODA. In our reconstruction, the D foot, which corresponds to the γ head domain and part of the β head domain, is close to the next P foot, which corresponds to the base complex. The difference in ATP concentration (1 mM for the QFDE-EM image and 2 μM for our reconstruction) may be the reason for the different appearance.
Discussion
This study establishes that the ODA–CB-MT complex is suitable for reconstructing the 3D structure of dynein from cryo-EM images. Our reconstruction revealed the detailed 3D arrangement of the ODA complex and the conformational changes between ODAs in two functionally critical states without the influence of other axonemal proteins.
The elaborate interdomain linkers and nucleotide-induced conformational changes of the ODA indicate that the three head domains have different functions. The appearance of the α head domain both in the rigor and relaxed states suggests that it is more flexible than the other two head domains, which may be related to a proposed regulatory function (Sakakibara and Kamiya, 1989; Sakakibara et al., 1991; Sakato and King, 2004). The β heavy chain may be important for synchronized movement of ODAs along the axoneme by communication through the inter-ODA connections. Given that the swimming velocity of the oda-11 α heavy chain–missing mutant is slightly slower than that of the wild type (Sakakibara et al., 1991), the nucleotide-induced movement of the β head domain presumably generates major force for the sliding. The γ head domain, which showed little displacement, may serve as a stable anchor to the A tubule.
This displacement of the β head is a new observation, and it is distinct from the rotation of the head proposed by Burgess et al. (2003). Because their hypothesis is based on the negative-staining EM of isolated dynein in the absence of MTs, the movement of dynein relative to the MT cannot be observed; however, it is possible that both the rotation and the displacement occur at the same time and that they amplify the sliding speed.
Because the β head domain displaced vertically in the direction of sliding, there should be a mechanism for converting the direction of the movement. The stalk domain is the most probable candidate for mediating this conversion because it bridges the head domain and the B tubule. One possible explanation for how the stalk domain converts the movement of the head domain is as follows: if the stalk length is constant, the angle of the stalk is a function of distance between the head domain and the MT. For example, if the stalk length is 15 nm, the 3.7-nm movement of the head domain results in a 40° rotation of the stalk, which can produce a 7-nm sliding movement at the stalk head. To investigate these possibilities, the orientation of the head domain and stalk must be determined by specific labeling (for example, by using antibodies).
In the 3D reconstructions and in the aforementioned discussions, we assumed that most of the ODAs were in the relaxed state. This assumption is supported by our EM observations as well as previous biochemical data (described in this paragraph). When ODA and tubulin are copolymerized, there is more than one type of ODA–MT complex (Haimo et al., 1979). For structural analysis, we used the ODA–CB-MT complex, but it also contains ODAs complexed with single MTs as shown in Fig. 2 G. In this ODA–single MT complex, ODAs are bound to MTs by their stalks. All of these ODAs seem to dissociate from the MTs upon treatment with ATP and vanadate because we did not observe single MTs decorated by ODA via its stalk in the same grids, in which we collected cryo-EM images of the ODA–CB-MT complex (unpublished data). This demonstrates that stalk-side binding of most ODAs became weak after the ATP-vanadate treatment, which agrees with the finding of Shimizu and Johnson (1983b). It is also consistent with previous biochemical data: according to Shimizu and Johnson (1983a), 2 μM is the lowest concentration of ATP that can completely dissociate ODA from MTs within 1 s. Furthermore, according to kinetic studies of dynein, the rate constants of ATP binding, ATP hydrolysis, phosphate release, and vanadate binding are all faster than 8/s in our condition (Johnson, 1983; Porter and Johnson, 1983; Shimizu and Johnson, 1983a; Tani and Kamimura, 1999). As we incubated the ODA–CB-MT complex with ATP-vanadate for 10–15 s, <1% of ODA should have remained in the rigor state. Although the occurrence of the cross-bridging even in the relaxed ODA–CB-MT complex is perplexing, we think that the cross-bridging of the two MTs is maintained by the sum of many weak ODA–MT interactions.
The arrangement of ODAs in the ODA–CB-MT complex also raises the concern that the sliding directions induced by the two rows of ODA are antagonistic and should cause distortion of the complex. As we show in this study, cross-bridging of the ODA–CB-MT complex was retained in the presence of ATP and vanadate probably because ODA was in the presliding state and did not exert force in this nucleotide state. It seems that phosphate release from ODA in the ADP + Pi state is required to separate the cross-bridging, as shown in Fig. 6 A. These results are consistent with other biochemical data showing that ATP and vanadate inhibit the MT sliding (Sale and Gibbons, 1979; Satir et al., 1981; Warner and Mitchell, 1981) and that force generation is suggested to require the release of phosphate (Johnson, 1983; Johnson et al., 1984; Kon et al., 2005). Therefore, it is reasonable to assume that our relaxed structure represents the presliding state.
In a recent study, cryo-electron tomography was applied to study axoneme structures, including ODA (Nicastro et al., 2006). Although their overall architecture of ODA in the rigor state is quite similar to our reconstruction, there are minor differences in the assignment of the molecular boundary and of the inter-ODA linker to a particular heavy chain. Nicastro et al. (2006) did not show the position of the base complex relative to the head domains in the tomograph of the C. reinhardii axoneme tomograph. In the present study, we assigned the base complex to the minus end side of the head domains (Fig. 5, green spherical objects). This assignment is based on the globular shape of ODA and the molecular boundary between adjacent molecules (Figs. 4 and 5 and Video 1) and is consistent with the QFDE-EM study (Fig. 9; Goodenough and Heuser, 1982). Future high-resolution studies on isolated ODA complexed with MTs may be needed to clarify the domain assignments.
Nicastro et al. (2006) also interpreted that ODA molecules are connected along the MT by an outer outer dynein linker, which extends diagonally from the α head domain to the neighboring γ head domain (see Fig. 5 D in Nicastro et al., 2006). In our map, the inter-ODA linker, which is functionally equivalent to outer outer dynein, seems to connect the β head domain and the neighboring base complex. A similar inter-ODA linker was also observed by QFDE-EM (see Fig. 6 in Goodenough and Heuser, 1982). The difference between the interpretations of Nicastro et al. (2006) and our study could result from the loss of some axonemal proteins during salt extraction. For example, a cape structure of ODA in the Tetrahymena thermophila axoneme (see Fig. 4 in Avolio et al., 1984) appears to be missing in the reconstituted ODA–MT complex (Fig. 6 B; see Fig. 7 C in Avolio et al., 1984). This cape structure looks similar to the outer outer dynein linker observed by Nicastro et al. (2006) in that it extends diagonally from the α head domain.
We anticipate that our new 3D reconstruction method will serve as a starting point for the more detailed analysis of the dynein power generation mechanism. The future combination of ODA mutants, antibody labeling, and our reconstruction method will reveal the complicated subunit organization and regulation within the ODA. Given the complexity of the axoneme, both bottom-up (e.g., this study) and top-down (studies of whole axonemes) approaches are essential.
Materials and methods
Strains
The C. reinhardii 137c strain and the oda-11 mutant strain, which lacks the α heavy chain and the 16-kD light chain, were provided by R. Kamiya (University of Tokyo, Tokyo, Japan) and S.M. King (University of Connecticut Health Center, Farmington, CT), respectively.
Preparation of the ODA–CB-MT complex
Axonemes were obtained from wild type (137c) and the oda-11 mutant C. reinhardii by the dibucaine method (Witman et al., 1978; Kagami and Kamiya, 1992). The axoneme extract was desalted using a Sephadex G-25 gel filtration column equilibrated in PEM buffer (100 mM Pipes-NaOH, pH 6.8, 1 mM MgCl2, and 1 mM EGTA). The eluent was concentrated to 2–3 mg/ml using Centricon YM-100 (Millipore). Bovine tubulin was purified as described previously (Shelanski et al., 1973). MTs were polymerized in PEM buffer with 1 mM GTP in the presence of 1.3 mg/ml axonemal extract at 30°C for 1 h. The ODA–CB-MT complexes were purified by centrifugation through a 50% (wt/vol) sucrose cushion in PEM buffer at 35,000 g for 30 min at 30°C.
In vitro motility assay
ODA–CB-MT was labeled with AlexaFluor543 (Invitrogen), and the molar ratio of unlabeled to labeled tubulin was 20:1. 100 μg/ml of the ODA–CB-MT complex in HMDE buffer (10 mM Hepes-NaOH, pH 7.2, 5 mM MgCl2, 1 mM DTT, 1 mM EGTA, and 1 mM PMSF) containing 10 μM paclitaxel was treated with 20 μM ATP and attached onto the glass-bottom microwell dish (MatTek). Next, the glass surface was blocked with HMDE buffer containing 1 mg/ml casein. Plain MTs labeled with 10 μg/ml AlexaFluor488 in HMDE buffer containing 0.1% NP-40 were sheared with a 28-gauge needle and added to the dish. MT translocation was initiated by adding 100 μM ATP (final concentration). The movements of the MTs were observed using a total internal reflection fluorescence microscope (IX71; Olympus) equipped with plan Apo 100× NA 1.45 total internal reflection fluorescence microscopy oil immersion lens (Nikon). The images were projected onto a CCD camera (Cascade II; Photometrics) and were contrast enhanced with RS Image software (Roper Scientific). Experiments were performed at room temperature.
EM
The MT pellet was resuspended in HMDE buffer and absorbed to holey carbon grids. After washing with HMDETN buffer (HMDE buffer containing 10% trehalose and 0.2% NP-40), the grids were blotted for 5 s and plunged into liquid ethane (−180 C). Images of the ODA–CB-MT complex were recorded on SO-163 film under low-dose conditions with an electron microscope (JEM-2200FS; JEOL) at a nominal magnification of 40,000× with a 15,000–35,000 Å defocus.
For QFDE-EM, the MT pellet was resuspended in PEM buffer without sucrose and centrifuged again. Quick-freeze replicas of the MTs were prepared as described previously (Hirokawa and Heuser, 1981). For negative-staining EM, samples were fixed in 0.5% glutaraldehyde and stained with 5% uranyl acetate.
Relaxed state
To prepare the ODA–CB-MT complex in the relaxed state, we treated the complex in the rigor state with 10 μM vanadate from the sucrose cushion step and added 2 μM ATP 10–15 s before plunge freezing. This concentration of ATP is shown to be enough for relaxing the axoneme (Okuno, 1980).
Image processing
ODA–CB-MT complexes that have MTs with 14 protofilaments/three-start helix were selected (Ray et al., 1993), and their polarity was determined based on the moire pattern in the image (Sosa and Chretien, 1998). Selected micrographs were digitized with a scanner (LeafScan 45; Scitex) at a pixel size of 10 μm, which corresponds to 2.5 Å in the specimen. Each filament was straightened by fitting the longitudinal axis to a cubic spline curve. The straightened filaments were divided into 48-nm-long segments.
For the initial angle assignment for each segment, we assumed that the distance between the two MTs is constant and used a simple relationship between the diameter of the complex and the rotation angle around the axis: φ = cos−1(d/dmax), where d is the distance between the centers of the two MTs, and dmax is the maximum of the distance determined from two representative ODA–CB-MT complexes.
For the translational alignment along the long axis of the complex, we generated a model reference composed of two MTs twisted over each other and spherical densities aligned along the MT with a periodicity of 24 nm. We filtered the Fourier transformed image and the reference segments, leaving 6-, 12-, and 24-nm layer lines and calculated the cross-correlation between the image and the reference. The hand of the helix was determined to be left by the images of QFDE and negative-staining EM with tilting.
Initial 3D reconstruction was generated using back projection based on the rotation and translation determined as described in the previous two paragraphs. We imposed twofold helical symmetry on the reconstruction and applied solvent flattening with a five-pixel Gaussian mask (pixel size = 4.872 Å). After each refinement, we replaced the reference with the symmetry-imposed and masked reconstruction. We repeated this cycle until the phase residual values converged.
The numbers of ODA molecules and filaments used for each of the reconstructions were as follows: 3,737 molecules from 31 filaments for the rigor state, 3,872 molecules from 38 filaments for the relaxed state, and 1,350 molecules from 11 filaments for the oda-11 mutant. The effective resolution was determined to be 2.7 nm, 2.7 nm, and 3.5 nm for the rigor state, the relaxed state, and the oda-11 mutant, respectively, from the Fourier shell correlation between two independent datasets using a 0.3 cut off. Image analysis was performed using Ruby-Helix scripts (Metlagel et al., 2007) and Frealign (Grigorieff, 1998). Surface renderings were performed with UCSF Chimera (Pettersen et al., 2004), Pymol (Delano Scientific), or the AVS software package (Advanced Visual Systems).
Online supplemental material
Videos 1 and 2 show 3D reconstructions of the ODA–CB-MT complex in the rigor state (Video 1) and relaxed state (Video 2) rotating on the long axis of the complex. Video 3 shows sliding of the MT by the ODA–MT complex. Online supplemental material is available at http://www.jcb.org/cgi/content/full/jcb.200609038/DC1.
Supplementary Material
Acknowledgments
We thank Drs. T. Yagi and R. Kamiya (University of Tokyo, Tokyo, Japan), W.J. Snell, the Live Cell Imaging Facility (University of Texas Southwestern), and members of the Kikkawa and Hirokawa laboratories for discussions and suggestions.
Molecular graphic images were produced using the UCSF Chimera package from the Resource for Biocomputing, Visualization, and Informatics at the University of California, San Francisco (supported by National Institutes of Health grant P41 RR-01081). This work was supported by a grant from the National Institutes of Health (GM073847) to M. Kikkawa and by a Special Grant-in-Aid for Scientific Research (grant 18002013) from the Japan Ministry of Education, Science, Sports and Culture to N. Hirokawa.
Abbreviations used in this paper: MT, microtubule; ODA, outer dynein arm; ODA–CB-MT, ODA–cross-bridged MT; QFDE, quick freeze deep etch.
References
- Asai, D.J., and M.P. Koonce. 2001. The dynein heavy chain: structure, mechanics and evolution. Trends Cell Biol. 11:196–202. [DOI] [PubMed] [Google Scholar]
- Avolio, J., S. Lebduska, and P. Satir. 1984. Dynein arm substructure and the orientation of arm-microtubule attachments. J. Mol. Biol. 173:389–401. [DOI] [PubMed] [Google Scholar]
- Burgess, S.A. 1995. Rigor and relaxed outer dynein arms in replicas of cryofixed motile flagella. J. Mol. Biol. 250:52–63. [DOI] [PubMed] [Google Scholar]
- Burgess, S.A., M.L. Walker, H. Sakakibara, P.J. Knight, and K. Oiwa. 2003. Dynein structure and power stroke. Nature. 421:715–718. [DOI] [PubMed] [Google Scholar]
- DiBella, L.M., and S.M. King. 2001. Dynein motors of the Chlamydomonas flagellum. Int. Rev. Cytol. 210:227–268. [DOI] [PubMed] [Google Scholar]
- Gee, M.A., J.E. Heuser, and R.B. Vallee. 1997. An extended microtubule-binding structure within the dynein motor domain. Nature. 390:636–639. [DOI] [PubMed] [Google Scholar]
- Gibbons, I.R. 1996. The role of dynein in microtubule-based motility. Cell Struct. Funct. 21:331–342. [DOI] [PubMed] [Google Scholar]
- Gibbons, I.R., and A.J. Rowe. 1965. Dynein: a protein with adenosine triphosphatase activity from cilia. Science. 149:424–426. [DOI] [PubMed] [Google Scholar]
- Goodenough, U.W., and J.E. Heuser. 1982. Substructure of the outer dynein arm. J. Cell Biol. 95:798–815. [DOI] [PMC free article] [PubMed] [Google Scholar]
- Goodenough, U., and J.E. Heuser. 1984. Structural comparison of purified dynein proteins with in situ dynein arms. J. Mol. Biol. 180:1083–1118. [DOI] [PubMed] [Google Scholar]
- Goodenough, U.W., and J.E. Heuser. 1985. Outer and inner dynein arms of cilia and flagella. Cell. 41:341–342. [DOI] [PubMed] [Google Scholar]
- Grigorieff, N. 1998. Three-dimensional structure of bovine NADH:ubiquinone oxidoreductase (complex I) at 22 A in ice. J. Mol. Biol. 277:1033–1046. [DOI] [PubMed] [Google Scholar]
- Haimo, L.T., and J.L. Rosenbaum. 1981. Cilia, flagella, and microtubules. J. Cell Biol. 91:125s–130s. [DOI] [PMC free article] [PubMed] [Google Scholar]
- Haimo, L.T., B.R. Telzer, and J.L. Rosenbaum. 1979. Dynein binds to and cross-bridges cytoplasmic microtubules. Proc. Natl. Acad. Sci. USA. 76:5759–5763. [DOI] [PMC free article] [PubMed] [Google Scholar]
- Hirokawa, N., and J.E. Heuser. 1981. Quick-freeze, deep-etch visualization of the cytoskeleton beneath surface differentiations of intestinal epithelial cells. J. Cell Biol. 91:399–409. [DOI] [PMC free article] [PubMed] [Google Scholar]
- Hirokawa, N., Y. Tanaka, Y. Okada, and S. Takeda. 2006. Nodal flow and the generation of left-right asymmetry. Cell. 125:33–45. [DOI] [PubMed] [Google Scholar]
- Johnson, K.A. 1983. The pathway of ATP hydrolysis by dynein. Kinetics of a presteady state phosphate burst. J. Biol. Chem. 258:13825–13832. [PubMed] [Google Scholar]
- Johnson, K.A. 1985. Pathway of the microtubule-dynein ATPase and the structure of dynein: a comparison with actomyosin. Annu. Rev. Biophys. Biophys. Chem. 14:161–188. [DOI] [PubMed] [Google Scholar]
- Johnson, K.A., and J.S. Wall. 1983. Structure and molecular weight of the dynein ATPase. J. Cell Biol. 96:669–678. [DOI] [PMC free article] [PubMed] [Google Scholar]
- Johnson, K.A., M.E. Porter, and T. Shimizu. 1984. Mechanism of force production for microtubule-dependent movements. J. Cell Biol. 99:132s–136s. [DOI] [PMC free article] [PubMed] [Google Scholar]
- Kagami, O., and R. Kamiya. 1992. Translocation and rotation of microtubules caused by multiple species of Chlamydomonas inner-arm dynein. J. Cell Sci. 103:653–664. [Google Scholar]
- Kamiya, R. 2002. Functional diversity of axonemal dyneins as studied in Chlamydomonas mutants. Int. Rev. Cytol. 219:115–155. [DOI] [PubMed] [Google Scholar]
- King, S.M. 2000. AAA domains and organization of the dynein motor unit. J. Cell Sci. 113:2521–2526. [DOI] [PubMed] [Google Scholar]
- King, S.M., T. Otter, and G.B. Witman. 1985. Characterization of monoclonal anti-bodies against Chlamydomonas flagellar dyneins by high-resolution protein blotting. Proc. Natl. Acad. Sci. USA. 82:4717–4721. [DOI] [PMC free article] [PubMed] [Google Scholar]
- Kon, T., T. Mogami, R. Ohkura, M. Nishiura, and K. Sutoh. 2005. ATP hydrolysis cycle-dependent tail motions in cytoplasmic dynein. Nat. Struct. Mol. Biol. 12:513–519. [DOI] [PubMed] [Google Scholar]
- Lowe, J., H. Li, K.H. Downing, and E. Nogales. 2001. Refined structure of alpha beta-tubulin at 3.5 A resolution. J. Mol. Biol. 313:1045–1057. [DOI] [PubMed] [Google Scholar]
- Lupetti, P., S. Lanzavecchia, D. Mercati, F. Cantele, R. Dallai, and C. Mencarelli. 2005. Three-dimensional reconstruction of axonemal outer dynein arms in situ by electron tomography. Cell Motil. Cytoskeleton. 62:69–83. [DOI] [PubMed] [Google Scholar]
- Madrona, A.Y., and D.K. Wilson. 2004. The structure of Ski8p, a protein regulating mRNA degradation: implications for WD protein structure. Protein Sci. 13:1557–1565. [DOI] [PMC free article] [PubMed] [Google Scholar]
- Marchese-Ragona, S.P., K.C. Facemyer, and K.A. Johnson. 1989. Structure of the alpha-, beta-, and gamma-heavy chains of 22 S outer arm dynein obtained from Tetrahymena cilia. J. Biol. Chem. 264:21361–21368. [PubMed] [Google Scholar]
- Metlagel, Z., Y.S. Kikkawa, and M. Kikkawa. 2007. Ruby-helix: an implementation of helical image processing based on object-oriented scripting language. J. Struct. Biol. 157:95–105. [DOI] [PubMed] [Google Scholar]
- Mitchell, D.R. 2000. Chlamydomonas flagella. J. Phycol. 36:261–273. [Google Scholar]
- Moore, P.B., H.E. Huxley, and D.J. DeRosier. 1970. Three-dimensional reconstruction of F-actin, thin filaments and decorated thin filaments. J. Mol. Biol. 50:279–295. [DOI] [PubMed] [Google Scholar]
- Neuwald, A.F., L. Aravind, J.L. Spouge, and E.V. Koonin. 1999. AAA+: a class of chaperone-like ATPases associated with the assembly, operation, and disassembly of protein complexes. Genome Res. 9:27–43. [PubMed] [Google Scholar]
- Nicastro, D., C. Schwartz, J. Pierson, R. Gaudette, M.E. Porter, and J.R. McIntosh. 2006. The molecular architecture of axonemes revealed by cryoelectron tomography. Science. 313:944–948. [DOI] [PubMed] [Google Scholar]
- Ogawa, K., R. Kamiya, C.G. Wilkerson, and G.B. Witman. 1995. Interspecies conservation of outer arm dynein intermediate chain sequences defines two intermediate chain subclasses. Mol. Biol. Cell. 6:685–696. [DOI] [PMC free article] [PubMed] [Google Scholar]
- Okuno, M. 1980. Inhibition and relaxation of sea urchin sperm flagella by vanadate. J. Cell Biol. 85:712–725. [DOI] [PMC free article] [PubMed] [Google Scholar]
- Pettersen, E.F., T.D. Goddard, C.C. Huang, G.S. Couch, D.M. Greenblatt, E.C. Meng, and T.E. Ferrin. 2004. UCSF Chimera–a visualization system for exploratory research and analysis. J. Comput. Chem. 25:1605–1612. [DOI] [PubMed] [Google Scholar]
- Porter, M.E., and K.A. Johnson. 1983. Transient state kinetic analysis of the ATP-induced dissociation of the dynein-microtubule complex. J. Biol. Chem. 258:6582–6587. [PubMed] [Google Scholar]
- Ray, S., E. Meyhofer, R.A. Milligan, and J. Howard. 1993. Kinesin follows the microtubule's protofilament axis. J. Cell Biol. 121:1083–1093. [DOI] [PMC free article] [PubMed] [Google Scholar]
- Reck-Peterson, S.L., A. Yildiz, A.P. Carter, A. Gennerich, N. Zhang, and R.D. Vale. 2006. Single-molecule analysis of dynein processivity and stepping behavior. Cell. 126:335–348. [DOI] [PMC free article] [PubMed] [Google Scholar]
- Sakakibara, H., and R. Kamiya. 1989. Functional recombination of outer dynein arms with outer arm-missing flagellar axonemes of a Chlamydomonas mutant. J. Cell Sci. 92:77–83. [Google Scholar]
- Sakakibara, H., and H. Nakayama. 1998. Translocation of microtubules caused by the alphabeta, beta and gamma outer arm dynein subparticles of Chlamydomonas. J. Cell Sci. 111:1155–1164. [DOI] [PubMed] [Google Scholar]
- Sakakibara, H., D.R. Mitchell, and R. Kamiya. 1991. A Chlamydomonas outer arm dynein mutant missing the alpha heavy chain. J. Cell Biol. 113:615–622. [DOI] [PMC free article] [PubMed] [Google Scholar]
- Sakakibara, H., S. Takada, S.M. King, G.B. Witman, and R. Kamiya. 1993. A Chlamydomonas outer arm dynein mutant with a truncated beta heavy chain. J. Cell Biol. 122:653–661. [DOI] [PMC free article] [PubMed] [Google Scholar]
- Sakato, M., and S.M. King. 2004. Design and regulation of the AAA+ microtubule motor dynein. J. Struct. Biol. 146:58–71. [DOI] [PubMed] [Google Scholar]
- Sale, W.S., and I.R. Gibbons. 1979. b. Study of the mechanism of vanadate inhibition of the dynein cross-bridge cycle in sea urchin sperm flagella. J. Cell Biol. 82:291–298. [DOI] [PMC free article] [PubMed] [Google Scholar]
- Samso, M., and M.P. Koonce. 2004. 25 Angstrom resolution structure of a cytoplasmic dynein motor reveals a seven-member planar ring. J. Mol. Biol. 340:1059–1072. [DOI] [PubMed] [Google Scholar]
- Satir, P., and S.T. Christensen. 2007. Overview of structure and function of mammalian cilia. Annu. Rev. Physiol. 69:377–400. [DOI] [PubMed] [Google Scholar]
- Satir, P., J. Wais-Steider, S. Lebduska, A. Nasr, and J. Avolio. 1981. The mechanochemical cycle of the dynein arm. Cell Motil. 1:303–327. [DOI] [PubMed] [Google Scholar]
- Shelanski, M.L., F. Gaskin, and C.R. Cantor. 1973. Microtubule assembly in the absence of added nucleotides. Proc. Natl. Acad. Sci. USA. 70:765–768. [DOI] [PMC free article] [PubMed] [Google Scholar]
- Shimizu, T., and K.A. Johnson. 1983. a. Kinetic evidence for multiple dynein ATPase sites. J. Biol. Chem. 258:13841–13846. [PubMed] [Google Scholar]
- Shimizu, T., and K.A. Johnson. 1983. b. Presteady state kinetic analysis of vanadate-induced inhibition of the dynein ATPase. J. Biol. Chem. 258:13833–13840. [PubMed] [Google Scholar]
- Sosa, H., and D. Chretien. 1998. Relationship between moire patterns, tubulin shape, and microtubule polarity. Cell Motil. Cytoskeleton. 40:38–43. [DOI] [PubMed] [Google Scholar]
- Tani, T., and S. Kamimura. 1999. Dynein-ADP as a force-generating intermediate revealed by a rapid reactivation of flagellar axoneme. Biophys. J. 77:1518–1527. [DOI] [PMC free article] [PubMed] [Google Scholar]
- Tsukita, S., S. Tsukita, J. Usukura, and H. Ishikawa. 1983. ATP-dependent structural changes of the outer dynein arm in Tetrahymena cilia: a freeze-etch replica study. J. Cell Biol. 96:1480–1485. [DOI] [PMC free article] [PubMed] [Google Scholar]
- Vallee, R.B., and M.A. Gee. 1998. Make room for dynein. Trends Cell Biol. 8:490–494. [DOI] [PubMed] [Google Scholar]
- van Heel, M. 1987. Angular reconstitution: a posteriori assignment of projection directions for 3d reconstruction. Ultramicroscopy. 21:111–123. [DOI] [PubMed] [Google Scholar]
- Warner, F.D., and D.R. Mitchell. 1981. Polarity of dynein-microtubule interactions in vitro: cross-bridging between parallel and antiparallel microtubules. J. Cell Biol. 89:35–44. [DOI] [PMC free article] [PubMed] [Google Scholar]
- Wilkerson, C.G., S.M. King, A. Koutoulis, G.J. Pazour, and G.B. Witman. 1995. The 78,000 M(r) intermediate chain of Chlamydomonas outer arm dynein isa WD-repeat protein required for arm assembly. J. Cell Biol. 129:169–178. [DOI] [PMC free article] [PubMed] [Google Scholar]
- Witman, G.B., J. Plummer, and G. Sander. 1978. Chlamydomonas flagellar mutants lacking radial spokes and central tubules. Structure, composition, and function of specific axonemal components. J. Cell Biol. 76:729–747. [DOI] [PMC free article] [PubMed] [Google Scholar]
- Witman, G.B., K.A. Johnson, K.K. Pfister, and J.S. Wall. 1983. Fine structure and molecular weight of the outer arm dyneins of Chlamydomonas. J. Submicrosc.Cytol. 15:193–197. [Google Scholar]
Associated Data
This section collects any data citations, data availability statements, or supplementary materials included in this article.


