

Abstract
At the plasma membrane, heterotrimeric G proteins act as molecular switches to relay signals from G protein–coupled receptors; however, Gα subunits also have receptor-independent functions at intracellular sites. Regulator of G protein signaling (RGS) 14, which enhances the intrinsic GTPase activity of Giα proteins, localizes in centrosomes, which suggests the coexpression of Giα. We show expression of Giα1, Giα2, and Giα3 in the centrosomes and at the midbody. Fluorescence resonance energy transfer analysis confirms a direct interaction between RGS14 and Giα1 in centrosomes. Expression of GTPase-deficient Giα1 results in defective cytokinesis, whereas that of wild-type or GTPase-deficient Giα3 causes prolonged mitosis. Cells treated with pertussis toxin, with reduced expression of Giα1, Giα2, and Giα3 or with decreased expression of RGS14 also exhibit cytokinesis defects. These results suggest that Giα proteins and their regulators at these sites may play essential roles during mammalian cell division.
Introduction
Besides their established role at the plasma membrane, heterotrimeric G proteins and their regulators including guanine nucleotide exchange factors (GEFs), guanine nucleotide dissociation inhibitors (GDIs), and regulator of G protein signaling (RGS) proteins play a critical role in regulating microtubule (MT) pulling force during asymmetric cell division in Caenorhabditis elegans and Drosophila melanogaster (Wilkie and Kinch, 2005). Giα-class GDIs, such as C. elegans GPR1/2 and D. melanogaster Pins, inhibit the release of nucleotide from Gα-GDP via their GoLoco domain. A C. elegans GEF, Ric-8, likely stimulates nucleotide exchange of GoLoco protein–Gα–GDP complex, producing free Gα-GTP and signals force generation (Hampoelz and Knoblich, 2004). RGS, a Gα GTPase-activating protein (GAP), may also act as an effector by positively regulating the pulling force (Hess et al., 2004). Altered expression of G proteins or their regulators in C. elegans results in symmetric cell division, which causes inappropriate cell lineage determination and, ultimately, embryonic lethality. Emerging evidence suggests that mammalian heterotrimeric G proteins and their regulators also localize in the intracellular organelles and regulate MT pulling force (Du and Macara, 2004; Tall and Gilman, 2005). However, the consequence of altered expression or function of these mammalian proteins on cell division has not yet been described.
Unique among RGS and GDI proteins, RGS14 and RGS12 contain both an RGS domain for GAP activity and a GoLoco domain for GDI activity (Ponting, 1999). Both domains of RGS14 target members of the Giα subclass (Mittal and Linder, 2004). RGS14 also possesses two Raf-like Ras-binding domains, which overlap with the small GTPase, Rap-interacting domain (Traver et al., 2000). RGS14 associates with centrosomes and MTs, and loss of Rgs14 expression in mice is catastrophic, resulting in the failure of zygotes to progress to the two-cell stage (Martin-McCaffrey et al., 2004; Cho et al., 2005). Very little is known about which activity of RGS14 is involved in centrosome/MT-related function and how the different activities of RGS14 are regulated in vivo. We show that the Giα proteins, targets for RGS14 regulation, localize in the centrosomes and midbody. We also demonstrate a direct interaction of RGS14 with Giα1 in the centrosomes and the necessity for normal Giα and RGS14 function for proper cell division. These results implicate heterotrimeric G protein–mediated signal transduction in centrosome biology and in cytokinesis.
Results
Giα proteins localize in the centrosomes and at the midbody
Based on RGS14 expression in centrosome and its Giα selectivity, we examined whether Giα1, Giα2, or Giα3 localized in the centrosomes (Cho et al., 2005). A YFP fusion protein of Giα1 localized at the plasma membrane and cytoplasm, but it also colocalized with CFP-tagged RGS14 in centrosomes (Fig. 1 A). YFP expressed from the vector control evenly localized throughout the cell, except in the areas that appeared to be nucleoli. Giα1-YFP also colocalized with endogenous centrosome proteins, including RGS14, γ-tubulin, and ninein (Fig. 1 B). Expression of Giα1-YFP did not displace the endogenous centrosome proteins examined, suggesting that Giα1-YFP expression did not interfere with centrosome recruitment of these proteins. Giα2- and Giα3-YFP also targeted to the centrosomes, colocalizing with another centrosome marker, pericentrin, as did the Giα1-YFP (Fig. 1 C). Coexpression of RGS14-CFP was not necessary for targeting of YFP fusions of Giα1, Giα2, or Giα3 to the centrosomes. The YFP tag in the Giα-YFP constructs was shown not to interfere with Giα function (Gibson and Gilman, 2006). The Glu-Glu (EE)–tagged Giα proteins also localized to the centrosomes, excluding the possibility of altered targeting caused by the YFP tagging (Fig. 1 D). The Alexa Fluor–conjugated secondary antibodies used in this study yielded no substantial staining of cells when used without primary antibodies (Fig. 1 D). Imaging of live cells transfected with the Giα-YFP constructs demonstrated that the fusion proteins were predominantly localized at the plasma membrane in most cells, although not in all cells (Fig. 1 A). The fixation of cells with 50% acetone/50% methanol (used for centrosome staining) and subsequent immunostaining resulted in a considerable loss of fusion proteins localized at the plasma membrane (Fig. 1, B–D). The YFP fusions of all three Giα proteins also showed strong expression at the junction between two daughter cells during cytokinesis in live cell imaging, unlike the YFP expressed from the vector control (Fig. 2). This may represent expression at the cleavage furrow, and/or possibly at the midbody, although these structures were difficult to discern in our low-resolution epifluorescence imaging of live cells.
Figure 1.

Localization of Giα in the centrosomes. (A, top) Confocal images of live HeLa cells transfected with rat Giα1-YFP, RGS14-CFP, and merged image. (bottom) Cells expressing Giα1-YFP, RGS14-CFP, or YFP vector control. (B) HeLa cells expressing rat Giα1-YFP were stained with anti-RGS14, anti–γ-tubulin, or ninein antibody, followed by Alexa Fluor 568–conjugated secondary antibodies. The right column shows merged images of Giα1-YFP and endogenous centrosome protein staining. (C) Giα2-YFP and Giα3-YFP also localize in the centrosomes. HeLa cells transfected with human Giα1-YFP, Giα2-YFP, or Giα3-YFP were immunostained with anti-pericentrin antibody, followed by Alexa Fluor 568–conjugated anti–rabbit antibody. The right column shows merged images of Giα-YFP proteins and endogenous pericentrin staining. (D) HeLa cells transfected with EE-Giα2 were immunostained with anti-EE monoclonal and Alexa Fluor 568–conjugated anti–mouse antibodies. The control cells were incubated only with the Alexa Fluor 568–conjugated secondary antibody, omitting the anti-EE antibody. Cells were then stained with anti-ninein and Alexa Fluor 488–conjugated anti–rabbit antibodies. The right column shows merged images of EE-Giα2, ninein, and Hoechst 33342 DNA staining. The exact same confocal settings were used to acquire the images shown. None of the Alexa Fluor–conjugated secondary antibodies used (1:1,000 dilution; 45 min to 1 h of incubation time) resulted in any substantial staining of the cells (not depicted) excluding the possibility of nonspecific staining by secondary antibodies. The arrows indicate colocalization. Bar, 10 μm.
Figure 2.
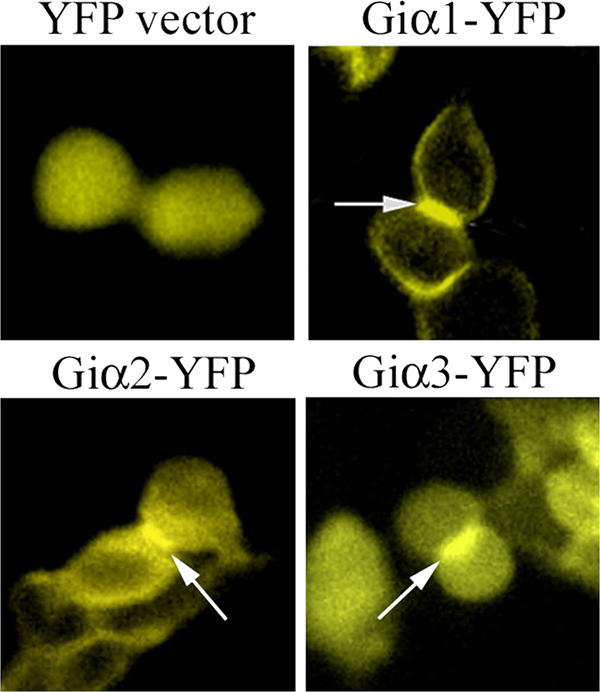
Epifluorescence images of HeLa cells expressing YFP fusions of Giα proteins during cytokinesis. HeLa cells transfected with vector-YFP, human Giα1-YFP, Giα2-YFP, or Giα3-YFP were subjected to videomicroscopy. Representative snapshots showing expression of these proteins during cytokinesis were taken from the 481 images of time-lapse videomicroscopy (3-min intervals for 24 h). To ensure that these cells underwent cytokinesis, we followed cell division starting from rounding up of cells (indication of cells entering mitosis) to completion of cytokinesis (reattachment of cells). Compared with YFP expressed from the control vector, all three Giα-YFP fusions showed very strong expression at the junction between two daughter cells (arrows).
Next, we verified that endogenous Giα proteins localized in centrosomes of HeLa and NIH3T3 cells, which are known to express Giα1, Giα2, and Giα3 using Giα1-, Giα2-, or Giα3-specific antibodies (Susa et al., 1997; Krumins and Gilman, 2006). To verify the specificity of each antibody, lysates of HeLa cells expressing EE-tagged human Giα1, Giα2, or Giα3 were immunoblotted with the anti-Giα and -EE antibodies. The results showed minimal cross-reactivity (Fig. S1, available at http://www.jcb.org/cgi/content/full/jcb.200604114/DC1). To determine cell cycle position, we stained cells with anti- pericentrin or anti– γ-tubulin antibody and with Hoechst 33342 (Cho et al., 2005). Giα1 and Giα2 localized in the centrosomes of interphase and mitotic cells, but Giα3 did not, contrary to what we observed with Giα3-YFP (Fig. 1 C) and to the recently published finding (Blumer et al., 2006). This is likely caused by centrosome expression of Giα3 at a level below detection by the antibody or epitope masking in the centrosomes. Giα1 expression is observed at the midbody; however, it is no longer detected in centrosomes during cytokinesis (Fig. 3 B). The expression pattern of Giα2 during cytokinesis mirrors that of pericentrin with modest midbody and strong centrosome expression (Doxsey, 2005). We also detected midbody Giα3 and RGS14 staining (Fig. 3 B). Although RGS14 was reported to colocalize with MTs (Martin-McCaffrey et al., 2004), neither N- or C-terminally tagged RGS14 did so nor did we observe significant MT staining with three RGS14 antibodies raised independently (unpublished data). Finally, we reconfirmed the intracellular staining pattern of Giα1 and Giα2 using additional anti-Giα1 and -Giα2 antibodies raised independently and by demonstrating the absence of centrosomal staining of Giα2 in the cells isolated from Giα2 knockout mice (Fig. S2; Han et al., 2005). We observed some inconsistency in the plasma membrane staining with various anti-Giα antibodies. The varying staining patterns by the antibodies raised against the same Giα proteins are likely caused by the difference in epitope recognition and affinity. Furthermore, the fixation with 50% acetone/50% methanol also contributed to the inconsistency in plasma membrane staining of endogenous Giα proteins. The fixation may weaken the integrity of plasma membrane and/or alter the antigenicity of Giα proteins. This inconsistency has also been observed in previous studies. In the study by Stow et al. (1991), anti-Giα3 antibody stained only Golgi and cytoplasm, whereas Wilson et al. (1994) reported strong plasma membrane and Golgi staining by an anti-Giα3 antibody in certain cells. However, the same anti-Giα3 antibody stained only Golgi (not the plasma membrane) in another type of cell (Wilson et al., 1994).
Figure 3.

Localization of endogenous Giα in the centrosomes and midbody. (A) NIH3T3 and HeLa cells were immunostained with anti-pericentrin/Alexa Fluor 488–conjugated secondary antibodies, and then with anti-Giα1 (or -Giα2) monoclonal/Alexa Fluor 568–conjugated secondary antibodies. The cell cycle phase is indicated as M (mitotic), G1, S, or G2. For HeLa cells, only G2 phase cells are shown. (B) NIH3T3 cells were immunostained as described in A. Cells were also immunostained with mouse anti–γ-tubulin antibody, followed by Alexa Fluor 488 (for Giα3 double staining) or 568 (for RGS14 double staining) conjugated anti–mouse antibody. Cells were subsequently stained with rabbit anti-Giα3 or -RGS14 antibody, followed by Alexa Fluor 568– or 488–conjugated anti–rabbit antibody. The arrowheads indicate centrosomes. Certain centrosomes appear larger because they are overexposed to capture the much less prominent midbody staining. Twofold magnification of the midbody is shown in insets. The merge shows merged images of Alexa Fluor 488, and Hoechst 33342 DNA staining. Bar, 10 μm.
Giα1 directly interacts with RGS14 in the centrosomes via both RGS and GoLoco domains
To investigate whether Giα1 and RGS14 interacted in the centrosomes, we performed two independent fluorescence resonance energy transfer (FRET) analyses on HeLa cells transfected with RGS14-CFP and Giα1-YFP. First, the acceptor photobleaching method was used on fixed cells expressing the two fusion proteins. Cells containing centrosomes expressing both fusion proteins at similar levels were found on the basis of their specific fluorescence intensities. A representative FRET image of acceptor photobleaching assays performed is shown in Fig. 4 A. Unlike the nonbleached centrosome, the CFP fluorescence intensity of the bleached centrosome increased considerably after YFP bleaching. The presence of FRET was also confirmed by using the sensitized emission FRET method on live cells. Initial images of live cells expressing a CFP/YFP fusion, RGS14-CFP, or Giα1-YFP were use to adjust confocal microscope settings. The subsequent acquisition of FRET efficiency image clearly demonstrated a robust FRET signal in the centrosomes of live cells expressing wild-type RGS14-CFP and Giα1-YFP (Fig. 4 B).
Figure 4.

FRET assays. (A) HeLa cells expressing RGS14-CFP and rat Giα1-YFP were subjected to acceptor photobleaching. A representative image from >20 experiments is shown. Only one (arrow) of the two centrosomes expressing both CFP and YFP fusions was photobleached. The nonphotobleached centrosome (arrowhead) did not show any substantial changes in fluorescence intensity. Pre and post stand for before and after photobleaching. (bottom) Twofold magnification. Fluorescence intensities of Pre (open bar) and Post (hatched bar) are shown in the graph. (B) Ratio imaging of RGS14-CFP and Giα1-YFP was obtained in live HeLa cells using Leica sensitized emission routine. A representative FRET image of three experiments is shown. Twofold magnification of the centrosomes is shown in the insets. FRET intensities are encoded by using the color bar scale shown on the right. Colors range between blue (lowest FRET) and red (highest FRET). Bar, 10 μm.
To figure out which domain of RGS14 was involved in interaction with Giα1 in the centrosomes, we generated CFP fusions of various deletion and point mutants (Fig. 5 A) and tested the ability of the various fusion proteins to bind Giα1 by acceptor photobleaching (Fig. 5 B). The average FRET efficiency of unbleached centrosomes (1%) served as a negative control. Bleached centrosomes expressing wild-type RGS14-CFP (HC30) and Giα1-YFP showed robust FRET signals, with an average FRET efficiency of 10.7%. Neither the HC31 lacking the N-terminal 184 amino acids nor HC32 containing centrosome-targeted, Rap-interacting domain (Fig. 5 C) yielded a true FRET. Various GoLoco domain deletion mutants, including HC33, could not be tested because they localized only in the nucleus (unpublished data). True FRET signals were observed from the HC34 and HC35 with an RGS and a GoLoco domain defective in Giα binding, respectively. A likely explanation for why the RGS domain deletion mutant behaves differently from the RGS domain point mutant is that the N-terminal deletion may have globally affected RGS14 protein conformation, interfering with the Giα1–RGS14 GoLoco interaction. The HC36 containing both defective RGS and GoLoco domains showed no true FRET signal. Together, our data indicate that both the RGS and GoLoco domains are involved in Giα binding in the centrosome. A constitutively active Q204L mutant of Giα1-YFP also produced a true FRET with wild-type RGS14 in the centrosomes. In contrast to the centrosome interaction, no or low-efficiency FRET signals were observed between RGS14 and wild-type or the mutant Giα1 in the cytoplasm, suggesting a different mechanism of interaction in the centrosomes. RGS14 was recently shown to bind both wild-type and GTPase-deficient forms of Giα1 and Giα3 at the plasma membrane (Shu et al., 2006).
Figure 5.

Interaction between RGS14-CFP and Giα1-YFP in the centrosomes. (A) RGS14-CFP fusions containing various deletions and point mutations were generated. RGS domain (aa 67–184), two Raf-like Ras binding domains (RBDs; aa 303–374 and 376–445), Rap- interacting domain (RID; aa 300–427), and GoLoco domain (Loco; aa 500–522) are indicated as filled boxes. Wild-type RGS14-CFP construct is designated as HC30. A mutant lacking N-terminal 66 amino acids and the RGS domain is named as HC31. HC32 construct contains only the RID domain. HC33 lacks a part of the GoLoco domain and C-terminal 25 amino acids. The point mutants defective in GAP, GDI, and both activities are named as HC34, HC35, and HC36, respectively. Asterisks indicate that point mutations were introduced. (B) Acceptor photobleaching was performed with wild-type rat Giα1-YFP (or the QL mutant) and various RGS14-CFP constructs. NB* and cyt** stand for nonbleached centrosomes and cytoplasmic bleaching, respectively. The FRET efficiencies were averaged for comparison, and the FRET result was accepted as truly positive only when the average FRET efficiency was considerably higher than that of the negative control. (C) Confocal images of live HeLa cells expressing the HC32 construct (RID-CFP) and Giα1-YFP. The merged image shows colocalization of RID-CFP and Giα1-YFP in the centrosomes. Bar, 10 μm.
Altered expression or function of Giα proteins leads to defective cell division
Next, we examined the effect of altered Giα expression or function on cell division by time-lapse videomicroscopy. To assess progression of cell division and measure the duration of mitosis or cytokinesis, we used visual landmarks. Rounding up of attached cells was used as the initiation of mitosis, emergence of a daughter cell as initiation of cytokinesis, and the loss of roundness in conjunction with inability to detect intercellular bridge (reattachment) as the end time point for cytokinesis. These measurable durations may not truly reflect the actual durations, although they can be used for comparison. For example, absolving of midbody after mitosis, which cannot be visualized in our live imaging, may take up to several hours (Schulze and Blose, 1984; Sanger et al., 1985; Rattner, 1992). Of almost all the cells expressing YFP, only control, wild-type Giα1, or Giα2 QL mutant underwent relatively normal cell division (Fig. 6 A and Videos 1 and 2, available at http://www.jcb.org/cgi/content/full/jcb.200604114/DC1). The measurable durations of mitosis and cytokinesis of these cells were ∼30 min for these cells. However, a considerable number of dividing cells expressing wild-type or QL mutant of Giα3 (∼35 and 20% of cells examined, respectively) showed prolonged mitosis with an average duration of 176 min (from the metaphase to the initiation of cytokinesis), but underwent relatively normal cytokinesis (Fig. 6 A and Video 3). In an extreme case, a cell stayed in the mitotic phase for >8 h before initiation of cytokinesis. In contrast, cells expressing the Giα1 QL mutant exhibited relatively normal mitosis, but ∼40% had prolonged or unresolved cytokinesis (Fig. 6 A and Video 4). More than 7 h lapsed between the initiation of cytokinesis and the appearance of midbody in the cell shown in Fig. 6 A. Two daughter cells remained unattached (rounded up). Mitosis was also slightly delayed in ∼15% of cells expressing wild-type Giα2 (unpublished data).
Figure 6.

Perturbed Giα expression or function leads to defective cell division. (A) Time-lapse videomicroscopy was performed with HeLa cells expressing YFP vector control or various human Giα-YFP fusions. At least two independent transfections were performed for each construct. Recordings of 20 dividing cells were analyzed for each experiment. Epifluorescence images were captured at 3-min intervals for 24 h. The time shown indicates the hours and minutes lapsed from the beginning of recording. Eight snapshots chosen from the 481 time-lapse images are shown for YFP vector, Giα2QL-YFP, Giα3-YFP, and Giα1QL-YFP (Videos 1–4). (B) NIH3T3 cells treated with 100 ng/ml of PTX for 3 h were subjected to time-lapse videomicroscopy. DIC images were acquired at 3-min intervals for 24 h. (top row) Three different dividing cells that are representative of the ∼100 untreated control cell divisions observed. The red lines are drawn to show dividing cells aligned at a nearly 180° angle. (bottom row) Three different PTX-treated cells undergoing cytokinesis. Approximately 10% of PTX-treated cells readily showed intercellular bridge defects (Videos 5 and 6). (C) MTs of NIH3T3 control and PTX-treated cells were stained with anti–α-tubulin/Alexa Fluor 488–conjugated secondary antibodies and Hoechst 33324. The merge shows DIC, Alexa Fluor 488, and DNA staining. The arrow in the DIC image indicates midbody. Red lines are drawn to show MT alignment in the intercellular bridge. (D) NIH3T3 control and PTX-treated cells were stained as described in C. A representative image of multinucleated cells treated with PTX is shown. Confocal images of stained cells were obtained from two independent experiments (n = 194 and 200 for control; n = 334 and 251 for PTX-treated cells) to quantitate the number of multinucleated cells as shown in the histogram. Error bars represent the SD. Bars, 10 μm. Videos 1–6 are available at http://www.jcb.org/cgi/content/full/jcb.200604114/DC1.
We treated cells with pertussis toxin (PTX) and monitored cell cycle progression using videomicroscopy (Fig. 6 B and Videos 5 and 6, available at http://www.jcb.org/cgi/content/full/jcb.200604114/DC1). PTX interferes Giα GDP/GTP exchange (except for Gαz) triggered by G protein–coupled receptors (GPCRs). Differential interference contrast (DIC) images of almost all dividing control NIH3T3 cells showed short or no visible intercellular bridges during cytokinesis with two dividing cells being aligned at nearly 180° angles, whereas PTX treatment resulted in formation of abnormally extended intercellular bridges and misalignment of MTs (Fig. 6, B and C). Some cells interconnected via an intercellular bridge appeared to coalesce into single cells (Video 6). No apparent defects in mitotic spindle formation were observed with the PTX-treated cells (based on α-tubulin staining; unpublished data). An average of 12% of PTX-treated cells showed multinucleation, compared with an average of 3% of nontreated cells, which is likely the result of failed cytokinesis seen in videomicroscopy (Fig. 6 D).
Silencing Giα1, Giα2, and Giα3 or RGS14 by siRNA induces cytokinesis failure
We took advantage of a recent report demonstrating efficient silencing of Giα1, Giα2, and Giα3 in HeLa cells using siRNAs and closely followed the previously described method (Krumins and Gilman, 2006). A significant compensatory increase in Giα1 expression was observed after silencing of Giα2 or Giα3 in HeLa cells, demonstrating the adaptability of G protein signaling networks. Different Giα isoforms may also be able to functionally compensate for the lack of others. Therefore, we used two siRNAs reported to simultaneously silence all three Giα isoforms (Giα1-3 siRNA; Krumins and Gilman, 2006). Cells were harvested for immunoblotting and immunocytochemistry or subjected to videomicroscopy 6–7 d after the first transfection. Transfection efficiency was monitored with DY547-tagged siRNA yielding an average of ∼90% efficiency (unpublished data). Immunoblotting demonstrated a significant reduction in expression of all three Giα isoforms in Giα1-3 siRNA–transfected cells compared with cells transfected with siRNA control (Fig. 7 A). The centrosome staining by anti-Giα1 or -Giα2 antibody was also significantly reduced (an average of ∼40% reduction for both Giα1 and Giα2) in HeLa cells transfected with Giα1-3 siRNA (Fig. 7 B). Because the localization of Giα3 in the centrosomes was recently reported (Blumer et al., 2006) and our anti-Giα3 antibody did not recognize the centrosomal Giα3, we did not perform immunostaining with this antibody.
Figure 7.
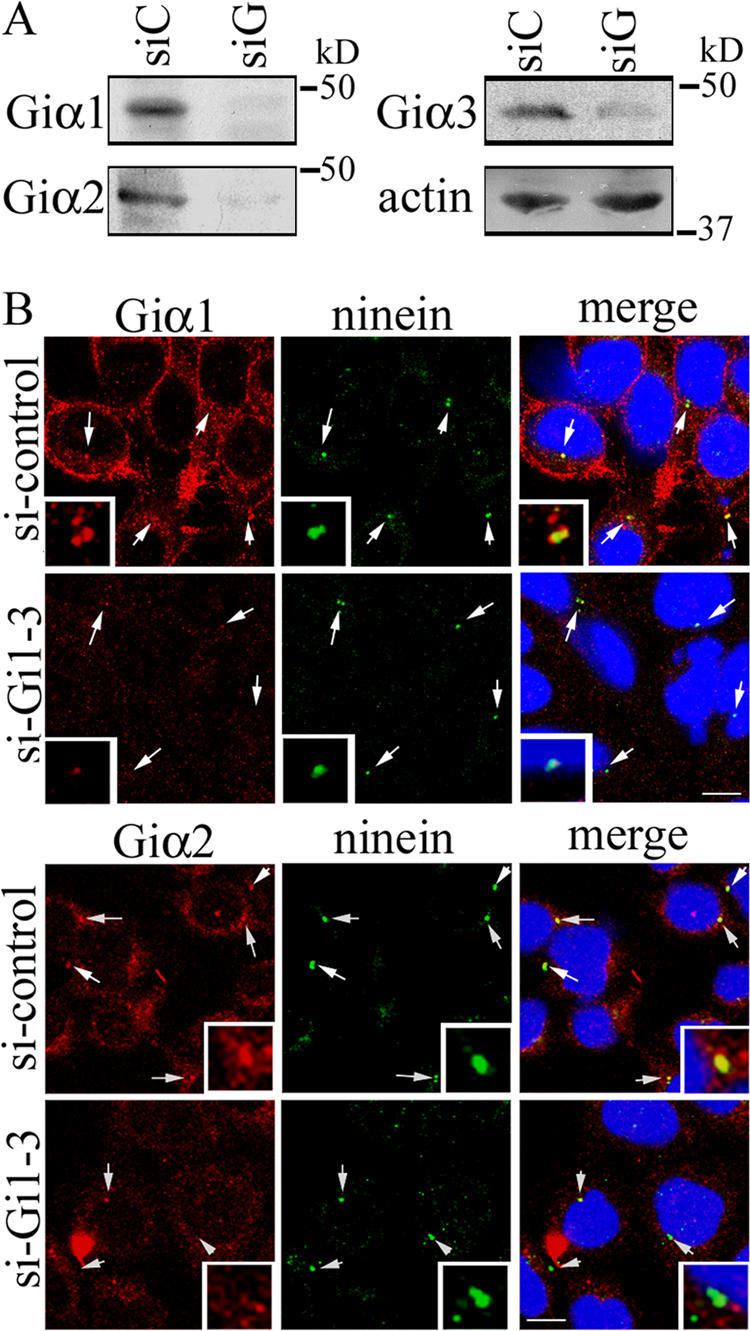
Silencing of Giα1, Giα2, and Giα3 in HeLa cells using siRNA. (A) HeLa cells transfected with control siRNA (siC) or Giα1-3 siRNA (siG) were immunoblotted with anti-Giα1, -Giα2, -Giα3 or -actin antibody. The actin was used as loading control. (B) HeLa cells transfected with control siRNA (si-control) or Giα1-3 siRNA (si-Gi1-3) were stained with anti-Giα1 or -Giα2 antibody, followed by Alexa Fluor 568–conjugated anti–mouse secondary antibody. Cells were subsequently stained with anti-ninein antibody, followed by Alexa Fluor 488–conjugated anti–rabbit secondary antibody. DNA was stained with Hoechst 33342. The arrows indicate centrosomes. Three-fold magnification of the centrosomes is shown in the insets. Merged images are of Alexa Fluor 488, Alexa Fluor 568, and Hoechst 33342. The confocal microscope settings were kept constant, and images were equally treated within each series of images for fair comparison between control siRNA and Giα1-3 siRNA. Bars, 10 μm.
HeLa cells transfected with siRNAs were then monitored for cell cycle progression by videomicroscopy (Fig. 8 A and Videos 7 and 8, available at http://www.jcb.org/cgi/content/full/jcb.200604114/DC1). DIC images of dividing cells transfected with control siRNA showed normal cell division with short or no visible intercellular bridges during cytokinesis. Cells with reduced expression of all three Giα isoforms exhibited mainly cytokinesis defects. Most of these cells appeared to progress normally through mitosis, except for ∼7% of cells with moderately prolonged mitosis. The average duration from metaphase to the initiation of cytokinesis of those cells with prolonged mitosis was 127 min compared with ∼30 min in control cells. More strikingly, ∼50% of the cells examined exhibited cytokinesis defects. A majority of the defective cells separated into two daughter cells after prolonged periods of time in cytokinesis (an average duration of 322 min compared with 33 min in control cells). A few interconnected cells coalesced to form single cells (Fig. 8 A, si-Gi1-3b). Abnormally extended intercellular bridges and misalignment of MTs were also observed with HeLa cells transfected with Giα1-3 siRNA (Fig. 8 B). No apparent defects in mitotic spindle formation were observed (unpublished data). DNA staining using Hoechst 33342 revealed a threefold increase in multinucleation with Giα1-3 siRNA–transfected cells compared with control siRNA–transfected cells (Fig. 8 C). Flow cytometric analysis of live cells confirmed the same threefold increase in multinucleation (Fig. 8 D). The higher percentage of multinucleation observed with the immunocytochemistry experiment is likely caused by the inclusion of cells with micronuclei.
Figure 8.

Reduced Giα expression causes mainly cytokinesis defects in HeLa cells. (A) Time-lapse videomicroscopy was performed on HeLa cells transfected with control siRNA or Gi1-3 siRNA, as described in Materials and methods. Two independent siRNA transfections were performed. Recordings of 40–50 dividing cells were analyzed for each experiment. Eight snapshots of DIC images chosen from 24-h time-lapse images are shown for control, si-Gi1-3a, and si-Gi1-3b. The time shown indicates the hours and minutes lapsed from the beginning of the recording. Two representative snapshots of cytokinesis defects resulting from reduced expression of the Giα isoforms are shown (si-Gi1-3a and si-Gi1-3b; Videos 7 and 8). (B) MTs of si-control– or si-Gi1-3–transfected cells were stained with anti–α-tubulin/Alexa Fluor 568–conjugated secondary antibodies and Hoechst 33324. Three representative images of defective intercellular bridge are shown (si-Gi1-3a–c). The merge shows DIC, Alexa Fluor 568, and DNA staining. The red arrow in the DIC image indicates midbody. (C) A representative image of a multinucleated cell and a cell with micronuclei (indicated by an arrow) is shown. The multinucleated cells from two independent siRNA transfections were counted from confocal images of stained cells (n = 470 and 405 for control; n = 467 and 559 for Gi1-3 knockdown). The average percentage of multinucleated cells is shown in the bar graph. (D) Flow cytometric analysis of si-control– or si-Gi1-3–transfected cells. Three independent siRNA transfections were performed, followed by flow cytometry analysis of Hoechst 33342–stained live cells. A representative result from three experiments is shown. The data are plotted with DNA area against DNA width as measured by Hoechst 33342 incorporation (both on linear scales) to separate the population of multinucleated cells and possible doublets (marked with the large red box) from that of normal cells (marked with the small red box). The percentage of multinucleated cells was calculated by FlowJo (v.6.2.1). The average percentage of multinucleated cells from three experiments is shown in the bar graph. Error bars represent the SD. Videos 7 and 8 are available at http://www.jcb.org/cgi/content/full/jcb.200604114/DC1. Bars, 10 μm.
RGS14 localized in the centrosomes and at the midbody, and silencing of RGS14 caused multinucleation in HeLa (Martin-McCaffrey et al., 2004). Using videomicroscopy, we tested whether the multinucleation caused by RGS14 silencing might also be the result of defective cytokinesis. The aforementioned method was used for siRNA silencing of RGS14 in HeLa. Cells were harvested for RT-PCR or subjected to videomicroscopy 6–7 d after the first transfection. To demonstrate reduced expression of RGS14, RT-PCR was used instead of immunoblotting because our antibody recognized RGS14 protein only in immune cell lysate, where RGS14 expression was relatively high, but not in HeLa cell lysate with a lower level of RGS14 expression (Fig. 9 A). Compared with control cells, 12% of cells transfected with RGS14 siRNA showed slightly longer duration in mitosis, with an average duration of 106 min (unpublished data). Approximately 30% of the RGS14 siRNA-transfected cells exhibited cytokinesis defects (Fig. 9 B and Videos 9 and 10, available at http://www.jcb.org/cgi/content/full/jcb.200604114/DC1). A majority of the defective cells remained in cytokinesis for prolonged periods of time (average duration of 381 min) before separating into two daughter cells. A few interconnected cells with reduced RGS14 expression also coalesced to form single cells. MT staining by anti–α-tubulin antibody revealed a striking defect in HeLa cells transfected with RGS14 siRNA (Fig. 8 C). The thickness of MTs in the intercellular bridge extending from one daughter cell was much thinner than that of the other daughter cell in many interconnected cells.
Figure 9.
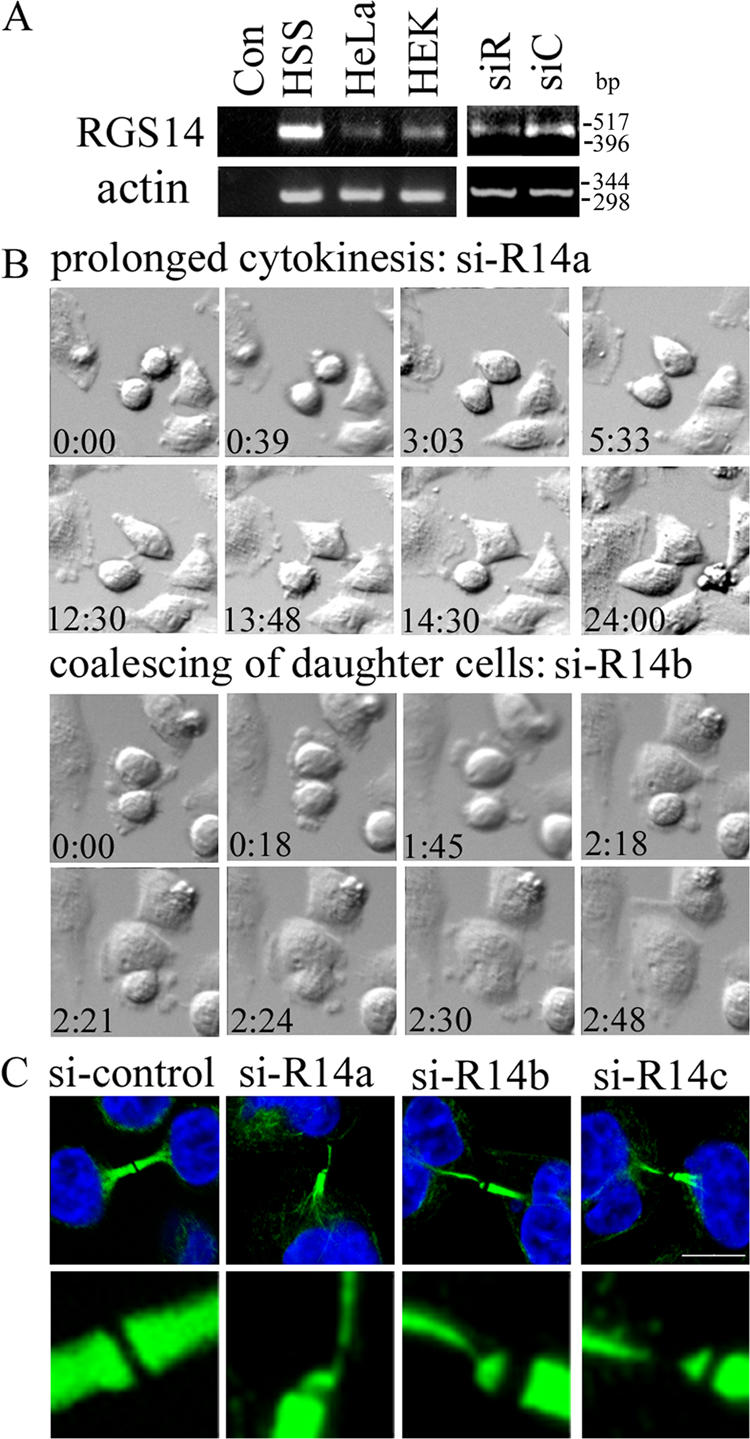
Reduced RGS14 expression causes mainly cytokinesis defects in HeLa cells. (A) A semiquantitative RT-PCR was performed to examine the mRNA level of RGS14 in different cell lines such as B lymphocyte cell line, HS-Sultan (HSS), HeLa, and human embryonic kidney 293 (HEK). RNAs were isolated from these cell lines, as well as from HeLa cells transfected with control siRNA (siC) or RGS14 siRNA (siR). Con, control RT-PCR performed in the absence of cDNA. Human β-actin primers were used to monitor cDNA synthesis. (B) Time-lapse videomicroscopy was performed on HeLa cells transfected with RGS14 siRNA as described earlier. Eight snapshots of DIC images chosen from 24 h time-lapse images for si-R14 a and si-R14b are shown. Time shown indicates the hours and minutes lapsed from the beginning of recording. Two representative snapshots of cytokinesis defects resulting from reduced expression of RGS14 are shown (si-R14a and b; Videos 9 and 10). (C) MTs of si-control- or si-RGS14–transfected cells were stained with anti–α-tubulin/Alexa Fluor 488–conjugated secondary antibodies and Hoechst 33342. In addition to a representative image of an intercellular bridge MT staining in control cells, three representative images of defective MT staining in si-RGS14–transfected cells are shown (si-R14a–c) as merged images of Alexa Fluor 488 and DNA staining. The si-R14 images shown are the projection images of 8–12 0.2-μm-thick optical sections, which are generated by the Leica maximal projection module. (bottom) Sixfold magnification of the midbody area. Three independent siRNA knockdown experiments were performed showing the same results. Videos 9 and 10 are available at http://www.jcb.org/cgi/content/full/jcb.200604114/DC1. Bar, 10 μm.
Discussion
Emerging evidence suggests that heterotrimeric G proteins and their regulators localize in diverse intracellular compartments and may function independently of GPCRs. A recent genetic study has demonstrated a new mechanism for Gα signaling in yeast (Slessareva et al., 2006). The yeast Gα, Gpa1, localizes to endosomes and directly binds PI3K instead of pairing with Gβγ. Intriguingly, the catalytic subunit of PI3K binds preferentially to the activated form of Gα, whereas the regulatory subunit of PI3K prefers the inactive GDP-bound form, suggesting cycling between active and inactive forms of Gα in the endosome. In C. elegans, both Gα and Gβ localize on asters and are implicated in regulation of centrosome movement and spindle positioning (Gotta and Ahringer, 2001). Mammalian proteins that regulate Gα protein activity, such as LGN and RGS14, are also reported to localize in the centrosomes and at the midbody (Du et al., 2001; Martin-McCaffrey et al., 2004; Cho et al., 2005; Blumer et al., 2006). In this study, we show that three mammalian Giα isoforms, Giα1, Giα2, and Giα3, localize in the centrosomes and at the midbody. FRET assays demonstrate that RGS14 can bind Giα protein in the centrosomes via both RGS and GoLoco domains. Preliminary immunocytochemistry data indicate that a mammalian GEF, Ric-8A, also resides in centrosomes (unpublished data). These results suggest that cycling between GDP- and GTP-Giα may also be of functional importance in the mammalian centrosomes. Like the two subunits of yeast PI3K, centrosomal RGS14 can bind both inactive and active form of Giα. LGN, which recruits NuMA to the cell cortex, and possibly to the spindle poles during mitosis, can bind the inactive Giα (Du et al., 2001; Du and Macara, 2004). Centrosomal Ric-8A may dissociate the Giα-GDP–LGN–NuMA complex releasing Giα-GTP and NuMA, thereby regulating the MT function, as reported at the cell cortex (Tall and Gilman, 2005).
Interestingly, forced expression of Giα1 and Giα3 gave two distinct phenotypes during cell division. Both wild-type and the GTPase-deficient form of Giα3 resulted in prolonged mitosis, although they did not affect cytokinesis. The GTPase-deficient form of Giα1 caused defective cytokinesis, but did not impact mitosis. Overexpression of the wild-type Giα1, wild-type Giα2, or the GTPase-deficient form of Giα2 did not reveal any apparent abnormalities during cell division. The difference between Giα1 and Giα3 may arise, in part, from their differing intracellular localization. Giα1 is present in the centrosomes early in mitosis, and it shifts to the midbody, as has been observed with the centrosome proteins Cep55 and centriolin (Doxsey, 2005). It also differs slightly from Giα2 and Giα3 in being more centrally located in the midbody region. Because it is likely that multiple regulators of Giα are involved, the phenotypic difference may also reflect differences in binding specificities of the regulatory proteins. For example, LGN and Ric-8 can bind only the GDP-bound Giα, but not the QL forms. In contrast, RGS14 can bind both GDP- and GTD-bound Giα1 and Giα3, although it is unknown whether and how these interactions are regulated. There may be spatial and/or temporal regulation determining where and when the interaction between various Giα proteins and their regulators occurs. Expression of Giα3 and Giα1 induced altered spindle orientation in mammalian neural progenitors and abnormal rocking motion of chromosome in MDCK cells, respectively, although how these defects affected cell division was not reported (Du and Macara, 2004; Sanada and Tsai, 2005).
Interfering with Giα function by PTX or with Giα expression by siRNAs resulted in mainly defective cytokinesis. The mitotic spindle and spindle midzone (likely regulated by centrosome function) provide spatiotemporal control over many of the mechanical events occurring at the cleavage furrow during cytokinesis (Bringmann, 2005). It is reported that depletion of the centrosome/midbody protein centriolin results in cytokinesis failure without affecting mitosis (Gromley et al., 2003). In Swiss3T3 and neuroepithelial cells, PTX treatment impaired cell proliferation, which was suggested to result from inhibited GPCR signaling (Crouch et al., 2000; Shinohara et al., 2004). However, the PTX-induced intercellular bridge and MT defects may be the consequence of abnormal Gα function in the centrosomes. PTX may also interfere with Giα GDP/GTP exchange by centrosomal Ric-8A. Whether Gα is coupled with Gβγ in the centrosome/midbody has never been examined. Whether PTX can ribosylate Giα proteins complexed with a protein other than Gβγ also remains to be seen. In addition, defective Gα function at the midbody may contribute to the observed defects. Although the exit from cytokinesis was severely delayed in Giα1-3 siRNA-transfected cells, many interconnected cells eventually became separated. This may be caused by the residual expression of Giα proteins in knockdown cells. Reduced expression of RGS14 also induced cytokinesis defects, suggesting that GAP and/or GDI activity may be required for proper cell division. The uneven thickness of intercellular bridge MTs caused by decreased RGS14 expression suggests dysregulation of MT stability/dynamics or uneven pulling force, leading to abnormal cytokinesis. It is not clear how MTs in the intercellular bridge extended from one daughter cell, but not from the other is affected. Contrary to a previous report (Martin-McCaffrey et al., 2004), we did not observe any significant reduction in tubulin staining in the cells transfected with RGS14 siRNA. The difference may be caused by our relatively modest knockdown compared with theirs.
More studies are needed to model a molecular mechanism by which the G proteins and regulators exert their control on cell division via centrosome/midbody function. However, the following mechanisms are conceivable. First, the mechanism proposed for MT pulling force involving Giα, LGN, NuMA, and Ric-8A may be used to regulate MT stability, dynamics, or pulling force at these sites (Du and Macara, 2004; Tall and Gilman, 2005; Blumer et al., 2006). RGS14 may serve to regulate these processes. It may act as a GAP via RGS domain and/or sequester Giα away from LGN via GoLoco domain, thus interfering with NuMA interaction. Second, G proteins may regulate MT function via direct interaction with tubulins. Both Gα and Gβγ modulate MT assembly in vitro, and the heterotrimer inhibits the ability of Gβγ to promote MT assembly, suggesting that G protein activation is required for functional coupling between Gαβγ and tubulin/MTs (Roychowdhury et al., 2006). Third, analogous to the signal transduction at the plasma membrane, G proteins and regulators may activate and deactivate yet-to-be identified centrosome/midbody effectors.
Gα proteins and regulators are present in many different cellular compartments. Therefore, the phenotypes we observe may not arise solely from perturbation of Giα function in the centrosomes/midbody. Dysregulation of the endogenous Gα subunits at the cell cortex/plasma membrane may also contribute to the observed phenotypes. However, differential localization of Gα proteins to centrosome and midbody, the mitotic and cytokinesis defects observed with Gα overexpression, Gα underexpression, or PTX-treated cells, in addition to reported direct role of C. elegans and D. melanogaster Gα and regulators in MT function strongly argue that they play a more direct role during cell division. There are many unresolved issues, such as which proteins are the downstream effectors of centrosomal and midbody G proteins, whether or how the G proteins and their regulators, such as RGS14, LGN, and Ric-8A, are regulated during cell cycle, and how these proteins are targeted. Future studies should help resolve these issues in what is a new and exciting avenue for heterotrimeric G protein research.
Materials and methods
Reagents, DNA constructs, immunocytochemistry, immunoblotting, and siRNA knockdown
A rat Giα1-YFP construct was a gift of M. Lohse (University of Wurzburg, Wurzburg, Germany; Bunemann et al., 2003). The human Giα1-, Giα2-, and Giα3-YFP constructs were provided by S. Gibson (University of Texas Southwestern Medical Center, Dallas, TX; Gibson and Gilman, 2006). The rat and human Giα1-YFP constructs generally produced similar results in our assays. EE-tagged Giα constructs were purchased from Unite Mixte de Recherche cDNA Resource Center. The antibodies used were purchased as follows: anti–γ-tubulin from Sigma-Aldrich; anti-EE monoclonal from Covance; anti-ninein polyclonal from Abcam; monoclonal anti-Giα1 from Millipore; polyclonal monoclonal anti-Giα2 from EMD Biosciences; and monoclonal anti-Giα1 and -Giα2 and polyclonal anti-Giα3 from Santa Cruz Biotechnology, Inc. To construct CFP fusions, various mouse RGS14 (available under GenBank accession no. U85055) DNA fragments were cloned into pN1-CFP vector in frame with C-terminal CFP, and RGS14 and Giα point mutants were generated as previously described (Cho et al., 2005). Immunocytochemistry and immunoblotting were performed as previously described (Cho et al., 2005). Cells were fixed with 4% PFA/0.1% Triton-X100 for MT staining using anti–α-tubulin antibody or with 50% acetone/50% methanol for centrosome staining using antibodies raised against centrosome proteins.
The method of Krumins and Gilman (2006) was closely followed for Giα siRNA knockdown in HeLa cells. Giα1/3 (721–739; CCGAAUGCAUGAAAGCAUG) and Giα2 (681–699; CUUGAGCGCCUAUGACUUG) siRNAs, control siRNA, and DY547-tagged siRNA to monitor transfection efficiency were purchased from Dharmacon. For RGS14 siRNA silencing, three RGS14 siRNAs (216–226, AACGGGCGCAUGGUUCUGGCU; 347–367, AACCGAGGAGCAGCCUGUGGC; 474–494, AAGGCCUGCGAGCGCUUCCAG; available under GenBank accession no. NM_006480) were selected based on the Dharmacon siRNA user guide and purchased from Dharmacon. HeLa cells were transfected with the pool of three siRNAs, as described above.
Confocal microscopy and FRET assays
Images were collected on a TCS-SP2 or SP5 confocal microscope (Leica) and processed as previously described (Cho et al., 2005), except that 561- and 405-nm diode lasers were used for Alexa Fluor 568 and Hoechst 33342, respectively. When it was not possible to eliminate cross-talk between channels, the images were collected sequentially and later merged. The exposure times were kept equal within each series of images and chosen such that all pixel intensities were within the linear range. A 63× oil lens was used, unless mentioned otherwise. Confocal zoom factors between 1 and 8 (Z1 to Z8) were used.
Acceptor photobleaching module of the Leica software was used for acceptor photobleaching FRET assay. The 405-nm laser line was used to excite CFP and the 514-nm laser line was used to excite and bleach YFP. Microscopic fields containing two to three centrosomes that expressed both RGS14-CFP and Giα1-YFP with similar levels of expression were found. A region of interest was drawn on only one of the centrosomes in the field or on a randomly chosen area in the cytoplasm for bleaching. The Leica confocal software was configured to achieve a 50 or 80% bleach of YFP only in the selected region of interest. FRET efficiency was calculated as follows: FRETeff = Dpost − Dpre/Dpost for all Dpost > Dpre when Dpre and Dpost were donor fluorescence intensity before and after photobleaching, respectively. The Leica acceptor photobleaching method collected 8-bit images (gray scale 0–256). Therefore, any fluorescent intensity <20 was regarded as background, as these were near the limits of detection. At least 20 different cells were examined for the presence of FRET signals in each experiment. The FRET efficiencies of each construct were averaged for comparison.
For live cell FRET analysis, cells were imaged using sensitized emission routine of the Leica software. A CFP-YFP fusion was used as a positive control. Images of RGS14-CFP only or Giα1-YFP only were acquired to correct for cross talk between channels. FRET efficiency was calculated as follows: FRETeff = B − b × A − (c − a × b) × C/C where A represents the fluorescence intensity of channel 1 (donor excitation/donor emission); B represents the fluorescence intensity of channel 2 (donor excitation/FRET emission); C represents the fluorescence intensity of channel 3 (acceptor excitation/acceptor emission); a represents the correction factor of acceptor only measurement (donor emission × excitation for the donor/acceptor emission × excitation for the acceptor); b represents the correction factor of donor only measurement (acceptor emission × excitation for the donor/donor emission × excitation for the donor); and c represents the correction factor of acceptor only measurement (acceptor emission × excitation for the donor/acceptor emission × excitation for the acceptor). The Leica sensitized emission module used 12-bit images (gray scale 0–4,096). Therefore, any fluorescent intensity <200 in all three channels was regarded as background, as these were at the limit of detection.
Time-lapse videomicroscopy and flow cytometry
A microscope (DMIRBE; Leica) equipped with a 1,376 × 1,040 cooled charge-coupled device camera (Sensicam QE; Cooke) was used to capture time-lapse images. Microscope settings such as exposure time and magnification of objective (20×) were kept constant. This microscope was also equipped with Pe-Con environmental chamber (PeCon GmbH) that maintained temperature, CO2, and humidity levels for long-term imaging. DIC and fluorescence images were captured using ImagePro (Media Cybernetics) or IpLab (BD Biosciences). The collected images were processed using the Imaris (Bitplane, Inc.) and reconstructed into videos using QuickTime software.
For cell cycle analysis, live cells were stained with the viable DNA dye Hoechst 33342 and subjected to flow cytometry using LSR II flow cytometer (BD Biosciences). FACSDiva software (BD Biosciences) and FlowJo 6.2.1 (Tree Star, Inc.) were used for data acquisition and analysis, respectively.
Online supplemental material
Fig. S1 shows specificity of anti-Giα1, -Giα2, and -Giα3, antibodies. Fig. S2 reconfirms intracellular localization pattern of endogenous Giα1 and Giα2 using a second set of anti-Giα1 monoclonal and anti-Giα2 polyclonal antibodies, as well as cells isolated from Giα2 knockout mice. Video 1 shows normal cell division of HeLa cells expressing vector control YFP. Video 2 shows normal cell division of HeLa cells expressing Giα2 QL-YFP. Video 3 shows prolonged mitosis of HeLa cells expressing wild-type Giα3-YFP. Video 4 shows prolonged cytokinesis of HeLa cells expressing Giα1 QL-YFP. Video 5 shows normal cell division of NIH3T3 cells. Video 6 shows defective cytokinesis of PTX-treated NIH3T3 cell. Video 7 shows normal cell division of HeLa cells transfected with control siRNA. Video 8 shows defective cytokinesis of HeLa cells transfected with Gi1-3 siRNA. Video 9 shows defective cytokinesis of HeLa cells transfected with RGS14 siRNA. Video 10 shows coalescing of two daughter HeLa cells transfected with RGS14 siRNA. The online version of this article is available at http://www.jcb.org/cgi/content/full/jcb.200604114/DC1.
Supplementary Material
Acknowledgments
We would like to thank the National Institute of Allergy and Infectious Disease (NIAID) Biological Imaging Facility for the help with cell imaging and FRET study; Dr. James McNally at the NCI for helpful discussion regarding acceptor photobleaching technique; Mary Rust for editorial assistance; and Dr. Anthony Fauci for his support.
This work is supported by the intramural research program, NIAID, National Institutes of Health.
Abbreviations list: DIC, differential interference contrast; EE, Glu-Glu; FRET, fluorescence resonance energy transfer; GAP, GTPase-activating protein; GDI, guanine nucleotide dissociation inhibitor; GEF, guanine nucleotide exchange factor; GPCR, G protein–coupled receptor; MT, microtubule; PTX, pertussis toxin; RGS, regulator of G protein signaling.
References
- Blumer, J.B., R. Kuriyama, T.W. Gettys, and S.M. Lanier. 2006. The G-protein regulatory (GPR) motif-containing Leu-Gly-Asn-enriched protein (LGN) and Gialpha3 influence cortical positioning of the mitotic spindle poles at metaphase in symmetrically dividing mammalian cells. Eur. J. Cell Biol. 85:1233–1240. [DOI] [PubMed] [Google Scholar]
- Bringmann, H. 2005. Cytokinesis and the spindle midzone. Cell Cycle. 4:1709–1712. [DOI] [PubMed] [Google Scholar]
- Bunemann, M., M. Frank, and M.J. Lohse. 2003. Gi protein activation in intact cells involves subunit rearrangement rather than dissociation. Proc. Natl. Acad. Sci. USA. 100:16077–16082. [DOI] [PMC free article] [PubMed] [Google Scholar]
- Cho, H., D.U. Kim, and J.H. Kehrl. 2005. RGS14 is a centrosomal and nuclear cytoplasmic shuttling protein that traffics to promyelocytic leukemia nuclear bodies following heat shock. J. Biol. Chem. 280:805–814. [DOI] [PubMed] [Google Scholar]
- Crouch, M.F., G.W. Osborne, and F.S. Willard. 2000. The GTP-binding protein G(ialpha) translocates to kinetochores and regulates the M-G(1) cell cycle transition of Swiss 3T3 cells. Cell. Signal. 12:153–163. [DOI] [PubMed] [Google Scholar]
- Doxsey, S.J. 2005. Molecular links between centrosome and midbody. Mol. Cell. 20:170–172. [DOI] [PubMed] [Google Scholar]
- Du, Q., and I.G. Macara. 2004. Mammalian Pins is a conformational switch that links NuMA to heterotrimeric G proteins. Cell. 119:503–516. [DOI] [PubMed] [Google Scholar]
- Du, Q., P.T. Stukenberg, and I.G. Macara. 2001. A mammalian Partner of inscuteable binds NuMA and regulates mitotic spindle organization. Nat. Cell Biol. 3:1069–1075. [DOI] [PubMed] [Google Scholar]
- Gotta, M., and J.Ahringer. Distinct roles for Galpha and Gbetagamma in regulating spindle position and orientation in Caenorhabditis elegans embryos. Nat. Cell Biol. 3:297–300 [DOI] [PubMed] [Google Scholar]
- Gibson, S.K., and A.G. Gilman. 2006. Gialpha and Gbeta subunits both define selectivity of G protein activation by alpha2-adrenergic receptors. Proc. Natl. Acad. Sci. USA. 103:212–217. [DOI] [PMC free article] [PubMed] [Google Scholar]
- Gromley, A., A. Jurczyk, J. Sillibourne, E. Halilovic, M. Mogensen, I. Groisman, M. Blomberg, and S. Doxsey. 2003. A novel human protein of the maternal centriole is required for the final stages of cytokinesis and entry into S phase. J. Cell Biol. 161:535–545. [DOI] [PMC free article] [PubMed] [Google Scholar]
- Hampoelz, B., and J.A. Knoblich. 2004. Heterotrimeric G proteins: new tricks for an old dog. Cell. 119:453–456. [DOI] [PubMed] [Google Scholar]
- Han, S.B., C. Moratz, N.N. Huang, B. Kelsall, H. Cho, C.S. Shi, O. Schwartz, and J.H. Kehrl. 2005. Rgs1 and Gnai2 regulate the entrance of B lymphocytes into lymph nodes and B cell motility within lymph node follicles. Immunity. 22:343–354. [DOI] [PubMed] [Google Scholar]
- Hess, H.A., J.C. Roper, S.W. Grill, and M.R. Koelle. 2004. RGS-7 completes a receptor-independent heterotrimeric G protein cycle to asymmetrically regulate mitotic spindle positioning in C. elegans. Cell. 119:209–218. [DOI] [PubMed] [Google Scholar]
- Krumins, A.M., and A.G. Gilman. 2006. Targeted knockdown of G protein subunits selectively prevents receptor-mediated modulation of effectors and reveals complex changes in non-targeted signaling proteins. J. Biol. Chem. 281:10250–10262. [DOI] [PubMed] [Google Scholar]
- Martin-McCaffrey, L., F.S. Willard, A.J. Oliveira-dos-Santos, D.R. Natale, B.E. Snow, R.J. Kimple, A. Pajak, A.J. Watson, L. Dagnino, J.M. Penninger, et al. 2004. RGS14 is a mitotic spindle protein essential from the first division of the mammalian zygote. Dev. Cell. 7:763–769. [DOI] [PubMed] [Google Scholar]
- Mittal, V., and M.E. Linder. 2004. The RGS14 GoLoco domain discriminates among Galphai isoforms. J. Biol. Chem. 279:46772–46778. [DOI] [PubMed] [Google Scholar]
- Ponting, C.P. 1999. Raf-like Ras/Rap-binding domains in RGS12- and still-life-like signalling proteins. J. Mol. Med. 77:695–698. [DOI] [PubMed] [Google Scholar]
- Rattner, J.B. 1992. Mapping the mammalian intercellular bridge. Cell Motil. Cytoskeleton. 23:231–235. [DOI] [PubMed] [Google Scholar]
- Roychowdhury, S., L. Martinez, L. Salgado, S. Das, and M.M. Rasenick. 2006. G protein activation is prerequisite for functional coupling between Galpha/Gbetagamma and tubulin/microtubules. Biochem. Biophys. Res. Commun. 340:441–448. [DOI] [PubMed] [Google Scholar]
- Sanada, K., and L.H. Tsai. 2005. G protein betagamma subunits and AGS3 control spindle orientation and asymmetric cell fate of cerebral cortical progenitors. Cell. 122:119–131. [DOI] [PubMed] [Google Scholar]
- Sanger, J.M., M.B. Pochapin, and J.W. Sanger. 1985. Midbody sealing after cytokinesis in embryos of the sea urchin Arabacia punctulata. Cell Tissue Res. 240:287–292. [DOI] [PubMed] [Google Scholar]
- Schulze, E.S., and S.H. Blose. 1984. Passage of molecules across the intercellular bridge between post-mitotic daughter cells. Exp. Cell Res. 151:367–373. [DOI] [PubMed] [Google Scholar]
- Shinohara, H., J. Udagawa, R. Morishita, H. Ueda, H. Otani, R. Semba, K. Kato, and T. Asano. 2004. Gi2 signaling enhances proliferation of neural progenitor cells in the developing brain. J. Biol. Chem. 279:41141–41148. [DOI] [PubMed] [Google Scholar]
- Shu, F.J., S. Ramineni, W. Amyot, and J.R. Hepler. 2006. Selective interactions between Gialpha1 and Gialpha3 and the GoLoco/GPR domain of RGS14 influence its dynamic subcellular localization. Cell. Signal. 19:163–176. [DOI] [PubMed] [Google Scholar]
- Slessareva, J.E., S.M. Routt, B. Temple, V.A. Bankaitis, and H.G. Dohlman. 2006. Activation of the phosphatidylinositol 3-kinase Vps34 by a G protein alpha subunit at the endosome. Cell. 126:191–203. [DOI] [PubMed] [Google Scholar]
- Stow, J.L., J.B. de Almeida, N. Narula, E.J. Holtzman, L. Ercolani, and D.A. Ausiello. 1991. A heterotrimeric G protein, Gαi-3, on Golgi membranes regulates the secretion of a heparan sulfate proteoglycan in LLC-PK1 epithelial cells. J. Cell Biol. 114:1113–1124. [DOI] [PMC free article] [PubMed] [Google Scholar]
- Susa, M., G.J. Standke, M. Jeschke, and D. Rohner. 1997. Fluoroaluminate induces pertussis toxin-sensitive protein phosphorylation: differences in MC3T3-E1 osteoblastic and NIH3T3 fibroblastic cells. Biochem. Biophys. Res. Commun. 235:680–684. [DOI] [PubMed] [Google Scholar]
- Tall, G.G., and A.G. Gilman. 2005. Resistance to inhibitors of cholinesterase 8A catalyzes release of Galphai-GTP and nuclear mitotic apparatus protein (NuMA) from NuMA/LGN/Galphai-GDP complexes. Proc. Natl. Acad. Sci. USA. 102:16584–16589. [DOI] [PMC free article] [PubMed] [Google Scholar]
- Traver, S., C. Bidot, N. Spassky, T. Baltauss, M.F. De Tand, J.L. Thomas, B. Zalc, I. Janoueix-Lerosey, and J.D. Gunzburg. 2000. RGS14 is a novel Rap effector that preferentially regulates the GTPase activity of galphao. Biochem. J. 350:19–29. [PMC free article] [PubMed] [Google Scholar]
- Wilkie, T.M., and L. Kinch. 2005. New roles for Galpha and RGS proteins: communication continues despite pulling sisters apart. Curr. Biol. 15:R843–R854. [DOI] [PubMed] [Google Scholar]
- Wilson, B.S., M. Komuro, and M.G. Farquhar. 1994. Cellular variations in heterotrimeric G protein localization and expression in rat pituitary. Endocrinology. 134:233–244. [DOI] [PubMed] [Google Scholar]
Associated Data
This section collects any data citations, data availability statements, or supplementary materials included in this article.