

Abstract
Kinesin is a superfamily of motor proteins that uses the energy of adenosine triphosphate hydrolysis to move and generate force along microtubules. A notable exception to this general description is found in the kinesin-13 family that actively depolymerizes microtubules rather than actively moving along them. This depolymerization activity is important in mitosis during chromosome segregation. It is still not fully clear by which mechanism kinesin-13s depolymerize microtubules. To address this issue, we used electron microscopy to investigate the interaction of kinesin-13s with microtubules. Surprisingly, we found that proteins of the kinesin-13 family form rings and spirals around microtubules. This is the first report of this type of oligomeric structure for any kinesin protein. These rings may allow kinesin-13s to stay at the ends of microtubules during depolymerization.
Introduction
Several electron microscope studies have shown that in conditions of high kinesin affinity for microtubules (e.g., in the presence of the nonhydrolyzable ATP analogue adenosine- 5′-([β,γ]-imido)triphosphate [AMPPNP]), an excess of kinesin over tubulin produces a uniform decoration pattern in which the motor domain (MD) binds with a well-defined configuration to each tubulin heterodimer. The MD is defined here as the ∼320-amino-acid region, highly conserved and with similar 3D structure among all the kinesin superfamily, possessing the ATPase and microtubule binding activities (Vale and Fletterick, 1997). One MD binds each αβ tubulin heterodimer with its longer axis approximately parallel to the microtubule axis. This binding pattern is similar for several kinesin families (Mandelkow and Hoenger, 1999), including a member of the kinesin-13 family (Moores et al., 2003). However, there is evidence that the interaction of kinesin-13 with the microtubule lattice has a different catalytic effect than in other kinesins. In contrast to conventional kinesin (kinesin-1), the interaction of kinesin-13 with the microtubule lattice results in much less ATPase stimulation and no unidirectional movement. Instead, kinesin-13 is thought to undergo one-dimensional diffusion along the microtubule until reaching the ends, where they induce depolymerization in an ATP-dependent manner (Hunter et al., 2003). To understand the structural basis of this distinct behavior by kinesin-13, we investigate by electron microscopy the structure of the complex formed between microtubules and several kinesin-13 proteins, including two of the three kinesin-13s present in the Drosophila melanogaster genome, KLP10A and KLP59C. These two kinesin-13s cooperate to control microtubule depolymerization during mitosis (Rogers et al., 2004). Homologous kinesins with similar function are also found in human cells (Ganem and Compton, 2004). We also investigated mitotic centromere- associated kinesin (MCAK), a kinesin-13 from hamster (Cricetus griseus) that has been used in many previous studies on kinesin-13s (Wordeman and Mitchison, 1995).
Results and discussion
Kinesin-13s form oligomeric rings and spirals around microtubules
For this study, we made kinesin-13 protein constructs that include the MD only or the MD and additional amino acids (called the neck) N-terminal to the MD (Fig. 1 A). A previous study has indicated that only the MD of kinesin-13 is necessary for microtubule depolymerization activity (Moores et al., 2002), but the additional neck sequences have been shown to be important for microtubule interaction and efficient depolymerization (Maney et al., 2001).
Figure 1.

Electron micrograph gallery of microtubules with kinesin-13 rings. (A) Protein constructs used with their MDs aligned. Kinesin-1 amino acid sequence numbers correspond to human Kif5b. The MDs are indicated in solid blue for kinesin-1 and red for the kinesin-13s. The neck domain is yellow. (B) Rings formed by KLP10A MD + neck construct in the presence of AMPPNP on taxol-stabilized microtubules. (C) KLP10A MD-only construct in the presence of AMPPNP on taxol-stabilized microtubules. (D) KLP59C MD + neck construct in the presence of AMPPNP on taxol-stabilized microtubules. (E) KLP10A MD-only construct in the presence of AMPPNP on GMPCPP-stabilized microtubules. (F) MCAK MD + neck construct on taxol-stabilized microtubules. Bar, 50 nm.
We found that in the presence of AMPPNP, all the kinesin-13 constructs investigated form rings and spirals around microtubules (Fig. 1). Individual or clusters of kinesin-13 rings can be situated anywhere along the microtubule without apparent preference for the microtubule ends. These structures have not been reported in any previous structural study of the interactions of kinesins with microtubules. The rings are specific for kinesin-13s. Control experiments with conventional kinesin (human Kif5b, MD construct) performed under exactly the same conditions produced only regular microtubule lattice decoration (unpublished data), similar to what has been observed previously by many laboratories (Mandelkow and Hoenger, 1999). The fact that we found these rings with constructs from three different kinesin-13s from two different animal species strongly suggests that ring formation is a general characteristic of the kinesin-13 family.
The minimal construct investigated in this work, the KLP10A MD-only construct, forms rings. Comparing constructs with and without the neck, we found that after mixing KLP10A MD + neck protein with microtubules (1:1 molar ratio kinesin/tubulin heterodimer), ∼20% of the microtubules have at least one ring. In similar conditions with the KLP10A MD-only protein, 80% of the microtubules have at least one ring and many have numerous rings (Fig. 1, C and E). Rings formed on either taxol- or guanosine-5′-([α,β]-methyleno)triphosphate (GMPCPP)–stabilized microtubules (Fig. 1 E). Thus, ring formation is independent of the nucleotide condition of the polymerized tubulin.
Rings only formed in the presence of both microtubules and kinesin-13 proteins. However, ring-type structures are also found when unpolymerized tubulin is incubated with kinesin-13s (Fig. 2), suggesting that the observed rings may be oligomers of tubulin and kinesin-13 MDs. The rings formed with free tubulin appear as one or more concentric rings with an outside diameter of 42 ± 3.4 nm (mean ± SD; n = 32).
Figure 2.

Rings formed by free tubulin and kinesin-13s. (A) Gallery of selected ring structures. These rings were obtained by incubating free tubulin with the KLP10A MD-only construct. Bar, 42 nm. (B) Depiction of a possible pathway for ring formation. Kinesin-13s (red) interact with free tubulin (blue), forming ring-like structures that bind microtubules (black).
Occasionally, long regular spirals formed around the microtubule (Fig. 3, A, D, and E). These spirals extend ∼12 nm from the microtubule surface (Fig. 3 C). In contrast, in the typical kinesin–microtubule complex, the microtubule-bound MD extends radially only ∼4 nm from the microtubule surface (Marx et al., 2006). The spirals follow the shallow tubulin heterodimer helical path on the microtubule lattice (∼0.9 nm rise between adjacent protofilaments), creating an axial periodicity of 8 nm (Fig. 3 B), typical of microtubules decorated with kinesin proteins. This result suggests that the kinesin-13 MD is an integral part of the ring structure, likely to be involved in microtubule binding. However, unlike other kinesins, this interaction is not very tight or stereospecific, as rings are found at variable angles relative to the microtubule (Fig. 1). Immunogold labeling against kinesin-13 also forms ring-like structures on the microtubule, confirming that kinesin-13 is part of the ring (Fig. S1, available at http://www.jcb.org/cgi/content/full/jcb.200605194/DC1).
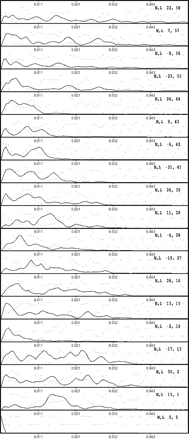
Figure 3.

Kinesin-13 spirals. (A) A spiral formed by the KLP10A MD-only construct on taxol-stabilized microtubules. Yellow arrows indicate the shallow pitch tubulin helical paths followed by the spirals. (B) 2D power spectrum of A reveals strong layer line at orders of 1/8 nm−1 (red arrows, 1/8 nm−1; black arrows, 1/4 nm−1), indicating that the spirals follow the same axial repeat as the αβ tubulin heterodimer (8 nm). (C) Density profile projected along the microtubule axis (corresponding to microtubule in A). Portions of the profile attributed to the rings are red. Rings extend ∼12 nm from the microtubule surface. Three density peaks can be recognized in the ring areas (red). (D) KLP10A MD-only spiral following a single tubulin helical path. The pitch is 16 nm, indicating that the spiral follows one of the two-start tubulin helical paths on the microtubule. (E) KLP10A MD-only spiral formed on a 15-protofilament microtubule. (F) Lateral density projection of a 3D reconstruction of a spiral-microtubule specimen like the one showed in E. Bar, 25 nm.
The kinesin-13 spirals sometimes follow only one of the several tubulin helical path starts (1–3, depending on the number of protofilaments in the microtubule; Fig. 3 D), forming an axial periodicity with a spacing that is a higher multiple of 8 nm (16 nm in the case shown in Fig. 3 D). These isolated spirals indicate that the strongest interactions holding the spiral together are lateral (along the shallow tubulin helical path) and not axial (along the microtubule axis).
Fig. 3 E shows a microtubule with 15 protofilaments. The spirals following the two-start tubulin helical paths are indicated by the yellow arrows. This type of microtubule is suitable for helical 3D reconstruction because of the lack of discontinuities or seams (Sosa and Milligan, 1996). A lateral projection of a 3D reconstruction calculated from the microtubule of Fig. 3 E is shown in Fig. 3 F.
Molecular structure of the rings
To obtain further insights into the structure and mechanism of ring formation, we calculated a 3D reconstruction of spirals formed on 15-protofilament microtubules like those shown in Fig. 3 E (spiral formed by the KLP10A MD-only construct). Fig. 4 (A and B) shows surface representations of the calculated 3D density, color coded according to the radial position from the helical axis. The outermost structure (blue) forms a relatively continuous structure that resembles a tubulin protofilament. In end-on views (Fig. 4 B), the map outer region (blue and green) closely resembles end-on projections of kinesin-13 interacting with isolated protofilament rings (Moores et al., 2002), indicating that the rings may be formed by kinesin-13 MDs interacting with an isolated tubulin protofilament. We investigated this possibility by fitting the atomic structures of a kinesin MD and the tubulin heterodimer into the 3D electron microscopy density map. For the fitting, we used the coordinates of the complex formed by a kinesin MD and the tubulin heterodimer in a microtubule (Protein Data Bank accession no. 1IA0). We found that a very good fit to each asymmetric unit in the 3D map can be obtained with two of these complexes (Fig. 4 C). For the fitting, only the relative position between the two complexes was changed, keeping constant the relative positions of the proteins within each complex. Fig. 4 (D–F) shows several orientations of the molecular model inside the 3D electron density map (transparent gray). The atomic structures fit very well into the electron density map, particularly in the outer parts of the rings (blue tubulin and green kinesin MD).
Figure 4.

Kinesin-13 spirals 3D reconstruction. (A) Slightly tilted side view of a surface representation of the calculated 3D density map corresponding to spirals of KLP10A MD-only constructs on 15-protofilament microtubules. The surface is color coded according to the radial distance from the helical axis. (Colors ordered red, yellow, green, and blue according to radial position from microtubule axis). (B) End-on view of the surface representation of the 3D density map. Color coded as in A. (C) Crystal structures of two kinesin tubulin complexes (Protein Data Bank accession no. 1IA0; Kikkawa et al., 2001). Each of the two complexes is outlined by a black contouring line. Tubulin heterodimers are blue in one complex and red in the other. The kinesin MD is green in one complex and yellow in the other. The molecules are colored to match their radial position within the 3D map after fitting. (D) Side view of the electron density map (clear gray) with the two kinesin–tubulin complexes fitted in one of the map asymmetric units. Densities corresponding to other asymmetric units in the front and back have been omitted for clarity. (E) Front view of the outer ring densities with fitted tubulin heterodimer molecule. (F) End-on view of the electron density with fitted molecules inside.
The inner region of the model also fits relatively well with the density map, but a small electron density remains unaccounted for (visible in Fig. 4 F above and below the yellow kinesin MD). Also, the densities corresponding to α and β tubulin in the microtubule are different even though they are expected to be similar at the current map resolution (∼3 nm). Differences between the α and β tubulin have been observed previously in negatively stained specimens (Hoenger et al., 1995), so this may represent a staining artifact. Despite these small discrepancies, the two kinesin MD–tubulin complexes oriented as shown in Fig. 4 are in very good agreement overall with the 3D map of the kinesin-13 spiral complexes.
The molecular model shown in Fig. 4 has several noteworthy features. (1) Contacts along the protofilament in the outside ring (blue) must stabilize the spiral because there are no contacts between adjacent axial levels. (2) The innermost part of the ring is a kinesin MD (yellow) interacting with tubulin in the microtubule lattice (red) in the same configuration found in many kinesin–microtubule complexes. (3) The contacts between kinesin and tubulin are similar in the outer part of the ring and in the microtubule lattice. (4) Interactions between two kinesin MDs bridge the inner and outer ring regions. Features 1 and 2 nicely explain why the spirals follow the tubulin lattice helical path (see the previous section). Features 2 and 3 are consistent with previous structural work that has shown kinesin-13 MDs interacting with the microtubule lattice (Moores et al., 2003) or isolated protofilaments (Moores et al., 2002) in similar configurations. Feature 4 points to interactions between kinesin molecules as part of the mechanism leading to ring and spiral formation. These interactions are mediated by residues on the kinesin-13 MD away from the ones involved in the kinesin–tubulin interface.
The ATP-bound form of kinesin-13s induces ring formation
We observed rings in the presence of AMPPNP or the slowly hydrolyzable ATP analogue ATP-γ-S. We did not find rings in the presence of ATP, ADP, or ADP+AlF4 − (used to mimic the ADP-Pi state). Thus, ring formation is favored specifically by the ATP-bound state. During steady ATP hydrolysis, the rings would be expected to be transient structures, unless the ATP-bound state is prolonged. Interestingly, the ATPase activity of kinesin-13s is stimulated preferentially by the microtubule ends but not the lattice (Hunter et al., 2003). Furthermore, recent work has shown that kinesin-13 in solution has a γ-phosphate–bound nucleotide (ATP or ADP-Pi) instead of ADP as in other kinesins (Helenius et al., 2006). Therefore, kinesin-13s, still in the ATP-bound state, could interact with each other on the microtubule lattice to form rings. If only the kinesin-13s at the very end of the microtubule are engaged in ATP hydrolysis and microtubule depolymerization (Desai et al., 1999; Hunter et al., 2003), then other kinesin-13s forming rings along the microtubule will be pushed as the depolymerizing end advances. In support of this idea, we have observed kinesin-13 accumulation at the depolymerizing end of microtubules in vivo (see the next section).
Kinesin-13s stay at depolymerizing microtubule ends
One possible function of the rings could be to form a movable sleeve around the microtubule. Such a sleeve could serve two purposes: to keep kinesin-13s associated with the microtubule end, facilitating steady depolymerization, and/or to couple microtubule depolymerization with movement of cargoes associated with the rings. To test these possibilities, we investigated the behavior of overexpressed EGFP-KLP59C in S2 cells during interphase. If KLP59C form rings around microtubules, then rings could be gathered up by the depolymerizing microtubule end, resulting in ring accumulation at the shortening end.
Fig. 5 A shows an example of a depolymerizing microtubule decorated with EGFP-KLP59C in a live S2 cell. The fluorescence intensity at the tip of the depolymerizing microtubule increases steadily as the microtubule depolymerizes, whereas the intensities at points on the microtubule away from the end remain relatively constant (Fig. 5, A–D). Only when a bright punctum (containing many EGFP-KLP59C molecules) is released from the microtubule end (Fig. 5 A, green arrows) does the fluorescence at the depolymerizing end decrease.
Figure 5.

Kinesin-13 and tubulin labeled depolymerizing microtubules in S2 cells. (A) Sequence of video frames (1-s intervals) showing a depolymerizing microtubule at the cell periphery coated with expressed EGFP-KLP59C. As the microtubule depolymerizes, fluorescence at its end (red arrow) increases. A bright fluorescent punctum is left behind (green arrows) as the microtubule continues depolymerization. (B) Depiction of an interpretation of the events observed in A. EGFP-KP59C binds along the microtubule, making it fluorescent. EGFP-KLP59C on the depolymerizing microtubule is pushed and accumulates at the end, causing an increase in fluorescence. When a group or oligomer of KLP59C is released from the microtubule, fluorescence drops abruptly. (C) Fluorescence intensity versus time and microtubule length change versus time for the EGFP-KLP59C–labeled microtubule shown in A. The red line is fluorescence intensity at the depolymerizing end. The blue line is fluorescence intensity at an arbitrary point along the microtubule away from the depolymerizing end. The green line is the microtubule length change. The black arrow above the red line (at time = 8 s) marks the point at which a bright fluorescence punctum was released from the microtubule. (D) Another example with conditions the same as in C. (E) Fluorescence intensity of a depolymerizing microtubule in EGFP-tubulin–expressing cells but without kinesin-13 overexpression.
Protein accumulation at the depolymerizing end is not an obligatory event. Shortening microtubules in cells expressing EGFP-tubulin but not overexpressing kinesin-13s (so that the observed microtubules will have few or no kinesin-13s) showed no increase in fluorescence at the depolymerizing microtubule end (Fig. 5 E). We find that the depolymerizing end of EGFP-KLP59C increases in intensity by 79 ± 16% (mean ± SEM; n = 8) per 1 μm of microtubule length decrease (excluding events in which a sudden drop in intensity was associated with the release of a bright punctum from the microtubule). In the case of EGFP-tubulin microtubules, the depolymerizing ends change fluorescence by −6 ± 3% (mean ± SEM; n = 10) per 1 μm of microtubule length decrease. The difference between EGFP-KLP59C– and EGFP-tubulin–labeled microtubules was statistically significant (P < 0.01). These results show that KLP59C specifically accumulates at the depolymerizing microtubule end and slides along the tubulin lattice as the depolymerizing end advances.
Functional implications of kinesin-13 rings
Kinesin-13 rings could help depolymerization by acting on all protofilaments at once or by keeping many kinesin-13s close to the depolymerizing end. The rings could also create shearing forces between protofilaments, breaking their lateral contacts and inducing depolymerization.
Another intriguing possibility is that the rings may be able to slide along the microtubule lattice like a loose sleeve. Our in vivo data with EGFP-KLP59C (Fig. 5) support this possibility. Recently, the yeast Dam1–DASH kinetochore complex was shown to form rings around microtubules that work as movable sleeves. Based on these data, it was proposed that a Dam1–DASH sleeve at the kinetochore allows an associated chromosome to be pulled toward the spindle pole while the attached microtubule end is depolymerizing (Miranda et al., 2005; Westermann et al., 2005, 2006). However, homologues of the Dam1–DASH complex in higher eukaryotes have not been identified (Salmon, 2005). Mitotic KLP10A and KLP59C are located at spindle poles and kinetochores (Rogers et al., 2004) and so are properly positioned to perform an analogous function to the yeast Dam1–DASH complex. Thus, an interesting possibility is that kinesin-13s in higher eukaryotes have the dual mitotic function of controlling microtubule depolymerization and forming a sleeve at microtubule ends. Further studies will be required to test these possibilities.
Materials and methods
Protein expression and purification
The KLP10A MD + neck construct contained residues T198–I615 of the KLP10A amino acid sequence fused with a His6 tag at the N-terminal end in the pRSET B vector. The KLP10A MD-only construct contained residues 279–615 fused with a His6 tag at the N-terminal end in the pRSET B vector. The KLP59C MD + neck construct encoded residues V113–T539 of the KLP59C amino acid sequence fused with a GST tag at the N-terminal end. The recombinant plasmids were transformed into BL21 (DE3) host cells (Stratagene). Cells were grown to O.D. 1 (O.D. 0.6 for GST-KLP59C construct), and protein expression was induced by addition of 0.1 mM IPTG overnight at 20°C. The MCAK MD + neck construct consisted of residues 182–583 fused with a His6 tag at the C-terminal end in the pET30 vector.
To purify His6-tagged proteins, lysates from construct-expressing bacteria were clarified by centrifugation and the supernatant was applied to Ni-NTA agarose resin (QIAGEN). Further purification was performed on a HiPrep 16/60 Sephacryl S-200 size exclusion column (GE Healthcare). GST-KLP59C was purified using glutathione–Sepharose 4 Fast Flow (GE Healthcare), and the GST tag was cleaved by Presicion Protease (GE Healthcare). Pure proteins fractions were concentrated, aliquoted, and flash frozen.
Immunogold labeling
The KLP10A MD + neck constructs were incubated with microtubules in the presence of AMPPNP on carbon-coated electron microscope grids and then incubated with either of two primary and secondary gold labeled antibody pairs: (1) a polyclonal rabbit antibody raised against the KLP10A N-terminal sequence (M1-A229) and 5 nm colloidal gold–labeled anti-rabbit IgG (GE Healthcare) or (2) a mouse anti-His6 antibody (GE Healthcare) and 5 nm colloidal gold–labeled anti-mouse IgG (GE Healthcare). The grids were then negatively stained with 1% uranyl acetate and imaged in the electron microscope.
Microtubule polymerization
Microtubules were polymerized from purified tubulin from bovine brain (Cytoskeleton) according to standard protocols. Taxol-stabilized microtubules were prepared as in Desai and Walczak (2001). To increase the frequency of microtubules with 15 protofilaments, suitable for helical 3D reconstruction, some microtubules were polymerized in the presence of DMSO according to Sosa et al. (1997). GMPCPP-stabilized microtubules were prepared by incubating tubulin at 37°C for 30 min in BRB80 buffer (80 mM Pipes, pH 6.8, 2 mM MgCl2, and 1 mM EGTA) supplemented with 2.5 mM GTP to form microtubules. Microtubules were then pelleted at 239,000 g for 15 min at 28°C, resuspended in cold BRB80 buffer, and allowed to depolymerize on ice for 20 min. The solution was centrifuged at 239,000 g at 4°C for 5 min to remove insoluble aggregates, and GMPCPP (Jena Bioscience) was added to 4 mM final concentration. After a 20-min incubation on ice, GMPCPP-tubulin was diluted to 4–5 mg/ml in BRB80 buffer and incubated at 37°C for 2 h. The resulting GMPCPP-stabilized microtubules were then spun down, and the pellet was resuspended in BRB80 buffer + 2 mM GMPCPP.
Electron microscopy
The different kinesin-13 constructs were incubated with microtubules (∼3 μM tubulin and 1:1 to 1:2 molar ratio kinesin MD/tubulin) in BRB80 buffer and one of the following according to the experimental nucleotide condition: (1) AMPPNP: 1 mM AMPPNP (Sigma-Aldrich); (2) ATP-γ-S: 1 mM ATP-γ-S (Qbiogene); (3) ATP: 1 mM ATP; (4) no nucleotide: no nucleotides added; (5) ADP: 1 mM ADP (Sigma-Aldrich); or (6) ADP + AlF4 −: 4 mM ADP, 2 mM AlCl3, and 10 mM KF. Incubation was performed at room temperature for 20 min followed by ultracentrifugation (217,000 g, 15 min, 30°C). The pellets were resuspended in BRB80 (+ 20 μM taxol and nucleotide according to the experiment) at room temperature and loaded on freshly glow-discharged 400-mesh carbon-coated grids for negative staining. In some cases, microtubules and kinesins were mixed and incubated directly on the grids. Rings on microtubules were observed with both methods of grid preparation. All experiments using GMPCPP-stabilized microtubules were performed by mixing kinesin and microtubules directly on the grid.
For the experiments with unpolymerized tubulin, equivalent molar amounts of unpolymerized tubulin dimers (purified tubulin kept cold in BRB80 buffer + 1 mM GTP) and KLP10A MD-only proteins were mixed in BRB80 supplemented with 3 mM MgCl2, 2 mM AMPPNP, and 1 mM GTP on ice. After a 1-min incubation on ice, the mixture was absorbed on the glow-discharged carbon-coated grid. Different amounts (3, 5, 10, and 20 μM) of tubulin and KLP10A motor proteins were tested. Rings were observed in all cases. Microtubules were not observed in any case. Rings were also observed when the KLP10A MD + neck construct was used.
The grids with the samples were negatively stained with 1% uranyl acetate. The stained grids were observed in a Tecnai 20 microscope operating at 120 kV with a nominal magnification of 50,000×. Electron micrographs were recorded with a charge-coupled device camera (F224HD; TVIPS) with a pixel size of 0.274 nm/pixel.
Image analysis
A 3D reconstruction was calculated using the standard Fourier-Bessel algorithm (DeRosier and Moore, 1970; Carragher et al., 1996). The software packages Suprim (Schroeter and Bretaudiere, 1996) and NIH ImageJ (http://rsb.info.nih.gov/ij/) were also used for preparing the images for the helical processing programs (low-pass filtering, reinterpolation, rotation, centering, and padding). Display of the calculated 3D map and manual fitting of atomic structures into the 3D map was performed using UCSF Chimera (Pettersen et al., 2004). A long and straight 15-protofilament (3 μm) microtubule with a regular spiral formed by the KLP10A MD-only construct was selected for the reconstruction. The number of protofilaments was determined by the diameter of the microtubule and typical moiré pattern caused by the projection of supertwisted protofilaments.The microtubule image was reinterpolated down to a pixel size of 0.549 nm/pixel and low-pass filtered to eliminate frequencies beyond the first CTF zero (approximately at 1/2 nm−1). Layer lines were collected (Fig. S2, available at http://www.jcb.org/cgi/content/full/jcb.200605194/DC1), and a 3D map was calculated by Fourier-Bessel inversion. The final reconstruction included ∼600 averaged asymmetric units. Clear layer lines were visible up to a resolution of 1/3.2 nm−1.
Live cell imaging
The dynamics of EGFP-KLP59C–decorated microtubules or EGFP–α-tubulin microtubules were observed in live Drosophila melanogaster Schneider S2 cells using fluorescence confocal microscopy. For the EGFP-KLP59C experiments, S2 cells were transiently transfected with the pMT/V5-HisC expression plasmid (Invitrogen) encoding EGFP fused with full-length KLP59C (Mennella et al., 2005). Stably transfected S2 cells with a plasmid encoding EGFP–α-tubulin in the pAc5.1/V5-HisB vector were used for the EGFP-tubulin experiments (Mennella et al., 2005). Time-lapse movies were acquired using an Ultraview spinning disc confocal microscope system (PerkinElmer). 1–4-μm z sections were obtained with a piezo-electric z-axis controller for 4D data collection (x, y, z, and time). Images were acquired at 1 s/frame for the EGFP–α-tubulin–expressing cells and 1.6–2 s/frame for the EGFP-KLP59C–expressing cells. In both cases, the spatial resolution was 0.129 μm/pixel.
Microtubules undergoing depolymerization at the periphery of the cells were chosen to measure their fluorescence intensity. Only microtubules that were clearly separated from other microtubules were chosen for analysis. The mean intensity in two regions (3 × 3 pixels2; 0.387 × 0.387 μm2) on each microtubule was measured using NIH ImageJ. The mean intensity of two other regions adjacent to these but outside the microtubule were also measured. These background intensities were subtracted from the intensities in the microtubule region to yield the mean intensity (minus background) on the microtubule. The microtubule position and its end were tracked manually on each video frame. For each microtubule end, we calculated the percentage change of fluorescence per depolymerization length as
 |
where Istart and Iend are the mean intensities at the first and last frame, respectively, within the analysis interval. ΔLength is the change in microtubule length between the first and last interval frame. In the case of EGFP-KLP59C–decorated microtubules (where bright puncta were often seen releasing from the microtubule as shown in Fig. 5), the image sequence was divided into intervals. The end of each interval was defined as the frame before puncta detachment. The change in fluorescence for a microtubule divided into two or more intervals was calculated as the weighted mean of all intervals (weighted by the number of frames in each interval). Data plotting and statistical tests were done using Prism4 (GraphPad Software, Inc).
Online supplemental material
Fig. S1 shows anti–kinesin-13 immunogold labeling. Fig. S2 shows the layer line dataset used to generate the 3D reconstruction. Online supplemental material is available at http://www.jcb.org/cgi/content/full/jcb.200605194/DC1.
Supplementary Material
Acknowledgments
We thank the Albert Einstein College of Medicine analytical imaging facility, F. Macaluso and L. Gunther for help with electron microscopy, and D. Buster for discussions and critical reading of the manuscript.
This project was supported by a National Institutes of Health grant (RO1-AR48620) to H. Sosa.
Abbreviations used in this paper: AMPPNP, adenosine-5′-([β,γ]-imido) triphosphate; GMPCPP, guanosine-5′-([α,β]-methyleno)triphosphate; MCAK, mitotic centromere-associated kinesin; MD, motor domain.
References
- Carragher, B., M. Whittaker, and R.A. Milligan. 1996. Helical processing using PHOELIX. J. Struct. Biol. 116:107–112. [DOI] [PubMed] [Google Scholar]
- DeRosier, D.J., and P.B. Moore. 1970. Reconstruction of three-dimensional images from electron micrographs of structures with helical symmetry. J. Mol. Biol. 52:355–369. [DOI] [PubMed] [Google Scholar]
- Desai, A., and C.E. Walczak. 2001. Assays for microtubule-destabilizing kinesins. Methods Mol. Biol. 164:109–121. [DOI] [PubMed] [Google Scholar]
- Desai, A., S. Verma, T.J. Mitchison, and C.E. Walczak. 1999. Kin I kinesins are microtubule-destabilizing enzymes. Cell. 96:69–78. [DOI] [PubMed] [Google Scholar]
- Ganem, N.J., and D.A. Compton. 2004. The KinI kinesin Kif2a is required for bipolar spindle assembly through a functional relationship with MCAK. J. Cell Biol. 166:473–478. [DOI] [PMC free article] [PubMed] [Google Scholar]
- Helenius, J., G. Brouhard, Y. Kalaidzidis, S. Diez, and J. Howard. 2006. The depolymerizing kinesin MCAK uses lattice diffusion to rapidly target microtubule ends. Nature. 441:115–119. [DOI] [PubMed] [Google Scholar]
- Hoenger, A., E.P. Sablin, R.D. Vale, R.J. Fletterick, and R.A. Milligan. 1995. Three-dimensional structure of a tubulin-motor-protein complex. Nature. 376:271–274. [DOI] [PubMed] [Google Scholar]
- Hunter, A.W., M. Caplow, D.L. Coy, W.O. Hancock, S. Diez, L. Wordeman, and J. Howard. 2003. The kinesin-related protein MCAK is a microtubule depolymerase that forms an ATP-hydrolyzing complex at microtubule ends. Mol. Cell. 11:445–457. [DOI] [PMC free article] [PubMed] [Google Scholar]
- Kikkawa, M., E.P. Sablin, Y. Okada, H. Yajima, R.J. Fletterick, and N. Hirokawa. 2001. Switch-based mechanism of kinesin motors. Nature. 411:439–445. [DOI] [PubMed] [Google Scholar]
- Mandelkow, E., and A. Hoenger. 1999. Structures of kinesin and kinesin-microtubule interactions. Curr. Opin. Cell Biol. 11:34–44. [DOI] [PubMed] [Google Scholar]
- Maney, T., M. Wagenbach, and L. Wordeman. 2001. Molecular dissection of the microtubule depolymerizing activity of mitotic centromere-associated kinesin. J. Biol. Chem. 276:34753–34758. [DOI] [PubMed] [Google Scholar]
- Marx, A., J. Muller, E.M. Mandelkow, A. Hoenger, and E. Mandelkow. 2006. Interaction of kinesin motors, microtubules, and MAPs. J. Muscle Res. Cell Motil. 27:125–137. [DOI] [PubMed] [Google Scholar]
- Mennella, V., G.C. Rogers, S.L. Rogers, D.W. Buster, R.D. Vale, and D.J. Sharp. 2005. Functionally distinct kinesin-13 family members cooperate to regulate microtubule dynamics during interphase. Nat. Cell Biol. 7:235–245. [DOI] [PubMed] [Google Scholar]
- Miranda, J.J., P. De Wulf, P.K. Sorger, and S.C. Harrison. 2005. The yeast DASH complex forms closed rings on microtubules. Nat. Struct. Mol. Biol. 12:138–143. [DOI] [PubMed] [Google Scholar]
- Moores, C.A., M. Yu, J. Guo, C. Beraud, R. Sakowicz, and R.A. Milligan. 2002. A mechanism for microtubule depolymerization by KinI kinesins. Mol. Cell. 9:903–909. [DOI] [PubMed] [Google Scholar]
- Moores, C.A., M. Hekmat-Nejad, R. Sakowicz, and R.A. Milligan. 2003. Regulation of KinI kinesin ATPase activity by binding to the microtubule lattice. J. Cell Biol. 163:963–971. [DOI] [PMC free article] [PubMed] [Google Scholar]
- Pettersen, E.F., T.D. Goddard, C.C. Huang, G.S. Couch, D.M. Greenblatt, E.C. Meng, and T.E. Ferrin. 2004. UCSF Chimera—a visualization system for exploratory research and analysis. J. Comput. Chem. 25:1605–1612. [DOI] [PubMed] [Google Scholar]
- Rogers, G.C., S.L. Rogers, T.A. Schwimmer, S.C. Ems-McClung, C.E. Walczak, R.D. Vale, J.M. Scholey, and D.J. Sharp. 2004. Two mitotic kinesins cooperate to drive sister chromatid separation during anaphase. Nature. 427:364–370. [DOI] [PubMed] [Google Scholar]
- Salmon, E.D. 2005. Microtubules: a ring for the depolymerization motor. Curr. Biol. 15:R299–R302. [DOI] [PubMed] [Google Scholar]
- Schroeter, J.P., and J.P. Bretaudiere. 1996. SUPRIM: easily modified image processing software. J. Struct. Biol. 116:131–137. [DOI] [PubMed] [Google Scholar]
- Sosa, H., and R.A. Milligan. 1996. Three-dimensional structure of ncd-decorated microtubules obtained by a back-projection method. J. Mol. Biol. 260:743–755. [DOI] [PubMed] [Google Scholar]
- Sosa, H., D.P. Dias, A. Hoenger, M. Whittaker, E. Wilson-Kubalek, E. Sablin, R.J. Fletterick, R.D. Vale, and R.A. Milligan. 1997. A model for the microtubule-Ncd motor protein complex obtained by cryo-electron microscopy and image analysis. Cell. 90:217–224. [DOI] [PubMed] [Google Scholar]
- Vale, R.D., and R.J. Fletterick. 1997. The design plan of kinesin motors. Annu. Rev. Cell Dev. Biol. 13:745–777. [DOI] [PubMed] [Google Scholar]
- Westermann, S., A. Avila-Sakar, H.W. Wang, H. Niederstrasser, J. Wong, D.G. Drubin, E. Nogales, and G. Barnes. 2005. Formation of a dynamic kinetochore-microtubule interface through assembly of the Dam1 ring complex. Mol. Cell. 17:277–290. [DOI] [PubMed] [Google Scholar]
- Westermann, S., H.W. Wang, A. Avila-Sakar, D.G. Drubin, E. Nogales, and G. Barnes. 2006. The Dam1 kinetochore ring complex moves processively on depolymerizing microtubule ends. Nature. 440:565–569. [DOI] [PubMed] [Google Scholar]
- Wordeman, L., and T.J. Mitchison. 1995. Identification and partial characterization of mitotic centromere-associated kinesin, a kinesin-related protein that associates with centromeres during mitosis. J. Cell Biol. 128:95–104. [DOI] [PMC free article] [PubMed] [Google Scholar]
Associated Data
This section collects any data citations, data availability statements, or supplementary materials included in this article.