

Abstract
Achieving long-term adherence to a dietary pattern is a challenge in many studies investigating the relationship between diet and disease. The Women’s Healthy Eating and Living Study was a multi-institutional randomized trial in 3088 women at risk for breast cancer recurrence. At baseline, the average participant followed a healthy dietary pattern of 7 vegetable and fruit servings, 21 g/d of fiber, and 28.7% energy from fat, although fat intake increased over the enrollment period. Using primarily telephone counseling, the intervention group was encouraged to substantially increase intakes of vegetables, fruits, and fiber while decreasing fat intake. Sets of 24-h dietary recalls were completed on 90% of eligible participants at 1 y and 86% at 4 y. Using a conservative imputation analysis, at 1 y, the intervention group consumed 38% more vegetable servings (100% when including juice) than the comparison group, 20% more fruit, 38% more fiber, 50% more legumes, and 30% more whole grain foods, with a 20% lower intake of energy from fat. At 4 y, the between-group differences were 65% for vegetables (including juice), 25% fruit, 30% fiber, 40% legumes, 30% whole grain foods, and 13% lower intake of energy from fat. The intervention effect on fat intake was similar for early vs. late enrollees. Plasma carotenoid concentrations on a random 28% sample validated self-reported vegetable and fruit intake, with a between-group difference of 66% at 1 y and over 40% at 4 y. This large change will allow testing of hypotheses on the role of dietary change in preventing additional breast cancer events.
Introduction
The influence of diet on breast cancer progression and survival remains controversial despite being the focus of at least 15 epidemiological studies (1–3). In the opinion of many, the most direct test of the association between dietary pattern and breast cancer recurrence and survival is a randomized trial in which one group changes their dietary pattern and sustains these changes over time, while the other group continues its original eating pattern. Until recently, few well-designed and implemented trials had been published that could test the influence of dietary pattern on disease (4).
This report describes the dietary change achieved and maintained over 4 y in the Women’s Healthy Eating and Living (WHEL) Study, which used an intensive one-on-one intervention delivered over the telephone, complemented by cooking classes and newsletters. In addition to allowing flexible scheduling tailored to individual participants, telephone counseling, with centralized intervention, provided economy of scale (5). At 1 y, we observed substantial medium-term increased intake of vegetables, fruit, and fiber with concurrent reductions in energy intake from fat (6). Because the WHEL Study is testing the hypothesis that dietary pattern will influence breast cancer disease-free survival, the protocol required study participants to maintain the new dietary pattern for a minimum of 4 y (5). This analysis presents the evidence that the WHEL Study intervention resulted in a significant between-group difference in dietary pattern through 4 y. The analysis also considers secular trends in dietary pattern among entry cohorts that may have influenced the absolute levels of dietary intakes achieved and maintained over time.
Subjects and Methods
Study population
The WHEL Study enrolled 3088 women from 7 institutions in the south and west regions of the United States within 4 y of breast cancer diagnosis who were aged 18–70 y at diagnosis. The institutional review boards at the 7 clinical sites approved the study protocol and consent forms, and all participants provided written informed consent. Women were randomly assigned either to an intervention group counseled to consume a nutrient-dense, plant-based dietary pattern or to a comparison group that was given nationally recommended dietary guidelines for healthy living (7). Details of the study design and the close comparability of study groups on major socio-demographic and cancer characteristics, including stage, have been reported (5). The mean age at baseline was 52 y, mean BMI was 27.3 kg/m2, over 50% of subjects had attended college, and 14% were from minority subpopulations (African American, Hispanic/Latina, and Asian). The study population eligible for dietary assessment (i.e. those without a study endpoint) at 1 y and 4 y was 2953 and 2719, respectively. Because a significant secular trend for increased energy intake from fat was observed over the 6 y of enrollment from 1995–2000, we divided the participants into 9 consecutive study cohorts, based on their date of study enrollment, for specific analyses to examine these trends in detail.
Intervention and comparison group activities
Intervention group
The WHEL Study protocol has previously been described in detail (5). Briefly, trained counselors delivered a computer-assisted intervention over the telephone, complemented by cooking classes and newsletters. The counseling followed a step-wise, phased approach using strategies adapted from social cognitive theory. In the first phase, usually completed within the first 6 wk, calls every 3–4 d helped the participant build self-efficacy to implement these dietary targets: a daily intake of 5 vegetable servings, 2 cups (473 mL) of 100% vegetable juice (to increase vegetable nutrients without excessive fiber) or vegetable serving equivalents, 3 fruit servings, 30 g of fiber, and 15–20% energy from fat). To maximize intake of protective compounds, participants did not count white potatoes, iceberg lettuce, or fruit juice toward their dietary targets. During phase 2, 6–8 counseling calls at approximately weekly intervals focused on self-monitoring, modifying the environment to support the new dietary pattern, and planning relapse prevention strategies. Phase 3, progressively less intensive through the remainder of the study, focused on maintaining motivation for the dietary pattern and preventing relapse. This phased approach provided assistance when participants needed it the most (8). The mean number of counseling calls per participant was 18 calls in y 1; 6 calls in y 2; 4 calls in y 3; and 3 calls during y 4, for a total of 31 calls over 4 y.
Dietary behavior change was further reinforced by monthly newsletters and cooking classes. Twelve cooking classes with different educational themes were offered in a participant’s first year and these classes were repeated yearly until all participants had completed their first year of the study. These classes provided participants with the opportunity to prepare and taste new recipes that met intervention goals (9). Intervention participants attended a mean of 4 cooking classes during the first year and another 1.5 cooking classes over the next 3 y of study participation. Monthly newsletters complemented the cooking classes and counseling calls for the duration of the intervention; 1 bimonthly newsletter highlighted a food relevant to the dietary pattern and during alternate months, ‘‘WHEL News’’ (tailored to the intervention group) featured a synopsis of relevant scientific literature, recommendations on dining out, supermarket strategies, participant questions and answers, and recipes.
Comparison group
Women randomized to the comparison group were provided with print materials available from the USDA (7) and the National Cancer Institute (10). Cooking classes and newsletters were among the strategies used to promote cohort maintenance. We offered 4 cooking classes each year based on themes unrelated to vegetables, fruit, fiber, and fat (e.g. dietary calcium). On average, comparison group participants attended 1 cooking class in the first year of the study. Participants received the bimonthly ‘‘WHEL News’’ (tailored to the comparison group) that contained study updates, research updates, recipes, and other articles to maintain interest and motivation in the study.
Dietary assessment
The study assessed dietary intake with a multi-method and multi-mode approach that included sets of 24-h dietary recalls (24-HR) as the primary measure and dietary biomarkers (plasma carotenoids) on a 28% random sample identified at baseline (5). 24-HR were collected on the entire study sample at baseline, 1 y, and 4 y. Trained assessors conducted the 24-HR via scheduled telephone calls for 4 selected days (stratified for weekday/weekend day) within 3-wk windows. The Minnesota Nutritional Data System software was used to collect dietary data (NDS-R, 1994–2006, University of Minnesota, Minneapolis) and analyze nutrient intakes (NDS-R version 6.0, 2006). At the baseline clinic visit, a registered dietitian taught participants to assess portion sizes with food models and measuring cups and spoons, paying particular attention to portions of vegetables, fruit, whole grain foods, and legumes. Participants received documentation outlining serving information and dietary assessors reminded them of these when necessary. Using the NDS database, we calculated serving sizes using metric weight. We defined a vegetable serving as one-half cup of cut-up vegetables (90 g), 1 cup of raw leafy green vegetables (55 g); a fruit serving as one-fourth cup of dried fruit (60 g), one-half cup of cut-up fruit (120 g), 1 cup melon (165 g), or 1 medium piece of fruit (120 g); a legume serving as one-half cup cooked legumes (90 g); and a whole grain serving as 1 slice of whole grain bread (50 g) or one-half cup of cooked whole grain cereal (120 g) or the equivalent. Vegetable and fruit juice were reported in 4-oz (120 g) servings of 100% vegetable or 100% fruit juice.
Plasma carotenoid and cholesterol concentration assessment
During clinic visits at baseline, 1 y, and 4 y, participants provided a fasting blood sample, which was separated and stored at −80°C. We quantified plasma carotenoid concentrations using HPLC with a Varian Star 9010, 9050 system as previously described (11). The laboratory participates in the National Institute of Standards and Technology quality assurance program to monitor precision and reliability of carotenoid measurement and the mean day-to-day CV was <6%. As carotenoids are transported in the plasma nonspecifically by cholesterol-rich lipoproteins, cholesterol concentrations can modify the relationship between dietary intake of carotenoids and their plasma concentration and need to be controlled in the analysis. Total plasma cholesterol concentrations were measured with the Kodak Ektachem Analyzer system (Johnson & Johnson Clinical Diagnostics) (12). Standard reference material from the manufacturer was used to validate analytic precision.
Statistical analysis
Means and SEM were computed for all variables of interest, including demographic, clinical, diet, and plasma carotenoid concentrations. Longitudinal data analysis (13) was applied to examine within subject dietary patterns over time. A linear regression model examined the secular trend in fat intakes by WHEL Study entry cohort. To assess between-group differences in dietary intakes, we subtracted the comparison group intake from the intervention group intake and divided this difference by the comparison group intake. We expressed this difference as a percent.
Conservative multiple imputation method
We provide a best estimate of dietary intake for missing data using multiple imputation, which assumes that eligible intervention group women without dietary data after baseline (n = 127) changed their dietary intakes in a manner similar to that of the comparison group. For eligible participants who did provide data after baseline but who did not complete at least 3 24-HR at 1 y or 4 y, we used the expectation maximization algorithm in SAS version 9.1 to estimate dietary intake for the missing data point. Due to linear dependence between some of the dietary variables and resultant singularity in the expectation maximization covariance matrix, we used a 2-step procedure to first impute general categories (vegetables, fruit, fiber, and percent energy from fat) and then subcategories (types of vegetables, fruits, fiber, or fat). Multiple imputations were performed by study group, except for the intervention group women without dietary data after baseline, as indicated above.
Modeling dietary trends over time
Separate mixed models (13) were fit for each targeted dietary variable using repeated measures for each participant’s dietary intake at baseline, 1 y, and 4 y. Study group, time, and group × time interactions were included as fixed effect covariates. Because this method is capable of handling varying amounts of data missing-at-random, only reported dietary intakes were used in the mixed models. The significance level in the mixed models for group × time interaction was set conservatively at P < 0.01 and α for change within the comparison group was set at P < 0.05. A similar approach was used in a mixed model for plasma carotenoid data.
Secular trend on entry cohorts
To estimate secular trends in dietary fat intake, baseline percent energy intake from fat is reported for distinct participant entry cohorts. Participants randomized during 1995–1996 were combined into the first cohort. Eight additional cohorts were composed of participants randomized in each one-half year between 1997 and 2000. A secular trend was determined to exist if a significant slope of the regression line was observed over time (P < 0.01).
Results
Dietary intakes at baseline, 1 y, and 4 y
At baseline, 90% of participants provided 24-HR on 4 d and 10% provided 24-HR on 3 d. At both 1 y and 4 y, 76% of eligible participants (those alive without a recurrence or new breast cancer) completed 4 24-HR. The response rate was 90% at 1 y and 86% at 4y and was slightly lower in the intervention group. In eligible participants, 229 women (7.8%) provided no dietary data after baseline. Baseline fat intake did not differ between these nonresponders compared with responders. However, at entry, nonresponders had lower fiber intake (19.0 ± 0.50 vs. 21.5 ± 0.17 g/d; P < 0.01) and lower fruit and vegetable intake (6.5 ± 0.21 serving/d vs. 7.5 ± 0.06 servings/d; P < 0.01) than responders. To account for this nonresponse, we assumed that nonresponders changed their dietary pattern in a similar manner to the comparison group, a conservative imputed data approach for missing data (Table 1). All differences noted below were significant at P < 0.01 in the relevant statistical model unless otherwise specified.
TABLE 1.
Serving and nutrient intake in WHEL Study comparison and intervention groups at baseline, 1 y, and 4 y1
| Comparison group
|
Intervention group (conservative imputation method)
|
|||||
|---|---|---|---|---|---|---|
| Baseline | y 1 | y 4 | Baseline | y 1 | y 4 | |
| n | 1547 | 1486 | 1364 | 1535 | 1467 | 1355 |
| Energy,2 kcal/d | 1716.58 ± 10.54 | 1598.98 ± 10.452 | 1717.90 ± 11.212 | 1718.94 ± 10.23 | 1604.38 ± 9.12 | 1714.01 ± 10.84 |
| Vegetable, servings/d | ||||||
| Green vegetable | 0.36 ± 0.01 | 0.45 ± 0.01* | 0.58 ± 0.02* | 0.38 ± 0.01 | 0.67 ± 0.08† | 0.77 ± 0.02† |
| Orange vegetable | 0.40 ± 0.01 | 0.41 ± 0.01* | 0.34 ± 0.01* | 0.40 ± 0.01 | 0.73 ± 0.02† | 0.55 ± 0.02† |
| Tomato | 0.54 ± 0.01 | 0.60 ± 0.01 | 0.58 ± 0.01 | 0.56 ± 0.01 | 0.78 ± 0.02† | 0.74 ± 0.02† |
| Allium | 0.19 ± 0.004 | 0.19 ± 0.00* | 0.15 ± 0.005* | 0.19 ± 0.005 | 0.24 ± 0.01 | 0.19 ± 0.01† |
| Cruciferous vegetable | 0.45 ± 0.01 | 0.42 ± 0.01* | 0.36 ± 0.01* | 0.46 ± 0.02 | 0.70 ± 0.02† | 0.54 ± 0.02† |
| Iceberg lettuce | 0.25 ± 0.01 | 0.22 ± 0.01* | 0.19 ± 0.01* | 0.26 ± 0.01 | 0.11 ± 0.01† | 0.13 ± 0.01† |
| White potato | 0.56 ± 0.01 | 0.52 ± 0.01* | 0.46 ± 0.01* | 0.57 ± 0.02 | 0.36 ± 0.01† | 0.38 ± 0.01† |
| Other vegetable | 0.91 ± 0.02 | 0.90 ± 0.02 | 0.87 ± 0.02 | 0.92 ± 0.02 | 1.50 ± 0.03† | 1.26 ± 0.03† |
| Vegetable juice | 0.15 ± 0.02 | 0.13 ± 0.01 | 0.10 ± 0.01 | 0.14 ± 0.01 | 2.63 ± 0.05† | 1.47 ± 0.04† |
| Total vegetable | 3.82 ± 0.05 | 3.86 ± 0.05 | 3.66 ± 0.05 | 3.88 ± 0.05 | 7.79 ± 0.08† | 6.04 ± 0.08† |
| Fruit, servings/d | ||||||
| Citrus | 0.32 ± 0.01 | 0.30 ± 0.02 | 0.27 ± 0.01 | 0.33 ± 0.02 | 0.44 ± 0.02† | 0.38 ± 0.02† |
| Melon | 0.20 ± 0.01 | 0.17 ± 0.01* | 0.11 ± 0.01* | 0.23 ± 0.01 | 0.22 ± 0.01† | 0.17 ± 0.01 |
| Berry | 0.24 ± 0.01 | 0.23 ± 0.01 | 0.25 ± 0.01 | 0.22 ± 0.01 | 0.35 ± 0.01† | 0.37 ± 0.02† |
| High carotenoid fruit | 0.25 ± 0.01 | 0.22 ± 0.01 | 0.18 ± 0.01* | 0.27 ± 0.02 | 0.30 ± 0.01† | 0.26 ± 0.01 |
| Other fruit | 1.55 ± 0.03 | 1.55 ± 0.03 | 1.32 ± 0.03* | 1.53 ± 0.03 | 2.17 ± 0.04† | 1.73 ± 0.04† |
| Citrus juice | 0.15 ± 0.01 | 0.14 ± 0.01 | 0.05 ± 0.005* | 0.15 ± 0.01 | 0.09 ± 0.09† | 0.05 ± 0.004 |
| Other fruit juice | 0.72 ± 0.02 | 0.74 ± 0.02 | 0.57 ± 0.02* | 0.72 ± 0.02 | 0.54 ± 0.02† | 0.52 ± 0.02 |
| Total fruit | 3.43 ± 0.05 | 3.40 ± 0.05 | 2.80 ± 0.05* | 3.46 ± 0.05 | 4.10 ± 0.05† | 3.49 ± 0.05† |
| Total veg + fruit, servings/d | 7.25 ± 0.08 | 7.26 ± 0.10 | 6.39 ± 0.05 | 7.34 ± 0.08 | 11.94 ± 0.12† | 9.53 ± 0.12† |
| Total veg + fruit, servings/(1000 kcal/d) 2 | 4.22 ± 0.05 | 4.52 ± 0.05 | 3.72 ± 0.05 | 4.27 ± 0.05 | 7.37 ± 0.08† | 5.56 ± 0.08† |
| Legume, servings/d | 0.21 ± 0.01 | 0.23 ± 0.01 | 0.20 ± 0.01 | 0.22 ± 0.01 | 0.35 ± 0.01† | 0.28 ± 0.01† |
| Whole grain, servings/d | 0.99 ± 0.02 | 1.03 ± 0.02 | 0.92 ± 0.02* | 1.01 ± 0.02 | 1.37 ± 0.02† | 1.20 ± 0.02† |
| Carbohydrate, g/d | 236.16 ± 1.59 | 220.75 ± 1.61* | 199.43 ± 1.57* | 236.57 ± 1.60 | 251.59 ± 1.75† | 218.30 ± 1.71† |
| Fiber, g/d | 21.15 ± 0.20 | 21.19 ± 0.22 | 19.44 ± 0.19* | 21.09 ± 0.21 | 29.14 ± 0.26† | 25.35 ± 0.25† |
| Soluble fiber | 7.07 ± 0.07 | 6.94 ± 0.07 | 6.32 ± 0.06* | 7.05 ± 0.07 | 9.16 ± 3.08† | 7.78 ± 0.08† |
| Insoluble fiber | 13.89 ± 0.14 | 13.87 ± 0.15 | 12.63 ± 0.14* | 13.86 ± 0.15 | 19.31 ± 7.06† | 16.36 ± 0.18† |
| Fat, % energy | 28.66 ± 0.18 | 28.32 ± 0.18 | 31.28 ± 0.20* | 28.53 ± 0.18 | 22.63 ± 0.19† | 27.09 ± 0.21† |
| Saturated fat | 9.13 ± 0.08 | 8.90 ± 0.07* | 9.98 ± 0.08* | 9.06 ± 0.08 | 6.83 ± 2.71† | 8.39 ± 0.08† |
| Polyunsaturated fat | 6.40 ± 0.05 | 6.30 ± 0.05 | 6.71 ± 0.06 | 6.30 ± 0.05 | 5.30 ± 0.05 | 6.09 ± 0.06† |
| Monounsaturated fat | 10.80 ± 0.08 | 10.80 ± 0.09 | 12.11 ± 0.10* | 10.70 ± 0.08 | 8.50 ± 0.09† | 10.41 ± 0.11† |
| (n-3) fatty acids, g/d | 1.58 ± 0.02 | 1.49 ± 0.02* | 1.60 ± 0.02 | 1.59 ± 0.02 | 1.31 ± 0.78† | 1.49 ± 0.02 |
Values are means ± SEM.
Different from baseline in comparison group, P < 0.05, mixed models.
1 kcal = 4.18 kJ.
A between-group difference was tested at each time point. Significant group by time interaction is present at this time point, P < 0.01, mixed models.
Vegetable intake
At baseline, the comparison group consumed 3.8 servings per d of vegetables and consumption remained relatively unchanged at 1 y and 4 y. The intervention group had a similar consumption at baseline, but they significantly increased their intake to 7.8 servings/d at 1 y, for a between-group difference of 100%; at 4 y, the between-group difference was 65%. From vegetables alone (excluding juice), the increase was 38% at 1 y and 22% at 4 y. At baseline, 4% of total vegetable consumption came from juice. This increased to 33% at 1 y and declined to 24% at 4 y. At 1 y, 49% of juice consumed by the intervention group was tomato based and 44% was carrot based; at 4 y, 52% was tomato based and 42% was carrot based.
Fruit intake
At baseline, both groups consumed 3.4 servings per d of fruit for a combined total of 7.3 servings/d of vegetables and fruit. In the comparison group, 1-y fruit intake was similar to baseline and 4-y intake was slightly lower (P < 0.05). The between-group difference in fruit intake at 1 y was 20% and 25% at 4 y. Thus, for the intervention group, total vegetable and fruit intake was 12 servings/d at 1 y and 9.5 servings/d at 4 y. At baseline, both groups consumed just < 1 serving/d (103.4 mL) of fruit juice, 17% of which came from citrus fruit. The intervention group decreased their fruit juice consumption throughout the study. Between 1 y and 4 y, the comparison group also decreased their fruit juice consumption so that there was no longer a between-group difference at 4 y.
Dietary fiber
Study groups consumed a mean of 21 g/d of dietary fiber at baseline (approximately two-thirds insoluble fiber). Dietary fiber intake was unchanged at 1 y in the comparison group and declined slightly (P < 0.05) at 4 y, although the proportion of insoluble fiber intake did not change. Dietary fiber intake increased in the intervention group, resulting in between-group differences of 38% at 1 y and 30% at 4 y,with no difference in proportions of total fiber that was insoluble.
Energy intake from fat
At baseline, both groups had similar percentages of energy intake from fat (~28.5%), with the mean energy from saturated fat below 10%. The comparison group maintained this intake at 1 y but increased intake to 31.3% by 4 y (P < 0.05). The between-group difference was −20% at 1 y and −13% at 4 y, with little difference in the proportion of subcategories of fat intake.
Secular trends in fat intake at baseline
The 1995–1996 entry cohort (Fig. 1) consumed ~27% energy intake from fat at baseline. There was a positive trend of 0.8% per year across entry cohorts (P < 0.0001) so the last entry cohort (2nd half of 2000) reported consuming > 30% of energy intake from fat. The secular trend for an increase in fat intake in entry cohorts may explain the significant increase in this variable in the comparison group at 4 y (Table 1). Figure 2 compares fat intake between study groups after stratifying the sample into halves by study enrollment date. In both these higher and lower fat intake groups, a similar intervention effect was observed with between-group differences of 3–5% in fat intake across all follow-up time points.
FIGURE 1.
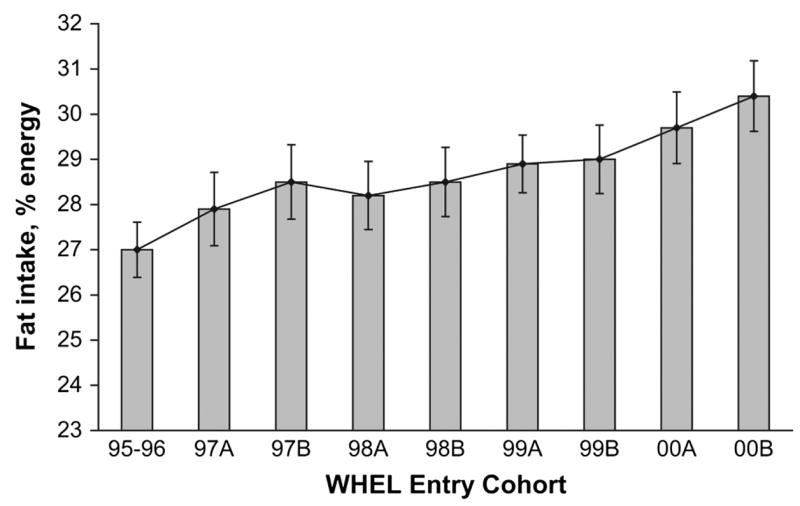
Baseline percent energy from fat reported by WHEL Study enrollees between 1995 and 2000. Graph shows mean (95% CI) for percent energy from fat by intake group. Intake groups designated ‘‘A’’ were enrolled in the first 6 mo of the year. Intake groups designated ‘‘B’’ were enrolled in the last 6 mo of the year. The sample sizes ranged from 248 to 532 for the 9 entry cohorts. When 95% CI for percent energy from fat did not overlap, values were significantly different.
FIGURE 2.
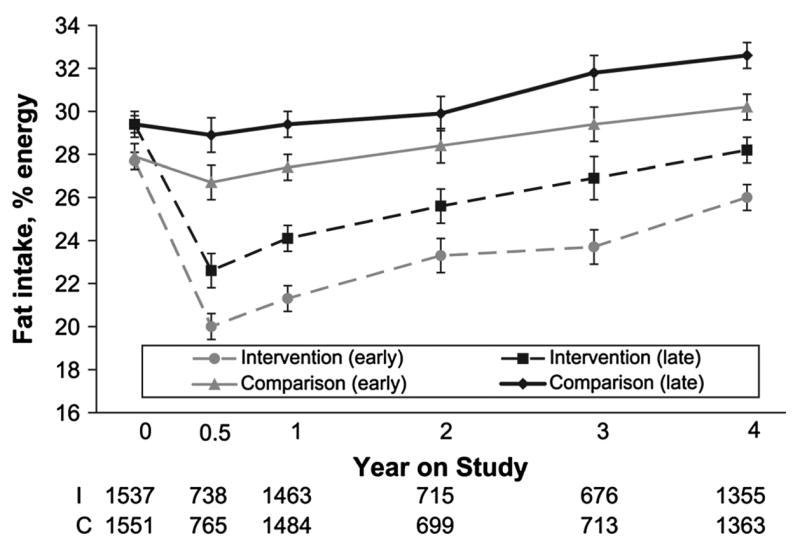
Baseline percent energy from fat reported by early-compared with late-enrolled participants in the WHEL Study by intervention and comparison group. Graph shows mean (95% CI) energy from fat at baseline, 6 mo, and 1, 2, 3, and 4 y. Data designated ‘‘Intervention (early)’’ and ‘‘Comparison (early)’’ is from participants enrolled in WHEL before 10/17/1998. Data designated ‘‘Intervention (late)’’ and ‘‘Comparison (late)’’ is from participants enrolled in WHEL after 10/17/1998. When 95% CI for percent energy from fat did not overlap, values were significantly different. Primary comparisons of fat intake over time were between comparison and intervention groups.
Validation of vegetable-fruit Increase with plasma carotenoid biomarker
Both groups had similar plasma carotenoid concentrations (~2.4 μmol/L) at baseline (Table 2). Plasma carotenoid concentrations in the comparison group were relatively unchanged at 1 y and 4 y. The between-group difference was 66% at 1 y and 42% at 4 y.
TABLE 2.
Total plasma carotenoid concentration in WHEL Study intervention and comparison women at baseline, 1 y, and 4 y1
| n | Intervention | n | Comparison | P | |
|---|---|---|---|---|---|
| μmol/L | μmol/L | ||||
| Baseline | 418 | 2.40 ± 0.07 | 458 | 2.47 ± 0.08 | 0.48 |
| Y 1 | 378 | 3.99 ± 0.13 | 425 | 2.40 ± 0.07 | < 0.0001 |
| Y 4 | 303 | 3.33 ± 0.13 | 367 | 2.34 ± 0.07 | < 0.0001 |
Values are means ± SEM. Total plasma carotenoid concentration is the sum of α and β carotene, β-cryptoxanthin, lutein/zeaxanthin, and lycopene.
Discussion
The WHEL Study enrolled over 3000 women who were, on average, consuming more than the recommended ‘‘5-a-day’’ for vegetables and fruit and less than the recommended 30% energy from fat (14). This population was closer to the recommended dietary pattern than other populations of breast cancer survivors (15,16) or the general population of women in the US (14). In diet intervention studies, it is expected that dietary intake will be substantially changed at 1 y, whereas long-term adherence is recognized as a more daunting challenge. At 1 y, we achieved between-group differences of 38% for vegetables (excluding juice), 38% for fiber, 20% for fruit, and −20% for percent energy from fat. Vegetable juice was used to boost vegetable nutrients without excessive fiber and led to a doubling of total vegetable intake at 1 y. We have previously reported that, in participants who did not consume vegetable juice, the increase in plasma carotenoid concentration was 75% of that observed in participants who included juice in their diets (11). At 4 y, the intervention maintained the following between-group differences in intakes: 22% for vegetables (65% for vegetables including juice), 30% for fiber, 25% for fruit, and −13% for percent energy from fat. This combination of between-group difference in dietary patterns observed at 4 y demonstrates a degree of dietary behavior change that is much greater, both in magnitude and duration, than that observed in previous large studies (17).
Initially, the decrease in dietary fat intake achieved by WHEL appears lower than that reported by the large Women’s Intervention Nutrition Study, which focused on reducing energy intake from fat to 15% (18). In a completers-only analysis, the Women’s Intervention Nutrition Study reported an 8% maintained between-group difference in absolute energy from fat. However, dietary data were reported for only 64% of the intervention group and 74% of control participants at 3 y. If even modest proportions of nonrespondents were no longer following the intervention, the between-group difference would be substantially reduced.
A significant secular trend for increased energy intake from fat was observed in study participants over the 6-y enrollment period from 1995 to 2000. The increase averaged almost 1 percentage point per year and may reflect trends in popular diets (e.g. low-carbohydrate diets) (19) or results of observational studies questioning the role of dietary fat in breast cancer (20). The study intervention had an equivalent impact on those randomized in the early and late years of the study, suggesting that the intervention approach can effectively encourage people with quite different dietary patterns to make major changes.
The main intervention strategy was telephone counseling, delivered by trained counselors using a computer-based protocol and supervised by a registered dietitian (9). This one-on-one communication mode was most intensive in the early months of the intervention and the contact schedule was modeled after previously successful face-to-face interventions (21). The counseling was complemented by cooking classes and newsletters. The cooking classes appeared to impose a substantial burden on some participants, as intervention participants attended only one-third of the available classes in the first year (9). However, these cooking classes complemented the telephone counseling intervention, because the dietary counselors used them as motivational tools and discussion points to help maintain participant interest.
Monthly newsletters highlighted the continued importance of food choices and provided recipes specific to the dietary pattern. As telephone counseling contacts decreased over time, these newsletters assumed a greater role in helping participants maintain the study dietary pattern. Other research has shown that monthly newsletters alone (22) or in conjunction with an initial interview and follow-up (23) can be a cost-effective way of achieving small increases in fruit and vegetable consumption. In this study, we think that newsletters helped prevent relapse, given that the intervention group sustained significant dietary change even when newsletters served as the primary intervention tool. Thus, we consider all 3 intervention components, delivered on a schedule aimed at meeting the participant’s need for assistance, as key to achieving and maintaining a major change in dietary pattern. Further research is needed to identify the level of behavior change that such an intervention can achieve in lower-risk populations.
This study used a multi-method, multi-mode approach to assessing dietary intakes. In addition to 24-HR data and biomarker of vegetable and fruit intake, the study used an FFQ. A subsample investigation indicated that both self-report measures captured significant differences in targeted components of the dietary pattern (24). We investigated the validity and systematic error of both self-report measures for carotenoid-rich vegetable and fruit consumption (25) and confirmed the choice of 24-HR as the primary self-report measure. Measurement error in dietary self-report is well known (26) and the lack of an adequate biomarker of other elements of the dietary pattern, such as fiber intake, is a limitation to the study. Importantly, in a subsample, the intervention was associated with significant changes in plasma lipid concentrations consistent with the self-reported changes in carbohydrate and fat intakes (27).
In summary, the WHEL Study participants generally were already following a healthy dietary pattern at baseline. An innovative, multi-component intervention achieved and maintained a major change in that dietary pattern to one with 10 vegetable and fruit servings/d, 25 g/d of fiber, and 27% energy from fat. This resulted in large between-group differences in the randomized arms of the study. This effect attests to the efficacy of an intensive telephone counseling protocol adapted from the principles of social learning theory for dietary behavior change. Of greatest importance, the level of dietary change achieved and maintained in this study is sufficient to provide a definitive test of the role of dietary pattern in additional breast cancer events.
Footnotes
Supported by the Walton Family Foundation (started study) and continued with funding from NCI grant CA 69375. Some of the data were collected from General Clinical Research Centers, NIH grants M01-RR00070, M01-RR00079, and M01-RR00827.
Author disclosures: J. P. Pierce, V. A. Newman, L. Natarajan, S. W. Flatt, W. K. Al-Delaimy, B. J. Caan, J. A. Emond, S. Faerber, E. B. Gold, R. A. Hajek, K. Hollenbach, L. A. Jones, N. Karanja, S. Kealey, L. Madlensky, J. Marshall, C. Ritenbaugh, C. L. Rock, M. L. Stefanick, C. Thomson, L. Wasserman, and B. A. Parker, no conflicts of interest.
Literature Cited
- 1.Rock CL, Flatt SW, Natarajan L, Thomson CA, Bardwell WA, Newman VA, Hollenbach KA, Jones L, Caan BJ, et al. Plasma carotenoids and recurrence-free survival in women with a history of breast cancer. J Clin Oncol. 2005;23:6631–8. doi: 10.1200/JCO.2005.19.505. [DOI] [PubMed] [Google Scholar]
- 2.Goodwin PJ, Ennis M, Pritchard KI, Koo J, Trudeau ME, Hood N. Diet and breast cancer: evidence that extremes in diet are associated with poor survival. J Clin Oncol. 2003;21:2500–7. doi: 10.1200/JCO.2003.06.121. [DOI] [PubMed] [Google Scholar]
- 3.Kroenke CH, Fung TT, Hu FB, Holmes MD. Dietary patterns and survival after breast cancer diagnosis. J Clin Oncol. 2005;23:9295–303. doi: 10.1200/JCO.2005.02.0198. [DOI] [PubMed] [Google Scholar]
- 4.Davies AA, Davey Smith G, Harbord R, Bekkering GE, Sterne JA, Beynon R, Thomas S. Nutritional interventions and outcome in patients with cancer or preinvasive lesions: systematic review. J Natl Cancer Inst. 2006;98:961–73. doi: 10.1093/jnci/djj263. [DOI] [PubMed] [Google Scholar]
- 5.Pierce JP, Faerber S, Wright FA, Rock CL, Newman V, Flatt SW, Kealey S, Jones VE, Caan BJ, et al. A randomized trial of the effect of a plant-based dietary pattern on additional breast cancer events and survival: the Women’s Healthy Eating and Living (WHEL) Study. Control Clin Trials. 2002;23:728–56. doi: 10.1016/s0197-2456(02)00241-6. [DOI] [PubMed] [Google Scholar]
- 6.Pierce JP, Newman VA, Flatt SW, Faerber S, Rock CL, Natarajan L, Caan BJ, Gold EB, Hollenbach KA, et al. Telephone counseling intervention increases intakes of micronutrient- and phytochemical-rich vegetables, fruit and fiber in breast cancer survivors. J Nutr. 2004;134:452–8. doi: 10.1093/jn/134.2.452. [DOI] [PubMed] [Google Scholar]
- 7.USDA/DHHS. Dietary guidelines for Americans. Home Health and Garden Bulletin no. 232 Washington, DC: U.S. Department of Health and Human Services; 1995. [Google Scholar]
- 8.Zhu SH, Pierce JP. A new scheduling method for time-limited counseling. Prof Psychol Res Pr. 1995;26:624–5. [Google Scholar]
- 9.Newman VA, Thomson CA, Rock CL, Flatt SW, Kealey S, Bardwell WA, Caan BJ, Pierce JP. Achieving substantial changes in eating behavior among women previously treated for breast cancer: an overview of the intervention. J Am Diet Assoc. 2005;105:382–91. doi: 10.1016/j.jada.2004.12.008. [DOI] [PubMed] [Google Scholar]
- 10.National Cancer Institute. Eat 5 fruits and vegetables a day. Washington, DC: National Cancer Institute; 1995. [Google Scholar]
- 11.Pierce JP, Natarajan L, Sun S, Al-Delaimy W, Flatt SW, Kealey S, Rock CL, Thomson CA, Newman VA, et al. Increases in plasma carotenoid concentrations in response to a major dietary change in the Women’s Healthy Eating and Living Study. Cancer Epidemiol Biomarkers Prev. 2006;15:1886–92. doi: 10.1158/1055-9965.EPI-05-0928. [DOI] [PubMed] [Google Scholar]
- 12.Shirey TL. Development of a layered-coating technology for clinical chemistry. Clin Biochem. 1983;16:147–55. doi: 10.1016/s0009-9120(83)94024-9. [DOI] [PubMed] [Google Scholar]
- 13.Diggle PJ, Liang KY, Zeger SL. Analysis of longitudinal data. Oxford: Oxford Science Publication; 1994. [Google Scholar]
- 14.USDHHS. Healthy People 2010. 2000 [cited 2006 May 17]. Available from: http://www.healthypeople.gov/Publications/
- 15.Caan B, Sternfeld B, Gunderson E, Coates A, Quesenberry C, Slattery ML. Life After Cancer Epidemiology (LACE) Study: a cohort of early stage breast cancer survivors (United States) Cancer Causes Control. 2005;16:545–56. doi: 10.1007/s10552-004-8340-3. [DOI] [PubMed] [Google Scholar]
- 16.Wayne SJ, Lopez ST, Butler LM, Baumgartner KB, Baumgartner RN, Ballard-Barbash R. Changes in dietary intake after diagnosis of breast cancer. J Am Diet Assoc. 2004;104:1561–8. doi: 10.1016/j.jada.2004.07.028. [DOI] [PubMed] [Google Scholar]
- 17.Pomerleau J, Lock K, Knai C, McKee M. Interventions designed to increase adult fruit and vegetable intake can be effective: a systematic review of the literature. J Nutr. 2005;135:2486–95. doi: 10.1093/jn/135.10.2486. [DOI] [PubMed] [Google Scholar]
- 18.Chlebowski RT, Blackburn GL, Thomson CA, Nixon DW, Shapiro A, Hoy MK, Goodman MT, Giuliano AE, Karanja N, et al. Dietary fat reduction and breast cancer outcome: interim efficacy results from the Women’s Intervention Nutrition Study. J Natl Cancer Inst. 2006;98:1767–76. doi: 10.1093/jnci/djj494. [DOI] [PubMed] [Google Scholar]
- 19.Stern L, Iqbal N, Seshadri P, Chicano KL, Daily DA, McGrory J, Williams M, Gracely EJ, Samaha FF. The effects of low-carbohydrate versus conventional weight loss diets in severely obese adults: one-year follow-up of a randomized trial. Ann Intern Med. 2004;140:778–85. doi: 10.7326/0003-4819-140-10-200405180-00007. [DOI] [PubMed] [Google Scholar]
- 20.Hunter DJ, Willett WC. Nutrition and breast cancer. Cancer Causes Control. 1996;7:56–68. doi: 10.1007/BF00115638. [DOI] [PubMed] [Google Scholar]
- 21.Chlebowski RT, Blackburn GL, Buzzard IM, Rose DP, Martino S, Khandekar JD, York RM, Jeffery RW, Elashoff RM, et al. Adherence to a dietary fat intake reduction program in postmenopausal women receiving therapy for early breast cancer. The Women’s Intervention Nutrition Study. J Clin Oncol. 1993;11:2072–80. doi: 10.1200/JCO.1993.11.11.2072. [DOI] [PubMed] [Google Scholar]
- 22.Lutz SF, Ammerman AS, Atwood JR, Campbell MK, DeVellis RF, Rosamond WD. Innovative newsletter interventions improve fruit and vegetable consumption in healthy adults. J Am Diet Assoc. 1999;99:705–9. doi: 10.1016/S0002-8223(99)00169-8. [DOI] [PubMed] [Google Scholar]
- 23.Richards A, Kattelmann KK, Ren C. Motivating 18- to 24-year-olds to increase their fruit and vegetable consumption. J Am Diet Assoc. 2006;106:1405–11. doi: 10.1016/j.jada.2006.06.005. [DOI] [PubMed] [Google Scholar]
- 24.Thomson CA, Giuliano A, Rock CL, Ritenbaugh CK, Flatt SW, Faerber S, Newman V, Caan B, Graver E, et al. Measuring dietary change in a diet intervention trial: comparing food frequency questionnaire and dietary recalls. Am J Epidemiol. 2003;157:754–62. doi: 10.1093/aje/kwg025. [DOI] [PubMed] [Google Scholar]
- 25.Natarajan L, Flatt SW, Sun X, Gamst AC, Major JM, Rock CL, Al-Delaimy W, Thomson CA, Newman VA, et al. Validity and systematic error in measuring carotenoid consumption with dietary self-report instruments. Am J Epidemiol. 2006;163:770–8. doi: 10.1093/aje/kwj082. [DOI] [PMC free article] [PubMed] [Google Scholar]
- 26.Freedman LS, Potischman N, Kipnis V, Midthune D, Schatzkin A, Thompson FE, Troiano RP, Prentice R, Patterson R, et al. A comparison of two dietary instruments for evaluating the fat-breast cancer relationship. Int J Epidemiol. 2006;35:1011–21. doi: 10.1093/ije/dyl085. [DOI] [PubMed] [Google Scholar]
- 27.Rock CL, Flatt SW, Thomson CA, Stefanick ML, Newman VA, Jones L, Natarajan L, Pierce JP, Chang RJ, et al. Plasma triacylglycerol and HDL cholesterol concentrations confirm self-reported changes in carbohydrate and fat intakes in women in a diet intervention trial. J Nutr. 2004;134:342–7. doi: 10.1093/jn/134.2.342. [DOI] [PubMed] [Google Scholar]