

Abstract
Context
Sickle cell disease is characterized by a state of nitric oxide (NO) resistance and limited bioavailability of L-arginine, the substrate for NO synthesis. We hypothesized that increased arginase activity and dysregulated arginine metabolism contribute to endothelial dysfunction, pulmonary hypertension and patient outcome.
Objectives
To explore the role of arginase in sickle cell disease pathogenesis, pulmonary hypertension and prospective mortality.
Design
Plasma amino acid levels, plasma and erythrocyte arginase activities, and pulmonary hypertension status as measured by Doppler-echocardiogram were prospectively obtained in outpatients with sickle cell disease. Patients were followed for survival up to 49 months.
Setting
Urban, tertiary care center and community clinics.
Participants
Two hundred twenty-eight patients with sickle cell disease aged 18 to 74 years and 36 control subjects.
Main Outcome Measures
Plasma amino acid levels, plasma and erythrocyte arginase activities, diagnosis of pulmonary hypertension, and mortality.
Results
Plasma arginase activity was significantly elevated in patients with sickle cell disease, with highest activity found in subjects with secondary pulmonary hypertension. Arginase activity correlated with the arginine-to-ornithine ratio, and lower ratios were associated with greater severity of pulmonary hypertension and with mortality in this population (risk ratio: 2.5; 95% confidence interval [1.2, 5.2], p=0.006). Global arginine bioavailability, characterized by the arginine-to-(ornithine plus citrulline) ratio, was also strongly associated with mortality (risk ratio: 3.6; [1.5, 8.3], p<0.001). Increased plasma arginase activity was highly correlated with increased intravascular hemolytic rate and, to a lesser extent, markers of inflammation and soluble adhesion molecule levels.
Conclusions
These data support a novel mechanism of disease in which hemolysis contributes to reduced NO bioavailability and endothelial dysfunction, via release of erythrocyte arginase, which limits arginine bioavailability, and release of erythrocyte hemoglobin, which scavenges NO. The arginine-to-ornithine and arginine-to-(ornithine plus citrulline) ratios are independently associated with pulmonary hypertension and increased mortality in patients with sickle cell disease.
Introduction
L-Arginine, the substrate for nitric oxide (NO) synthesis, is deficient in sickle cell disease 1-4. Increased NO consumption by cell-free plasma hemoglobin 5 and reactive oxygen species 6, 7 leads to decreased NO bioavailability 8, 9 that is exacerbated by decreased availability of the NO synthase substrate L-arginine. This state of resistance to NO is accompanied by a compensatory upregulation of nitric oxide synthase and non-NO dependent vasodilators 10-13. Under conditions of low arginine concentration, NO synthase is uncoupled, producing reactive oxygen species in lieu of NO 14, 15, potentially further reducing NO bioavailability in sickle cell disease and enhancing oxidative stress. Recent reports of elevated arginase activity in sickle cell disease 16-18 offer another avenue for decreased arginine bioavailability. Arginase, an enzyme that converts L-arginine to ornithine and urea, can limit NO bioavailability through increased consumption of the substrate for NO synthase 19-21. Found predominantly in the liver and kidneys, arginase is also present in human red blood cells 22, 23, and it can be induced in many cell types by a variety of cytokines and inflammatory stimuli 20, 24, 25. Furthermore, since arginine and ornithine compete for the same transport system for cellular uptake 26, 27, a decrease in the arginine-to-ornithine ratio resulting from increased arginase activity could further limit arginine bioavailability for NO synthesis.
We have previously reported high plasma arginase activity in 10 sickle cell disease patients with pulmonary hypertension 18. Death within a year of enrollment in that study occurred in 2 patients with the highest arginase activity. Pulmonary hypertension is common in both adults and children with sickle cell disease 28-31 and is an important predictor of early mortality 29. Pulmonary hypertension also develops in most other hereditary and chronic hemolytic anemias, including thalassemia 32, hereditary spherocytosis 33, paroxysmal nocturnal hemoglobinuria 34, and other hemolytic disorders 35-38, supporting the existence of a clinical syndrome of hemolysis-associated pulmonary hypertension 29, 39, 40. Since endothelial dysfunction may contribute to the pathogenesis of pulmonary hypertension through impaired production and bioavailability of, and responsiveness to, NO 41-44, we hypothesized that elevated arginase activity and dysregulated arginine metabolism may contribute to the endothelial dysfunction syndrome that occurs in sickle cell disease. Consistent with this hypothesis, arginase activity and alterations in arginine metabolic pathways have recently been implicated in the pathophysiology of primary pulmonary hypertension 45. The goal of this study was to identify the source of increased plasma arginase activity in a large cohort of patients with sickle cell disease and to evaluate the contribution of dysregulated arginine metabolism to patient morbidity and mortality.
Materials and Methods
Patients and Controls
The patient population is comprised of 228 sequentially enrolled subjects with sickle cell disease hemoglobinopathies for whom measurements of either arginase (n = 140) or arginine and ornithine (n = 209) or both (n = 121) were available. This study includes 188 of a population of 195 subjects that has been described in detail 29. Informed consent was obtained from each subject for an institutional review board-approved protocol to obtain clinical information, echocardiography, blood specimens and prospective clinical follow-up data for research analysis. All laboratory assays were done using the blood specimens that were collected prospectively at enrollment. Detailed patient characteristics are shown in Table 1. In this population of patients with sickle cell disease, right heart catheterization studies have confirmed that a tricuspid regurgitant jet velocity < 2.5 m/s corresponds to normal pulmonary artery pressures, tricuspid regurgitant jet velocity ≥ 2.5 and < 3.0 m/s corresponds to mild pulmonary hypertension, and tricuspid regurgitant jet velocity ≥ 3.0 m/s corresponds to moderate/severe pulmonary hypertension 29. Pulmonary hypertension was prospectively defined as a tricuspid regurgitant jet velocity ≥ 2.5 m/s on Doppler-echocardiography.
Table 1.
Characteristics of the sickle cell disease study population.
| Patient characteristic* | SCD* | n | Controls | n | p** |
|---|---|---|---|---|---|
| Age (years) | 36 (11) | 228 | 37 (11) | 36 | .68 |
| Alanine aminotransferase (U/L) | 27 (15) | 225 | 23 (12) | 36 | .14 |
| Albumin (mg/dL) | 4.1 (0.4) | 224 | 4.1 (.2) | 35 | .29 |
| Alkaline phosphatase (U/L) | 115 (87) | 224 | 78 (23) | 36 | .004 |
| Aspartate aminotransferase (U/L) | 41 (22) | 223 | 24 (8) | 36 | < .001 |
| Blood urea nitrogen (mg/dL) | 10 (10) | 225 | 12 (4) | 36 | .002 |
| C-reactive protein (μg/mL) | .57 (0.91) | 203 | .35 (.47) | 35 | .04 |
| Creatinine (mg/dL) | .71(.67,.76) | 225 | .88(.80,.96) | 36 | .02 |
| Erythrocyte sedimentation rate (mm/h) | 39 (31) | 180 | 21 (18) | 35 | <.001 |
| Gender (% female) | 60 | 228 | 53 | 36 | .44 |
| Hematocrit (%) | 28 (5) | 226 | 41 (4) | 36 | < .001 |
| Hemoglobin (g/dL) | 9.5 (1.8) | 226 | 13.7 (1.5) | 36 | < .001 |
| Hemoglobin F (%) | 7.4 (6.6) | 227 | 0.4 (0.6) | 33 | < .001 |
| Hemoglobin SC (%) | 18 | 228 | |||
| Lactate dehydrogenase (U/L) | 347 (158) | 204 | 166 (39) | 35 | < .001 |
| Reticulocyte count (per μL) | 243 (132) | 214 | 66 (28) | 33 | < .001 |
| Tricuspid regurgitant jet velocity (m/s) | 2.3 (0.6) | 224 | 1.9 (.5) | 36 | .002 |
| Triglycerides (mg/dL) | 116 (68) | 200 | 79 (49) | 29 | < .001 |
| Weight (kg) | 71 (18) | 178 | 84 (16) | 33 | < .001 |
| White blood cell count (thousands/μL) | 10.2 (3.7) | 226 | 5.8 (2.1) | 36 | < .001 |
Mean (standard deviation) for continuous variables (except creatinine, for which geometric mean and 95% confidence interval are shown because of highly skewed values in sickle cell disease patients); percentage with characteristic for dichotomous variable.
From two-sided t-test for continuous variables (on log10 transformed values for laboratory assays); chi-square test without continuity correction for dichotomous variables.
Thirty-six African-American control subjects were evaluated for comparisons of laboratory and echocardiographic data, recruited from a list of volunteers maintained at the National Institutes of Health. Volunteers similar in age and gender distribution as the sickle cell pulmonary hypertension screening cohort were selected. An additional nine African-American control subjects were enrolled specifically to obtain plasma and erythrocyte arginase measurements for comparison of these two measures of arginase activity.
Amino Acid Measurement
Plasma amino acids were quantified via ion exchange chromatography (Beckman model 6300 amino acid analyzer, Fullterton, CA) at the Mayo Clinic (Rochester, MN) by methods recommended by the manufacturer. In addition to arginine and ornithine, citrulline, the endogenous precursor for de novo arginine synthesis, which occurs primarily in the kidney 46, 47, and proline, which is synthesized from ornithine46, were also measured.
Arginase activity
After 153 patients had been enrolled, it was decided to obtain measurements of plasma arginase activity in all patients for whom a sufficient quantity of stored frozen plasma was available (n = 140). Arginase activity was determined as the conversion of [14C-guanidino]-L-arginine to [14C]urea, which was converted to 14CO2 by urease and trapped as Na214CO3 for scintillation counting as previously described 48. Briefly, aliquots of plasma or red blood cell-lysate were spun down upon collection and frozen at −80° Celsius. Thawed samples were later incubated for 10 min at 55° Celsius in complete assay mixture lacking arginine. The reaction was initiated by addition of labeled arginine and incubation was continued at 37° Celsius for 2 hours. The reaction was terminated by heating at 100° Celsius for 3 minutes. Samples were incubated with urease at 37° Celsius for 45 minutes, and Na214CO3 was trapped on NaOH-soaked filters following acidification of the samples with HCl to volatilize the 14CO2. Values of arginase activity are reported as μmol/ml/hr for plasma and as nmol/mg protein/min for cell lysates.
Measurement of Soluble Adhesion Molecules
Plasma levels of endothelial and platelet specific soluble (s) adhesion molecules (sE-selectin, sP-selectin, sVCAM-1 and sICAM-1) were measured using commercially available Enzyme-Linked Immunosorbent Assay (ELISA) kits (R&D Systems, Minneapolis, MN).
Plasma levels of hemoglobin were measured by ELISA as previously described49
Measurement of Myeloperoxidase levels
Myeloperoxidase levels were measured with use of an ELISA (PrognostiX, Cleveland, OH).
Data Analysis
Results are presented as mean and standard deviation (SD), geometric mean and 95% confidence interval (CI), or percentage with characteristic, as appropriate. Two-sided two-sample t-tests were used to compare continuous variables in two groups (for example, amino acid values in sickle cell patients and normal controls). Linear regression on three categories of tricuspid regurgitant jet velocity (< 2.5, 2.5-2.99, and ≥3.0 meters/second; coded 0, 1, 2, respectively) was used to evaluate relationships between amino acid values or arginase and level of pulmonary hypertension in sickle cell patients. Since normal distributions provided poor approximations for many of the variables of interest, bivariate correlations were assessed using the Spearman rank correlation coefficient.
Multiple regression analysis of arginase activity used log10-transformed values for arginase, as well as for laboratory correlates for which normal distributions fit logarithms better than untransformed values; use of logarithms also reduced the influence of extremely high values of independent variables. This modeling used a stepwise procedure to add independent variables, beginning with the variables most strongly associated with log10 arginase and considering all potential covariates associated with log10 arginase with p ≤ 0.15 (Table 3A). Deletion of variables after initial inclusion in the model was allowed. The procedure continued until all independent variables in the final model had p ≤ 0.05, adjusted for other independent variables, and no additional variable had p ≤ 0.05. The final model was confirmed by fitting a similar model using ranks of all variables, including log10 arginase.
Table 3A.
Association with Arginase Activity as measured by Spearman Rank Correlation Coefficient, ρ.
| Category | Variable | ρ | n | p |
|---|---|---|---|---|
| Hemolysis |
Cell-Free Hemoglobin LDH AST Hematocrit Reticulocyte Count |
0.56 0.35 0.34 −0.20 0.09 |
138 121 136 138 126 |
< .001 < .001 < .001 .02 .30 |
| Renal Function | Creatinine Blood Urea Nitrogen |
−0.09 0.08 |
138 138 |
.28 .33 |
| Hepatic Function |
ALT Alkaline Phosphatase Albumin |
0.19 0.07 0.13 |
138 137 137 |
.03 .40 .12 |
|
Acute Phase Reactants |
WBC Myeloperoxidase Basophil Count Monocyte Count ESR C-Reactive Protein Platelet Count |
0.18 0.27 0.15 0.03 0.04 −0.05 0.10 |
138 131 138 138 100 120 136 |
.04 .002 .08 .71 .72 .55 .26 |
|
Pulmonary Function |
O2 Saturation TRV |
−0.30 0.09 |
68 136 |
.01 .30 |
| Lipid |
Triglycerides Cholesterol |
0.34 0.19 |
117 122 |
< .001 .03 |
|
Endothelial Cell Activation |
Soluble E-Selectin Soluble P-Selectin Soluble VCAM-1 Soluble ICAM-1 |
0.23 0.33 0.27 0.17 |
126 135 137 132 |
.008 < .001 .001 .05 |
| Hemoglobin | %HbF %HbA %HbS |
−0.02 −0.13 0.11 |
139 140 139 |
.80 .12 .19 |
Proportional hazards (Cox) regression was used to study relationships between mortality in sickle cell patients and covariates of interest. The proportional hazards assumption was evaluated by assessing whether scaled Shoenfeld residuals50 showed a trend with time.
In all regression modeling, observations with missing values for any variable included in a particular model were deleted; no imputation of missing values was done.
P-values < 0.05 were considered statistically significant; no adjustment for multiple comparisons was made. Analysis was done using NCSS 2004 software (Number Cruncher Statistical Systems, Kaysville, UT).
The analyses described above were preplanned. Additional analyses evaluated arginase activity within erythrocytes and the association between arginase activity in plasma and red blood cell lysate. These analyses involved an unselected subgroup of 16 patients, as well as 45 controls (the original 36 and the additional nine for whom plasma and erythrocyte arginase measurements were made).
Results
Patients with sickle cell disease
General characteristics of the study population of patients with sickle cell disease and controls are shown in Table 1.
Plasma Amino Acid Levels
Plasma amino acid levels in sickle cell disease patients were compared to those in African-American control subjects without sickle cell disease (Table 2). An abnormal amino acid profile was observed in patients with sickle cell disease that is consistent with altered arginine metabolism. The observed dysregulation of the arginine-to-nitric oxide metabolism was greatest in sickle cell disease patients with pulmonary hypertension. Although plasma arginine concentrations were low in sickle cell disease compared to normal controls [41 (16) vs. 67 (18) μM, p<0.001], these levels were similar in patients with and without pulmonary hypertension. However, plasma ornithine levels were elevated in sickle cell patients with severe pulmonary hypertension (tricuspid regurgitant jet velocity ≥ 3.0), and the elevation was significant compared to sickle cell disease patients without pulmonary hypertension [81 (24) vs. 63 (21) μM, p < 0.001 by two-sided t-test], and is likely the result of elevated arginase activity. The arginine-to-ornithine ratio, an indirect measure of arginase activity and relative arginine bioavailability, was low in patients with sickle cell disease compared to controls [0.71 (0.39) vs. 1.20 (0.49), p<0.001; Table 2, Figure 1 A] and was particularly low in the group with severe pulmonary hypertension [0.49 (0.18)]. Ratios were clearly lower even in sickle cell patients without evidence of pulmonary hypertension than in controls [0.74 (0.41) vs. 1.20 (0.49), p <0.001 by two-sided t-test.). The association between arginine-to-ornithine ratio and level of pulmonary hypertension was significant by linear regression of the ratio on category of tricuspid regurgitant jet velocity (Table 2, Figure 1B), but ratios were low only in patients with severe pulmonary hypertension when compared to patients with no evidence of pulmonary hypertension by two-sided t-test adjusted for unequal variances [0.49 (0.18) vs. 0.74 (0.41), p < 0.001].
Table 2.
Distribution (mean ± SD) of amino acids linked to the L-arginine-nitric oxide pathway in sickle cell disease patients with tricuspid regurgitant jet velocity (TRV) < 2.5 m/s, 2.5 – 2.99 m/s, and ≥ 3.0 m/s, and in normal controls.
| Variable | NL Control (n=36) |
All SCD (n=209) |
p* | TRV<2.5 (n=131) |
2.5-2.99 (n=53) |
TRV≥3.0 (n=21) |
p** |
|---|---|---|---|---|---|---|---|
| Arginine | 67 (18) | 41 (16) | < .001 | 41 (16) | 41 (15) | 39 (15) | .51 |
| Ornithine | 62 (22) | 65 (23) | .38 | 63 (21) | 65 (25) | 81 (24) | .003 |
| Proline | 154 (59) | 210 (75) | < .001 | 202 (70) | 219 (80) | 245 (88) | .01 |
| Citrulline | 25 (11) | 25 (13) | .85 | 23 (12) | 26 (15) | 27 (14) | .09 |
| Arg/Orn | 1.20 (.49) | .71 (.39) | < .001 | .74 (.41) | .72 (.39) | .49 (.18) | .03 |
| Arg/(Orn+Cit) | .82 (.27) | .50 (.26) | < .001 | .53 (.27) | .50 (.26) | .36 (.13) | .02 |
P-values are from two-sided two-sample t-test.
P-values are from linear regression on level of TRV, coded 0,1,2.
Figure 1. The arginine-to-ornithine ratio as a surrogate marker for arginase activity, its association with pulmonary hypertension (PHT) and correlation with arginase activity.

A. The arginine-to-ornithine ratio (Arg/Orn) in normal controls (Control, n=36) vs. patients with SCD (n=209). B. Arginine-to-ornithine ratio in sickle cell patients with a tricuspid regurgitant jet velocity (TRV) by echocardiography 2.5-2.9 m/s (mild PHT) vs. patients with a TRV ≥ 3.0 m/s (severe PHT). C. Plasma arginase activity (μmol/ml/hr) in normal controls (Control, n=36) vs. patients with sickle cell disease (SCD, n=140). D. Correlation of plasma arginase activity to the arginine-to-ornithine ratio.
Plasma proline concentrations were also significantly increased in patients compared to controls [210 (75) vs. 154 (59) μM, p<0.001; Table 2]. Patients without pulmonary hypertension had higher proline levels than controls [202 (70) vs. 154 (59), p<0.001 by two-sided t-test], and even higher levels occurred in patients with severe and moderate pulmonary hypertension [245 (88) vs. 219 (80) vs. 202 (70) μM, tricuspid regurgitant jet velocity ≥ 3.0, 2.5-2.99, and < 2.5 m/s, respectively, p=0.01 by linear regression analysis; Table 2]. This possibly indicates increased conversion of ornithine to proline in sickle cell disease that is amplified in patients with pulmonary hypertension (Table 2) and may well account for the fact that plasma ornithine levels did not increase in most sickle cell patients, even as plasma arginase activity increased and plasma arginine levels declined. However, the possibility that reductions in proline catabolism also may contribute to the elevated proline concentrations cannot be ruled out. More precise explanations of the changes in amino acid levels in this patient population will require further studies using isotopic tracer methodology.
Although citrulline levels tended to increase slightly with level of pulmonary hypertension in patients, mean levels were almost identical in patients and controls (Table 2). Citrulline was significantly correlated with creatinine level (ρ=0.51, p<0.001), which is consistent with impaired renal function. Arginine-to-(ornithine plus citrulline) ratio, which takes into account the impact of renal dysfunction on global arginine bioavailability, showed very similar relationships among controls and patients to those for arginine-to-ornithine ratio (Table 2). In aggregate, these data indicate significant modulation of L-arginine metabolism in sickle cell disease that is associated with the development of pulmonary and renal vasculopathy.
Arginase Activity in Plasma
In order to understand the mechanism responsible for dysregulation of L-arginine metabolism, plasma arginase activity was measured in patients and controls. Plasma arginase activity was significantly elevated in patients with sickle cell disease [2.1 (2.1), n=140] compared to controls [0.4 (0.2), n=36, p<0.001 by t-test on log10 arginase]; (Figure 1 C). In patients, arginase activity tended to increase with level of pulmonary hypertension [1.9 (1.8), 2.6 (2.8), and 2.8 (2.0) for tricuspid regurgitant jet velocity < 2.5 m/s, 2.5-2.99 m/s, and ≥ 3.0 m/s, respectively], although the association was not significant in linear regression of log10 arginase on the three categories of tricuspid regurgitant jet velocity, coded 0, 1, 2 (R2 = 0.017, p=0.13). However even in patients without pulmonary hypertension, sickle cell disease patients had significantly higher arginase activity compared to control subjects [0.4 (0.2) vs. 1.9 (1.8), p<0.001). Arginase activity was significantly correlated with arginine-to-ornithine ratio (ρ=−0.34, p<0.001; Figure 1D); however, it is likely only one of several factors affecting this ratio and arginine bioavailability in patients with sickle cell disease.
Arginase Activity and Associations with Biochemical and Clinical Markers
The relationship between arginase activity and clinical laboratory markers of disease severity was evaluated in order to identify mechanisms for increased enzymatic activity and associated effects on organ function (Table 3 A). Plasma arginase activity was significantly associated with several markers of increased hemolytic rate, including cell-free plasma hemoglobin (ρ=0.56, p<0.001; Figure 2), lactate dehydrogenase (LDH, ρ=0.35, p<0.001), aspartate aminotransferase (AST, ρ=0.34, p<0.001), and hematocrit (ρ=−0.20 p=0.02). The lack of correlation between arginase and reticulocyte count in this cohort likely reflects the suppressive effects of transfusions, renal impairment and hydroxyurea therapy on reticulocytosis in the most severely affected patients. Other significant associations included oxygen saturation, white blood cell count, myeloperoxidase, alanine aminotransferase (ALT), endothelial and platelet specific soluble adhesion molecules (sE-selectin, sP-selectin, sVCAM-1 and sICAM-1), triglycerides and cholesterol (Table 3A). No association of arginase activity with age (ρ=−0.09, p=0.31) or gender (p=0.63 by t-test on log10 arginase) was identified. There was no evidence of association between elevated arginase activity and markers of renal function (Table 3 A).
Figure 2. Association of arginase activity with hemolytic rate.

Correlation of plasma arginase activity (μmol/ml/hr) to cell-free hemoglobin (Cell-Free Hb, n=138, p< 0 .001) in patients with sickle cell disease.
In multiple regression analysis of log10 arginase activity, all variables associated with log10 arginase with p ≤ 0.15 in Table 3A were considered in a stepwise model fitting process. In the final model, log10 arginase activity was related to log10 cell-free hemoglobin, log10 sP-selectin and log10 triglycerides (n = 110, R2=0.40, adjusted p<0.001 for all independent variables; Table 3 B). The low variance inflation factors (≤ 1.11 for all three covariates in the model) suggest that there was no multicollinearity problem in this model and that each of the three covariates was independently related to log10 arginase. However, since the residuals were not well fit by a normal distribution, the analysis for the final model was repeated using ranks for all the variables. The results were similar; R2=0.43, adjusted p<0.001 for ranks of cell-free hemoglobin and sP-selectin and 0.001 for rank of triglycerides.
Table 3 B.
Associations with Log10 Arginase Activity in Multiple Regression Analysis.
| Category | Variable | r** | p** |
|---|---|---|---|
| Hemolysis |
Log10 Cell-Free Hemoglobin |
.45 | < .001 |
| Lipid | Log10 Triglycerides | .32 | < .001 |
| Adhesion | Log10 P-selectin | .33 | < .001 |
Partial (Pearson) correlation coefficient, adjusted for other independent variables in model.
Adjusted for other independent variables in model; n = 110, R2 = 0.40
No adjustment has been made for multiple comparisons in these analyses. This seems appropriate, since the objective of this study is to detect potentially important associations involving arginase, not to control the overall type I error rate. Even if we made a conservative adjustment, however – for example, multiplying p-values in Table 3A by the number of correlations shown – the major associations would still have p < 0.05. (Note that p-values reported here as < 0.001 are often actually < 0.0001.) Further, regression modeling enables us to estimate the number of variables, among those considered, that are independently associated with arginase activity and with mortality.
These data indicate that increased plasma arginase activity in sickle cell disease patients is associated with intravascular hemolysis, endothelial activation and inflammation.
Arginase Activity in Red Blood Cells
In order to further identify the source of increased plasma arginase activity, arginase activities were determined also for red blood cell lysates of normal controls and a subset of 16 patients with sickle cell disease in whom both frozen plasma and red blood cell lysates were available for comparison (Figure 3 A). Specific activities of arginase in red blood cell-lysate of patients with sickle cell disease were significantly higher than those of controls [37.7 (2.9), n=16 vs. 23.5 (1.7) nmol/mg/min, n=45, p<0.0001 by t-test on log10 arginase]. For purposes of comparison, “normal range” boundaries were set arbitrarily at approximately the 80th percentile for arginase activities of both red blood cell-lysates and plasma of control patients. Two-thirds of all control values fall within these boundaries, while in striking contrast, 94% of all values for plasma and erythrocyte arginase activities of sickle patients fall outside these boundaries (Figure 3 B).
Figure 3. Arginase activity in red blood cell lysate vs. plasma.
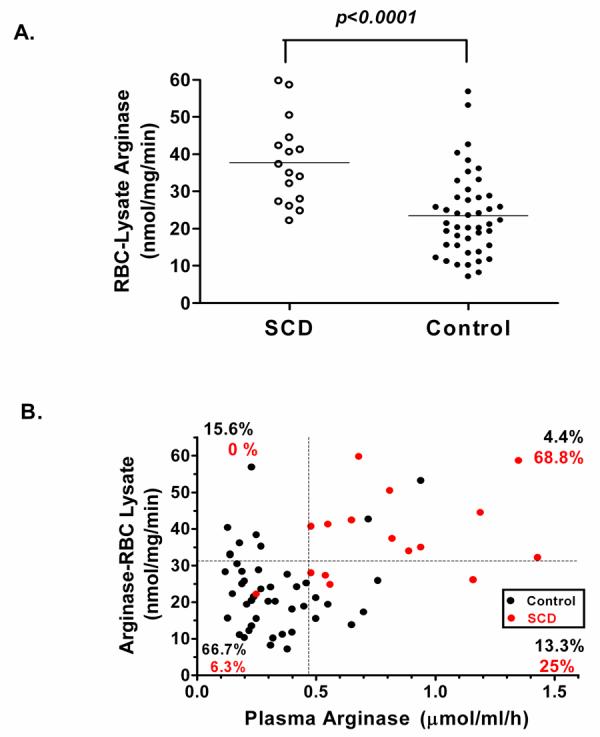
A. Red blood cell (RBC)–lysate arginase activity (nmol/mg/min) in normal controls (Control, n=45) compared to patients with sickle cell disease (SCD, n=16). B. Correlation of plasma arginase to red blood cell-lysate arginase activity in control patients (black circles) and patients with sickle cell disease (red circles; r=0.43, p< 0.001). For purposes of comparison, horizontal and vertical dotted lines are set at approximately the 80th percentile for arginase activities of RBC-lysates and plasma, respectively, for control patients.
Relationship of Dysregulated Arginine Metabolism to Mortality Rate
Information on deaths was collected during a follow-up period of up to 49 months. Since enrollment in the study, eighteen sickle cell patients had died as of March 2005, with median survival time of 14 months (range 2-41 months). Median follow-up was 33 months for the 210 patients who survived (range 7-49 months). Nine patients had not responded to attempts to contact them and were considered lost to follow-up. Confirmation of all deaths with death certificates and the absence of available death certificates in the United States for patients lost to follow-up suggest that we have not missed any deaths and all patients lost to follow-up were alive at the time of data analysis.
Fourteen of the 18 patients who died had tricuspid regurgitant jet velocity ≥ 2.5 m/s, and by proportional hazards regression analysis the presence of pulmonary hypertension by this definition was the most significant risk factor for death (risk ratio 7.4, [2.4,22.4], p<0.001, Table 4). Plasma amino acid concentrations and plasma arginase activities were available for all 18 who died. Low ratios of plasma arginine-to-ornithine and arginine-to-(ornithine+citrulline) were associated with mortality in proportional hazards regression (Table 4, Figure 4). After adjustment for high tricuspid regurgitant jet velocity and log10 creatinine, the arginine-to-ornithine and arginine-to(ornithine+citrulline) ratios remained significantly related to mortality ; thus, either of these ratios may be an independent risk factor for death in sickle cell patients. Age was not significantly related to mortality after adjustment for the above variables. Estimated adjusted risk ratios (for 25th percentile relative to 75th percentile) were 2.2 (p=0.023) for arginine-to-ornithine and 2.9 (p=0.007) for arginine-to-(ornithine+citrulline) (Table 4). There was no evidence that risk ratios were different for patients with low (< 2.5 m/s) and high (≥ 2.5 m/s) tricuspid regurgitant jet velocity.
Table 4.
Proportional Hazards (Cox) Regression Analysis of Mortality
| Risk Factor | Total* | # of Deaths |
p** | Risk Ratio (RR)*** |
95% CI**** for RR |
|---|---|---|---|---|---|
| Low arginine/ornithine | 207 | 18 | .006 | 2.5 | (1.2, 5.2) |
| TR jet velocity ≥ 2.5 | 222 | 18 | <.001 | 7.4 | (2.4, 22.4) |
| Low arginine/ornithine, adjusted for TR jet velocity (< 2.5 or ≥ 2.5) |
203 | 18 | .019 | 2.2 | (1.0, 4.7) |
| TR jet velocity ≥ 2.5, adjusted for arginine/ornithine |
203 | 18 | <.001 | 6.3 | (2.1, 19.2) |
| Low arginine/ornithine, adjusted for TR jet velocity (< 2.5 or ≥ 2.5) & log10 creatinine |
201 | 18 | .023 | 2.2 | (1.0. 4.9) |
| Low arginine/(ornithine+citrulline) | 207 | 18 | <.001 | 3.6 | (1.5, 8.3) |
| Low arginine/(ornithine+citrulline), adjusted for TR jet velocity (< 2.5 or ≥ 2.5) |
203 | 18 | .002 | 3.3 | (1.4, 7.6) |
| TR jet velocity ≥ 2.5, adjusted for arginine/(ornithine+citrulline) |
203 | 18 | <.001 | 6.1 | (2.0, 18.6) |
| Low arginine/(ornithine+citrulline), adjusted for TR jet velocity (< 2.5 or ≥ 2.5) & log10 creatinine |
201 | 18 | .007 | 2.9 | (1.2, 7.0) |
Numbers vary because of missing values for risk factors. Two individuals with no follow-up time are not included.
Likelihood ratio test.
For arginine/ornithine and arginine/(ornithine+citrulline), RR is given for 25th to 75th percentile, calculated as ecoefficient × (25th percentile – 75th percentile). For TR jet velocity, RR is given for values ≥ 2.5 (coded 1) relative to values < 2.5 (coded 0). Values shown are unadjusted for other risk factors unless otherwise indicated.
Confidence interval.
Figure 4. Association of arginine bioavailability ratios with mortality in sickle cell disease: Kaplan-Meier survival plots.

A. Survival for three categories of Arginine-to-Ornithine ratio: “High” = upper quartile, > 0.8690; “Medium” = 25th to 75th percentiles, > 0.4385 and ≤ 0.8690; “Low” = lower quartile, ≤ 0.4385. B. Survival for three categories of Arginine-to-(Ornithine + Citrulline) ratio: “High” = upper quartile, > 0.6254, “Medium” = 25th to 75th percentiles, > 0.3245 and ≤ 0.6254, “Low” = lower quartile, ≤ 0.3245.
The assumption of proportional hazards (i.e., constant risk ratio) for arginine-to-ornithine and arginine-to-(ornithine+citrulline) seemed reasonable, since scaled Shoenfeld residuals 50 for these variables did not show a strong trend with follow-up time.
Arginase activity was not directly associated with mortality, however in shifting L-arginine metabolism away from NO production and towards ornithine-dependent pathways, increased arginase activity may contribute to events that put patients at risk for early death.
Discussion
This large cohort study of patients with sickle cell disease not only confirms previous reports of elevated arginase activity in sickle cell disease 16-18, 23 but, more importantly, also demonstrates important associations between dysregulated L-arginine metabolism, pulmonary hypertension and prospective mortality. Additionally, these data suggest that elevated plasma arginase activity in sickle cell disease is primarily the consequence of erythrocyte arginase release during intravascular hemolysis, with possibly some contribution from endothelial cell activation associated with inflammation, and liver injury in some patients. Global arginine bioavailability is diminished further through impairment of de novo arginine synthesis in patients with renal dysfunction. These observations support a novel mechanism of disease that links oxidative stress 6, 7, chronic organ damage 13, 51, and hemolytic rate 5, 29, 39, 40, 52 to endothelial dysfunction and pulmonary hypertension.
Arginase is an intracellular enzyme that appears in the plasma only after cell damage or death. Thus, inflammation, chronic end-organ damage and hemolysis are all potential sources of elevated arginase activity in sickle cell disease. Arginase activity is higher in immature red blood cells and reticulocytes 23, both of which are plentiful in sickle cell disease. Nearly 94% of the patients with sickle cell disease had arginase values outside the “normal range” boundaries, with two-thirds of the sickle cell disease population exhibiting elevated arginase activity in both plasma and red blood cell lysate (Figure 3). Elevated erythrocyte arginase activity has also been reported in patients with megaloblastic anemia 23 and thalassemia patients 53, 54. In addition to NO scavenging by cell free plasma hemoglobin, erythrocyte arginase release during hemolysis may represent a mechanistic link between the pulmonary hypertension syndrome that develops in sickle cell disease and other hemolytic disorders such as thalassemia, hereditary spherocytosis, and paroxysmal nocturnal hemoglobinuria 29, 39 and warrants further investigation. These combined mechanisms support a model whereby hemolysis produces a state of reduced endothelial NO bioavailability that might contribute to endothelial dysfunction, intimal and smooth muscle proliferation, oxidant stress and thrombosis 5.
Association of arginase activity with common markers of inflammation such as white blood cell count and myeloperoxidase is not unexpected, as arginase is induced in monocytes in response to helper T cell type 2 cytokines 24, inflammatory mediators that are elevated in sickle cell disease 55. Elevated arginase activity has also recently been discovered in asthma 56-59, another T cell type 2 cytokine-related disorder 60, 61 that may be relevant to the pathophysiology of sickle cell disease since 30-70 % of pediatric patients with sickle cell disease have reactive airways 62, 63.
An association of arginase activity with plasma soluble adhesion molecules is a novel observation, although also not unexpected since endothelial cells assume an inflammatory phenotype in sickle cell disease 64, 65. In particular, endothelial sP-selectin is thought to contribute to the microcirculatory abnormalities in sickle cell disease 66-68. Significant correlations with sE-selectin, sVCAM-1, and sICAM-1 were also identified; however, only an independent relationship of arginase activity to sP-selectin was maintained in multiple regression analysis. This may also represent a link between arginase activity and platelet activation. It remains to be determined whether these findings represent a causal relationship between arginase and adhesion molecules or reflect a common response to endothelial injury or proinflammatory cytokine release.
Equally intriguing is the association of arginase activity with triglycerides and cholesterol, given growing support for triglyceride involvement in endothelial dysfunction 69-71. Although triglycerides are generally lower in sickle cell disease 72, they are increased by tumor necrosis factor α, interleukin-1, and other cytokines 73, which are elevated in sickle cell disease 74. Although the true significance of this finding remains to be determined, this relationship may be a reflection of a broader common pathway between arginase activity and abnormal lipid metabolism in endothelial dysfunction and warrants further investigation.
Plasma arginine concentration in sickle cell disease is approximately 40-50 μM at baseline, well below the Km for the arginine transport system (approximately 100 μM 26, 27). Thus, even modest reductions in plasma arginine concentration can significantly impact cellular arginine uptake and bioavailability. In the current study we find that the ratio of arginine-to-ornithine is associated with arginase activity. Because arginine and ornithine compete for uptake via the same transport system 26, 27, decreases in the arginine-to-ornithine ratio in sickle cell disease patients also represent decreases in arginine bioavailability. Consistent with a metabolic marker of arginine bioavailability, a low arginine-to-ornithine ratio was associated with worsening severity of pulmonary hypertension and independently associated with mortality. As conversion of citrulline to arginine occurs primarily within the kidney 46, 47, the increased mortality risk ratio observed after citrulline was included in the Cox regression analysis probably reflects effects of renal dysfunction on arginine bioavailability. Indeed, citrulline levels trended higher in sickle cell disease patients with pulmonary hypertension and correlated with rising creatinine levels (Spearman ρ= 0.51, p<0.001).
The alterations in arginine metabolism in sickle cell disease and their implications for clinical complications are summarized in Figure 5. As arginase and cell-free hemoglobin correlate strongly with one another, and are both released from erythrocytes as they undergo hemolysis, the independent contribution of each toward decreasing bioavailability of NO can not be determined in this clinical study, and causality can not be assumed. However, increased catabolism of arginine via arginase may not only compromise the ability to synthesize NO but also may contribute to the pulmonary vascular remodeling that occurs in pulmonary hypertension through increased production of ornithine, a precursor for synthesis of proline and polyamines 46 (Figure 5), which are required for collagen synthesis and cell proliferation, respectively, that occur in vascular remodeling 57, 59. Analogous to its proposed roles in asthma 57, 59, elevated proline levels in sickle cell disease demonstrated in this and other studies 3, 75 may contribute to pulmonary fibrosis and lung pathogenesis by promoting collagen synthesis.
Figure 5. Altered arginine metabolism in sickle cell disease.

Arginine is synthesized endogenously primarily via the intestinal-renal axis 46. Stimuli that increase activities of nitric oxide synthase (NOS) and arginase are indicated, as are conditions that result in increased NO consumption. Potential consequences of elevated ornithine production are also indicated.
These findings suggest that dysregulated arginine metabolism is associated with intravascular hemolysis, inflammation, and endothelial cell activation. Alterations in the normal balance of arginine and its catabolic byproducts ornithine, citrulline and proline are associated with pulmonary hypertension and prospective risk of death. These easily measured ratios may provide clinicians with an objective index of disease severity that could identify patients at risk and allow for earlier and more aggressive therapeutic intervention.
Acknowledgments
The authors would like to acknowledge the clinical contributions of Dr. Oswaldo Castro, Wynona Coles, and the large number of sickle cell patients who participated in these studies. Mary Hall has provided invaluable protocol support, and Inez Ernst RN provided echocardiography technical support. This study was supported in part by National Institute of Health grants HL-04386-05 and M01-RR01271, Pediatric Clinical Research Center (to CRM), GM57384 (to SMM) and NIH Intramural Research Funds (to MTG and GJK).
References
- 1.Morris CR, Kuypers FA, Larkin S, Vichinsky E, Styles L. Patterns of arginine and nitric oxide in sickle cell disease patients with vaso-occlusive crisis and acute chest syndrome. J Pediatr Hematol Oncol. 2000;22:515–520. doi: 10.1097/00043426-200011000-00009. [DOI] [PubMed] [Google Scholar]
- 2.Enwonwu CO. Increased metabolic demand for arginine in sickle cell anaemia. Med Sci Res. 1989;17:997–998. [Google Scholar]
- 3.VanderJagt DJ, Kanellis GJ, Isichei C, Pastuszyn A, Glew RH. Serum and urinary amino acid levels in sickle cell disease. J Trop Pediatr. 1997;43:220–225. doi: 10.1093/tropej/43.4.220. [DOI] [PubMed] [Google Scholar]
- 4.Morris CR, Kuypers FA, Larkin S, et al. Arginine therapy: A novel strategy to increase nitric oxide production in sickle cell disease. Brit J Haematol. 2000;111:498–500. doi: 10.1046/j.1365-2141.2000.02403.x. [DOI] [PubMed] [Google Scholar]
- 5.Reiter C, Wang X, Tanus-Santos J, et al. Cell-free hemoglobin limits nitric oxide bioavailability in sickle-cell disease. Nat Med. 2002;8:1383–1389. doi: 10.1038/nm1202-799. [DOI] [PubMed] [Google Scholar]
- 6.Aslan M, Ryan T, Adler B, et al. Oxygen radical inhibition of nitric oxide-dependent vascular function in sickle cell disease. Proc Natl Acad Sci. 2001;98:15215–15220. doi: 10.1073/pnas.221292098. [DOI] [PMC free article] [PubMed] [Google Scholar]
- 7.Dias-Da-Motta P, Arruda V, Muscara M, Saad S. The release of nitric oxide and superoxide anion by neutrophils and mononuclear cells from patients with sickle cell anaemia. Brit J Haematol. 1996;93:333–340. doi: 10.1046/j.1365-2141.1996.4951036.x. [DOI] [PubMed] [Google Scholar]
- 8.Reiter CD, Gladwin MT. An emerging role for nitric oxide in sickle cell disease vascular homeostatis and therapy. Curr Opin Hematol. 2003;10:99–107. doi: 10.1097/00062752-200303000-00001. [DOI] [PubMed] [Google Scholar]
- 9.Gladwin M, Schechter A, Ognibene F, et al. Divergent nitric oxide bioavailability in men and women with sickle cell disease. Circulation. 2003;107:271–278. doi: 10.1161/01.cir.0000044943.12533.a8. [DOI] [PubMed] [Google Scholar]
- 10.Kaul DK, Liu XD, Fabry ME, Nagel RL. Impaired nitric oxide-mediated vasodilation in transgenic sickle mouse. Am J Physiol Heart Circ Physiol. 2000;278:H1799–1806. doi: 10.1152/ajpheart.2000.278.6.H1799. [DOI] [PubMed] [Google Scholar]
- 11.Diwan BA, Gladwin MT, Moguchi CT, Ward JM, Fitzhugh AL, Buzard GS. Renal pathology in hemizygous sickle cell mice. Toxicol Pathol. 2002;30:254–262. doi: 10.1080/019262302753559597. [DOI] [PubMed] [Google Scholar]
- 12.Bank N, Aynedjian H, Qiu J, et al. Renal nitric oxide synthases in transgenic sickle cell mice. Kidney Int. 1996;50:184–189. doi: 10.1038/ki.1996.301. [DOI] [PubMed] [Google Scholar]
- 13.Kaul DK, Liu X, Chang H, Nagel RL, Fabry ME. Effect of fetal hemoglobin on microvascular regulation in sickle transgenic-knockout mice. J Clin Invest. 2004;114:1136–1145. doi: 10.1172/JCI21633. [DOI] [PMC free article] [PubMed] [Google Scholar]
- 14.Xia Y, Dawson V, Dawson T, Snyder S, Zweier J. Nitric oxide synthase generates superoxide and nitric oxide in arginine-depleted cells leading to peroxynitrite-mediated cellular injury. Proc Natl Acad Sci. 1996;93:6770–6774. doi: 10.1073/pnas.93.13.6770. [DOI] [PMC free article] [PubMed] [Google Scholar]
- 15.Heinzel B, John M, Klatt P, Bohme E, Mayer B. Ca2+/calmodulin-dependent formation of hydrogen peroxide by brain nitric oxide synthase. Biochem J. 1992;281:627–630. doi: 10.1042/bj2810627. [DOI] [PMC free article] [PubMed] [Google Scholar]
- 16.Waugh W, Daeschner C, Files B, Gordon D. Evidence that L-arginine is a key amino acid in sickle cell anemia - a preliminary report. Nutritional Research. 1999;19:501–518. [Google Scholar]
- 17.Morris CR, Vichinsky EP, van Warmerdam J, et al. Hydroxyurea and arginine therapy: impact on nitric oxide production in sickle cell disease. J Pediatr Hematol Oncol. 2003;25:629–634. doi: 10.1097/00043426-200308000-00008. [DOI] [PubMed] [Google Scholar]
- 18.Morris CR, Morris SM, Jr., Hagar W, et al. Arginine Therapy: A new treatment for pulmonary hypertension in sickle cell disease? Am J Respir Crit Care Med. 2003;168:63–69. doi: 10.1164/rccm.200208-967OC. [DOI] [PubMed] [Google Scholar]
- 19.Mori M, Gotoh T. Regulation of nitric oxide production by arginine metabolic enzymes. Biochem Biophys Res Commun. 2000;275:715–719. doi: 10.1006/bbrc.2000.3169. [DOI] [PubMed] [Google Scholar]
- 20.Morris SM., Jr . Regulation of arginine availability and its impact on NO synthesis. In: Ignarro L, editor. Nitric Oxide. Biology and Pathobiology. Academic Press; San Diego: 2000. pp. 187–197. [Google Scholar]
- 21.Boucher JL, Moali C, Tenu JP. Nitric oxide biosynthesis, nitric oxide synthase inhibitors and arginase competition for L-arginine utilization. Cell Mol Life Scd. 1999;55:1015–1028. doi: 10.1007/s000180050352. [DOI] [PMC free article] [PubMed] [Google Scholar]
- 22.Kim P, Iyer R, Lu K, et al. Expression of the liver form of arginase in erythrocytes. Mol Genet Metab. 2002;76:100–110. doi: 10.1016/s1096-7192(02)00034-3. [DOI] [PubMed] [Google Scholar]
- 23.Azizi E, Dror Y, Wallis K. Arginase activity in erythrocytes of healthy and ill children. Clin Chim Acta. 1970;28:391–396. doi: 10.1016/0009-8981(70)90063-x. [DOI] [PubMed] [Google Scholar]
- 24.Morris SM., Jr Regulation of enzymes of the urea cycle and arginine metabolism. Annu Rev Nutr. 2002;22:87–105. doi: 10.1146/annurev.nutr.22.110801.140547. [DOI] [PubMed] [Google Scholar]
- 25.Mori M, Gotoh T. Relationship between arginase activity and nitric oxide production. In: Ignarro L, editor. Nitric Oxide. Biology and Pathology. Academic Press; San Diego: 2000. pp. 199–208. [Google Scholar]
- 26.Closs EI, Mann GE. Membrane transport of L-arginine and cationic amino acid analogs. Academic Press; San Diego: 2000. [Google Scholar]
- 27.Closs EI. Expression, regulation and function of carrier proteins for cationic amino acids. Curr. Opin. Nephrol. Hyperten. 2002;11:99–107. doi: 10.1097/00041552-200201000-00015. [DOI] [PubMed] [Google Scholar]
- 28.Morris CR, Gardner J, Hagar W, Vichinsky EP. Pulmonary hypertension in sickle cell disease: A common complication for both adults and children. Blood. 2004;104:463a. [Google Scholar]
- 29.Gladwin M, Sachdev V, Jison M, et al. Pulmonary hypertension as a risk factor for death in patients with sickle cell disease. N Engl J Med. 2004;350:22–31. doi: 10.1056/NEJMoa035477. [DOI] [PubMed] [Google Scholar]
- 30.Sutton LL, Castro O, Cross DJ, Spencer JE, Lewis LF. Pulmonary hypertension in sickle cell disease. Am J Cardiol. 1994;74:626–628. doi: 10.1016/0002-9149(94)90760-9. [DOI] [PubMed] [Google Scholar]
- 31.Castro O, Hoque M, Brown M. Pulmonary hypertension in sickle cell disease: cardiac catheterization results and survival. Blood. 2003;101:1257–1261. doi: 10.1182/blood-2002-03-0948. [DOI] [PubMed] [Google Scholar]
- 32.Aessopos A, Stamatelow G, Skoumas V, Vassilopoulos G, Mantzourani M, Loulopoulos D. Pulmonary hypertension and right heart failure in patients with B-thalassemia intermedia. Chest. 1995;107:50–53. doi: 10.1378/chest.107.1.50. [DOI] [PubMed] [Google Scholar]
- 33.Verresen D, De Backer W, Van Meerbeeck J, Neetens I, Van Marck E, Vermeire P. Spherocytosis and pulmonary hypertension: coincidental occurrence or causal relationship? Eur Respir J. 1991;4:629–631. [PubMed] [Google Scholar]
- 34.Heller PG, Grinberg AR, Lencioni M, Molina MM, Roncoroni AJ. Pulmonary hypertension in paroxysmal nocturnal hemoglobinuria. Chest. 1992;102:642–643. doi: 10.1378/chest.102.2.642. [DOI] [PubMed] [Google Scholar]
- 35.Labrune P, Sittoun J, Duvaltier I, et al. Haemolytic uraemic syndrome and pulmonary hypertension in a patient with methionine synthase deficiency. Eur J Pediatr. 1999;158:734–739. doi: 10.1007/s004310051190. [DOI] [PubMed] [Google Scholar]
- 36.Stuard ID, Heusinkveld RS, Moss AJ. Microangiopathic haemolytic anemia and thrombocytopenia in primary pulmonary hypertension. N Engl J Med. 1972;287:869–870. doi: 10.1056/NEJM197210262871710. [DOI] [PubMed] [Google Scholar]
- 37.Jubelirer SJ. Primary pulmonary hypertension. Its association with microangiopathic haemolytic anemia and thrombocytopenia. Arch Intern Med. 1991;151:1221–1223. doi: 10.1001/archinte.151.6.1221. [DOI] [PubMed] [Google Scholar]
- 38.Chou R, DeLoughery TG. Recurrent thromboembolic disease following splenectomy for pyruvate kinase deficiency. Am J Hematol. 2001;67:197–199. doi: 10.1002/ajh.1107. [DOI] [PubMed] [Google Scholar]
- 39.Jison ML, Gladwin MT. Hemolytic anemia-associated pulmonary hypertension of sickle cell disease and the nitric oxide/arginine pathway. Am J Respir Crit Care Med. 2003;168:3–4. doi: 10.1164/rccm.2304002. [DOI] [PubMed] [Google Scholar]
- 40.Rother RP, Bell L, Hillmen P, Gladwin MT. The Clinical Sequelae of Intravascular Hemolysis and Extracellular Plasma Hemoglobin: A Novel Mechanism of Human Disease. JAMA. 2005;293:1653–62. doi: 10.1001/jama.293.13.1653. [DOI] [PubMed] [Google Scholar]
- 41.Mehta S, Stewart D, Langleben D, Levy R. Short-term pulmonary vasodilation with L-arginine in pulmonary hypertension. Circulation. 1995;92:1539–1545. doi: 10.1161/01.cir.92.6.1539. [DOI] [PubMed] [Google Scholar]
- 42.Archer S, Djaballah K, Humbert M, et al. Nitric oxide deficiency in fenfluramine and dexfenfluramine-induced pulmonary hypertension. Am J Respir Crit Care Med. 1998;158:1061–1067. doi: 10.1164/ajrccm.158.4.9802113. [DOI] [PubMed] [Google Scholar]
- 43.Cooper C, Landzberg M, Anderson T, et al. Role of nitric oxide in the local regulation of pulmonary vascular resistance in humans. Circulation. 1996;93:266–271. doi: 10.1161/01.cir.93.2.266. [DOI] [PubMed] [Google Scholar]
- 44.Kaneko F, Arroliga A, Dweik R, et al. Biochemical reaction products of nitric oxide as quantitative markers of primary pulmonary hypertension. Am J Respir Crit Care Med. 1998;158:917–923. doi: 10.1164/ajrccm.158.3.9802066. [DOI] [PubMed] [Google Scholar]
- 45.Xu W, Kaneko TF, Zheng S, et al. Increased arginase II and decreased NO synthesis in endothelial cells of patients with pulmonary arterial hypertension. FASEB. 2004;18:1746–1748. doi: 10.1096/fj.04-2317fje. [DOI] [PubMed] [Google Scholar]
- 46.Wu G, Morris SM., Jr Arginine metabolism: nitric oxide and beyond. Biochem J. 1998;336:1–17. doi: 10.1042/bj3360001. [DOI] [PMC free article] [PubMed] [Google Scholar]
- 47.Featherston WR, Rogers QR, Freedland RA. Relative importance of kidney and liver in synthesis of arginine by the rat. Am J Physiol. 1973;224:127–129. doi: 10.1152/ajplegacy.1973.224.1.127. [DOI] [PubMed] [Google Scholar]
- 48.Morris SM, Jr., Kepka-Lenhart D, Chen L. Differential regulation of arginases and inducible nitric oxide synthase in murine macrophage cells. Am J Physiol. 1998;275:E740–747. doi: 10.1152/ajpendo.1998.275.5.E740. [DOI] [PubMed] [Google Scholar]
- 49.Wang X, Tanus-Santos JE, Reiter CD, et al. Biological activity of nitric oxide in the plasmatic compartment. Proc Natl Acad Sci USA. 2004;101:11477–11482. doi: 10.1073/pnas.0402201101. [DOI] [PMC free article] [PubMed] [Google Scholar]
- 50.Hosmer D, Lemeshow S. Applied Survival Analysis. John Wiley & Sons; New York City: 1999. [Google Scholar]
- 51.Hebbel RP, Osarogiagbon KD. The endothelial biology of sickle cell disease: Inflammation and a chronic vasculopathy. Microcirculation. 2004;11:129–151. [PubMed] [Google Scholar]
- 52.Jison ML, Munson PJ, Barb JJ, et al. Blood mononuclear cell gene expression profiles characterize the oxidant, hemolytic, and inflammatory stress of sickle cell disease. Blood. 2004;104:270–280. doi: 10.1182/blood-2003-08-2760. [DOI] [PMC free article] [PubMed] [Google Scholar]
- 53.Belfiore F. Enzymatic activities of the blood serum in thalassemia and in thalassodrepanocytosis. Riforma Med. 1964;78:1052–1055. [PubMed] [Google Scholar]
- 54.Reynolds J, Follette JH, Valentine WH. The arginase activity of erythrocytes and leukocytes with particular reference to pernicious anemia and thalassemia major. J Lab Clin Med. 1957;50:78–92. [PubMed] [Google Scholar]
- 55.Raghupathy R, Haider MZ, Azizieh F, Abdelsalam R, D'Souza TM, Adekile AD. Th1 and Th2 cytokine profiles in sickle cell disease. Acta Haematol. 2000;103:197–202. doi: 10.1159/000041049. [DOI] [PubMed] [Google Scholar]
- 56.Meurs H, McKay S, Maarsingh H, et al. Increased arginase activity underlies allergen-induced deficiency of cNOS-dervied nitric oxide and airway hyperresponsiveness. Br J Pharmacol. 2002;136:391–398. doi: 10.1038/sj.bjp.0704725. [DOI] [PMC free article] [PubMed] [Google Scholar]
- 57.Meurs H, Maarsingh H, Zaagsma J. Arginase and asthma: novel insights into nitric oxide homeostatis and airway hyperresponsiveness. Trends Pharmacol Sci. 2003;24:450–455. doi: 10.1016/S0165-6147(03)00227-X. [DOI] [PubMed] [Google Scholar]
- 58.Morris CR, Poljakovic M, Lavrisha L, Machado L, Kuypers FA, Morris SM., Jr Decreased arginine bioavailability and increased serum arginase activity in asthma. Am J Respir Crit Care Med. 2004;170:148–153. doi: 10.1164/rccm.200309-1304OC. [DOI] [PubMed] [Google Scholar]
- 59.Zimmermann N, King NE, Laporte J, et al. Dissection of experimental asthma with DNA microarray analysis identifies arginase in asthma pathogenesis. J Clin Invest. 2003;111:1863–1874. doi: 10.1172/JCI17912. [DOI] [PMC free article] [PubMed] [Google Scholar]
- 60.Komai M, Tanaka H, Masuda T, et al. Role of Th2 responses in the development of allergen-induced airway remodeling in a murine model of allergic asthma. Br J Pharmacol. 2003;138:912–920. doi: 10.1038/sj.bjp.0705105. [DOI] [PMC free article] [PubMed] [Google Scholar]
- 61.Chung KF, Barnes PJ. Cytokines in asthma. Thorax. 1999;54:825–857. doi: 10.1136/thx.54.9.825. [DOI] [PMC free article] [PubMed] [Google Scholar]
- 62.Leong MA, Dampier C, Varlotta L, Allen JL. Airway hyperreactivity in children with sickle cell disease. Journal of Pediatrics. 1997;131:278–283. doi: 10.1016/s0022-3476(97)70166-5. [DOI] [PubMed] [Google Scholar]
- 63.Koumbourlis A, Zar H, Hurlet-Jensen A, Goldberg M. Prevalence and reversibility of lower airway obstruction in children with sickle cell disease. J Pediatr. 2001;138:188–192. doi: 10.1067/mpd.2001.111824. [DOI] [PubMed] [Google Scholar]
- 64.Solovey A, Lin Y, Browne P, Choong S, Wayner E, Hebbel RP. Circulating activated endothelial cells in sickle cell anemia. N Engl J Med. 1997;337(22):1584–1590. doi: 10.1056/NEJM199711273372203. [DOI] [PubMed] [Google Scholar]
- 65.Solovey A, Gui L, Key NS, Hebbel RP. Tissue factor expression by endothelial cells in sickle cell anemia. J Clin Invest. 1998;101(9):1899–1904. doi: 10.1172/JCI1932. [DOI] [PMC free article] [PubMed] [Google Scholar]
- 66.Matsui NM, Borsig L, Rosen SD, Yaghmai M, Varki A, Embury SH. P-selectin mediates the adhesion of sickle erythrocytes to the endothelium. Blood. 2001;98:1955–1962. doi: 10.1182/blood.v98.6.1955. [DOI] [PubMed] [Google Scholar]
- 67.Embury SH, Matsuei NM, Ramanujam S, et al. The contribution of endothelial cell P-selectin to the microvascular flow of mouse sickle erythrocytes in vivo. Blood. 2004;104:3378–3385. doi: 10.1182/blood-2004-02-0713. [DOI] [PubMed] [Google Scholar]
- 68.Wood K, Russell J, Hebbel RP, Grange DN. Differential expression of E- and Pselectin in the microvasculature of sickle cell transgenic mice. Microcirculation. 2004;11:377–385. doi: 10.1080/10739680490437559. [DOI] [PubMed] [Google Scholar]
- 69.Mansoor MA, Seljeflot I, Arnesen H, et al. Endothelial cell adhesion molecules in healthy adults during acute hyperhomocysteinemia and mild hypertriglyceridemia. Clin Biochem. 2004;37:408–414. doi: 10.1016/j.clinbiochem.2004.01.003. [DOI] [PubMed] [Google Scholar]
- 70.Maggi FM, Raselli S, Grigore L, Redaelli L, Fantappie S, Catapano AL. Lipoprotein remnants and endothelial dysfunction in the postprandial phase. J Clin Endocrinol Metab. 2004;89:2946–2950. doi: 10.1210/jc.2003-031977. [DOI] [PubMed] [Google Scholar]
- 71.Marchesi S, Lupattelli G, Lombardini R, et al. Effects of fenofibrate on endothelial function and cell adhesion molecules during post-prandial lipemia in hypertriglyceridemia. J Clin Pharm Ther. 2003;28:419–424. doi: 10.1046/j.0269-4727.2003.00512.x. [DOI] [PubMed] [Google Scholar]
- 72.Shores J, Peterson J, VanderJagt D, Glew RH. Reduced cholesterol levels in African-American adults with sickle cell disease. J Natl Med Assoc. 2003;95:813–817. [PMC free article] [PubMed] [Google Scholar]
- 73.Grunfeld C, Feingold KR. Regulation of lipid metabolism by cytokines during host defense. Nutrition. 1996;12:S24–S26. doi: 10.1016/0899-9007(96)90013-1. [DOI] [PubMed] [Google Scholar]
- 74.Pathare A, Kindi SA, Daar S, Dennison D. Cytokines in sickle cell disease. Hematology. 2003;8:329–337. doi: 10.1080/10245330310001604719. [DOI] [PubMed] [Google Scholar]
- 75.Schnog JB, Jager EH, van der Dijs FP, et al. Evidence for a metabolic shift of arginine metabolism in sickle cell disease. Ann Hematol. 2004;83:371–375. doi: 10.1007/s00277-004-0856-9. [DOI] [PubMed] [Google Scholar]