

Abstract
We have developed a method to use low-intensity focused ultrasound pulses combined with an ultrasound contrast agent to produce temporary blood-brain barrier disruption (BBBD). This method could provide a means for the targeted delivery of drugs or imaging agents into the brain. All of our previous work used Optison® as the ultrasound contrast agent. The purpose of this work was to test the feasibility of using the contrast agent Definity® for BBBD. Thirty-six non-overlapping locations were sonicated through a craniotomy in experiments in the brains of nine rabbits (4 locations per rabbit; US frequency: 0.69MHz, burst: 10ms, PRF: 1Hz, duration: 20s). The peak negative pressure amplitude ranged from 0.2-1.5 MPa. Eleven additional locations were sonicated using Optison® at a pressure amplitude of 0.5 MPa. Definity® and Optison® dosages were those used clinically for ultrasound imaging: 10 and 50 μl/kg, respectively. The probability for BBBD (determined using MRI contrast agent enhancement) as a function of pressure amplitude was similar to that found earlier with Optison®. For both agents, the probability was estimated to be 50% at 0.4 MPa using probit regression. Histological examination revealed small isolated areas of extravasated erythrocytes in some locations. At 0.8 MPa and above, this extravasation was sometimes accompanied by tiny (dimensions of 100 μm or less) regions of damaged brain parenchyma. The magnitude of the BBBD was larger with Optison® than with Definity® at 0.5 MPa (signal enhancement: 13.3 ± 4.4% vs. 8.4 ± 4.9%, P=0.04), and more areas with extravasated erythrocytes were observed with Optison® (5.0 ± 3.5 vs. 1.4 ± 1.9 areas with extravasation in histology section with largest effect; P=0.03). We conclude that BBBD is possible using Definity® for the dosage of contrast agent and the acoustic parameters tested in this study. While the probability for BBBD as a function of pressure amplitude and the type of acute tissue effects were similar to what has been observed with Optison®, under these experimental conditions, Optison® produced a larger effect for the same acoustic pressure amplitude.
Introduction
Several recent papers have tested low-intensity focused ultrasound pulses combined with an ultrasound contrast agent in animals as a method to locally and temporarily disrupt of the blood-brain barrier (BBB) (Hynynen et al. 2001; Sheikov et al. 2004; Hynynen et al. 2005; McDannold et al. 2005; Treat et al. 2005; McDannold et al. 2006; Hynynen et al. 2006; Kinoshita et al. 2006b; Raymond et al. 2006). As the BBB is a major obstacle to the delivery of many therapeutic and imaging agents (Abbott and Romero 1996), such a method could be used to facilitate targeted drug delivery in the brain. Other strategies that have been tested for getting drugs past the BBB include designing drugs or drug carriers that can outwit the barrier (Pardridge 2002), directly infusing agents to the brain tissue (Bobo et al. 1994), implanting devices to deliver agents (Guerin et al. 2004), and introducing a catheter into an arterial branch and infusing a hyperosmotic solution or other agent to produce diffuse disruption of the BBB (Doolittle et al. 2000; Neuwelt et al. 1979). The use of focused ultrasound offers several potential advantages over these strategies, as it can be applied non-invasively, it will not require the development of new drugs or drug carriers, and it can be applied to a targeted location – or potentially to a large area or even the whole brain via beam steering if desired.
Previous tests of this method have used Optison®, a commercially available ultrasound contrast agent developed for ultrasound imaging that consists of preformed bubbles with an albumin shell. These studies have shown that the BBB disruption (BBBD) lasts for a few hours (Hynynen et al. 2001; Hynynen et al. 2005; Hynynen et al. 2006) and can be reliably applied with negligible damage to the brain parenchyma (Hynynen et al. 2001; Hynynen et al. 2005; McDannold et al. 2005; Hynynen et al. 2006), at least when compared to invasive techniques. Studies have also shown that the BBBD can be performed using low ultrasound frequencies (0.26 MHz and 0.69 MHz) suitable for trans-cranial application with a focused beam (Hynynen et al. 2005; Hynynen et al. 2006), and that delivery of chemotherapy (Treat et al. 2005) and antibodies can be achieved (Kinoshita et al. 2006b; Kinoshita et al. 2006a).
The purpose of this work was to test the feasibility of producing ultrasound-induced BBBD using a different ultrasound contrast agent, Definity®, and to compare the acute effects produced in the brain in histology to that produced by Optison®. The comparison was made using the same acoustic parameters and used dosages of the two agents approved for clinical use in ultrasound imaging. This work was necessary because the behavior of preformed microbubbles in an ultrasound field may depend on differences in the bubble properties, such as the shell material and size distribution. It will also be important that this is not tied to a single agent if it is to be used clinically.
Methods
Animals
Our institutional animal committee approved the experiments. Sonications were targeted one cm deep at two non-overlapping locations in each hemisphere of the brains of male New Zealand white rabbits (weight: approximately 4 kg). The targets were in the thalamus approximately 3 mm lateral to the midline. The animals were anesthetized with a mixture of 12 mg of sodium xylazine (Xyla-ject; Phoenix Pharmaceuticals, St Joseph, MO, USA) and 48 mg of ketamine hydrochloride (Abbott Laboratories, North Chicago, IL, USA) per kg of body weight per hour. Although BBBD can be achieved using sonication through an intact skull (Hynynen et al. 2005; Hynynen et al. 2006) we selected not to perform the ultrasound exposures trans-cranially to reduce the uncertainty of the ultrasound exposure estimates in the brain. Therefore a craniotomy (approximately 2×2 cm) was performed at least two weeks before the experiments. The skin over the craniotomy was sutured and allowed to heal completely before the experiments. The craniotomy permitted accurate estimation of the acoustic pressure amplitude in the brain. Before the experiments, the fur on the skin above the craniotomy was removed with hair clippers and depilatory lotion.
Nine animals were used in the experiments with Definity® (36 locations); six animals were used with Optison® (11 locations). The additional 13 locations in these animals that were not included were sonicated for a future study that will test the magnitude of the BBBD and tissue effects resulting from sonication with Optison® with different acoustic parameters. As these other sonications did not overlap with those used in the present study and the resulting tissue effects did not include major tissue damage, we assumed that they did not interfere with our results.
Ultrasound
An air-backed spherically curved transducer (frequency: 690 kHz; diameter/radius of curvature: 10/8 cm) generated the ultrasound beam. The transducer was driven by a function generator (Model 395, Wavetek, San Diego, CA, USA) and RF amplifier (model 240L, ENI Inc, Rochester, NY, USA).The electrical power was measured with a power meter (model 438A, Hewlett Packard, Palo Alto, CA, USA) and dual directional coupler (model C173, Werlatone, Brewster, NY, USA). The electrical impedance of the transducer was matched to the output impedance of the amplifier by an external matching network.
The transducer was characterized as described elsewhere (Hynynen et al. 1997). Pressure measurements were performed in degassed, deionized water with a calibrated membrane hydrophone (spot diameter 0.5 mm, GEC-Marconi Research Center, Chelmsford, England) for the entire pressure amplitude range used. Pressure amplitudes reported here are estimates in the brain after taking into account ultrasound attenuation through 10 mm of brain, with a mean attenuation coefficient of 5 Np/m/MHz (0.43 dB/cm/MHz) at 690 kHz (Goss et al. 1978). The half intensity beam diameter and length of the focal spot measured in a water tank with a needle hydrophone (spot diameter 0.2 mm, Precision Acoustics, Dorchester, UK) were 2.3 and 14 mm, respectively.
The sonications consisted of twenty 10 ms pulses at a repetition frequency of 1 Hz. Acoustic powers of 0.04, 0.08, 0.16, 0.40, 0.80, and 1.6 W were tested (time averaged power: 4 – 160 mW), corresponding to peak negative pressure amplitudes of 0.2, 0.4, 0.5, 0.8, 1.1, and 1.5 MPa, respectively (estimate in the brain). These pressure amplitudes corresponded to a spatial peak temporal peak intensities of 1.2, 4.8, 7.5, 19.2, 36.3, and 67.5 W/cm2 (estimated by dividing the square of the pressure amplitude estimates by 2ρc, using 1060 kg/m3 and 1572 m/s for the density (ρ) and sound speed (c) in brain, respectively). Four to eight locations were tested for each exposure level. A pressure amplitude of 0.5 MPa was used for the locations sonicated with Optison®. This pressure amplitude was chosen based on previous work with Optison® at this ultrasound frequency that found consistent BBBD with negligible effects to the brain parenchyma (Hynynen et al. 2005).
The ultrasound contrast agents used were Optison® (GE Healthcare, Milwaukee, WI, USA) and Definity® (Bristol-Myers Squibb Medical Imaging, N. Billerica, MA, USA). The agents were injected intravenously through the ear vein 10 s before the start of each sonication. The Definity® dosage was 10 μl per kg of body weight, which is recommended by the manufacturer for clinical use. The Optison® dosage was 50 μl per kg of body weight, which is in the range (0.5–5.0 ml; i.e, 7.1-71 μm/kg for a 70 kg adult) recommended for human use. These agents consist of pre-formed bubbles that are either lipid (Definity®) or human serum albumin (Optison®) shells filled with the perfluorocarbon gas Perflutren. Properties of these agents are listed in Table 1. The contrast agent injection was followed by an injection of approximately 2 ml saline, which served to flush the agent from an access line that extended out of the MRI bore. A delay between sonications of at least five min allowed the bubbles to mostly clear from the c irculation.
Table 1.
Properties of Definity® and Optison® as described by the manufacturers and the dosages used in this study.
| Definity® | Optison® | |
|---|---|---|
| Mean bubble diameter (μm) | 1.1 – 3.3 | 2.0 – 4.5 |
| % less than 10μm | 98% | 95% |
| Maximum bubble diameter (μm) | 20 | 32 |
| Bubble concentration (bubbles/ml) | 1.2 × 10¹⁰ | 5–8 × 10⁸ |
| Half-life (min) | 1.9* | 1.3 ± 0.69† |
| Dosage (μl/kg) | 10 | 50 |
| in vivo bubble concentration (bubbles/kg) | 1.2 × 10⁸ | 2.5-4.0 × 10⁷ |
Half-life of Perflutren gas in blood
Pulmonary elimination half-life of Perflutren gas
Experimental setup
The transducer was mounted in a three axis manual positioning system and submerged in a tank of degassed, deionized water. The animal lay supine on a tray that was placed above this tank. A thin plastic bag filled with degassed water provided acoustic coupling between the transducer and the skin on the head of the animal. The experiments were performed in a clinical 1.5T MRI scanner (GE Healthcare, Milwaukee, WI, USA). A receive-only MRI surface coil (7.6 mm diameter, GE Healthcare, Milwaukee, WI, USA) was placed below the head.
MRI
The target locations were selected using multiplanar T2-weighted fast spin echo images (parameters: repetition time/echo time (TR/TE): 2000/85 ms; echo train length (ETL): 8; matrix size: 256×256; field of view (FOV): 10 cm; slice thickness: 1.5 mm; number of excitations (NEX): 2). The craniotomy was delineated in these images to ensure that the ultrasound beam was not clipped. T1-weighted fast spin echo images were acquired in axial planes after the sonications (parameters: TR/TE: 500/15-23 ms; ETL: 4; BW: 16 kHz; matrix size: 256×256; NEX: 4; FOV: 10 cm; slice thickness: 1.5 mm; interslice spacing: 1.5 mm). This imaging was repeated after an I.V. bolus injection of MR contrast agent to detect BBBD (Magnevist®, Berlex Laboratories, Inc., Wayne, NJ, USA) at a dose of 0.125 mmol per kg of body weight. The axial imaging was repeated 7-10 times, and then images in other orientations were acquired. In six of the animals testing Definity®, axial T2-weighted fast spin echo imaging was repeated after the contrast-enhanced imaging. This imaging was not performed in the other animals due to time constraints.
Histology
The animals were sacrificed 4h after sonication. The brains were fixed by transcardial perfusion (0.9%NaCl-250 ml, 10% buffered formalin phosphate −500 ml) followed by immersion fixation (10% buffered formalin phosphate). The brains were then embedded in paraffin and serially sectioned at 5 micrometers. Every 50th section (interval of 250 micrometers) was stained with hematoxylin and eosin (H&E) for histologic evaluation. For each targeted location, the section that showed the largest tissue effects was identified and the number of small areas with extravasated erythrocytes were then counted. For each location, an area with diameter of about 2-3 mm was examined for these extravasations. The locations were also given a score, which was the same as was defined in a previous study that used Optison® under the same experimental conditions (Hynynen et al. 2005). Briefly, locations where no changes were detected were given a score of zero; locations with only a few (1-5) extravasated erythrocytes were given a score of one; locations with more areas containing extravasated erythrocytes (more than five) and tiny areas with damage to the brain parenchyma were given a score of two; more extensive damage – hemorrhagic or non-hemorrhagic local lesions – were given a score of three. One author (NV) who was blind to the acoustic parameters used performed the histology examination.
Data Analysis
The signal intensity enhancement was found by calculating the percent change in image intensity in the T1-weighted imaging acquired after MRI contrast injection in a 3×3 voxel region of interest at the sonication target. The percent change in a 5×5 voxel non-sonicated region was subtracted from this value to exclude any enhancement due to contrast in the vasculature. The locations were characterized as having BBBD when the mean percent change was greater than the standard deviation of this larger control region. Comparisons of the average signal intensity enhancement and the number of areas containing extravasated erythrocytes for locations sonicated at 0.5 MPa with Definity® (N=7) and Optison® (N=11) were made using an unpaired student's t-test. The probability for BBBD as a function of pressure amplitude with Definity® was compared to that estimated for Optison® using the data combined here at 0.5 MPa with that obtained previously under identical experimental conditions (Hynynen et al. 2005). This probability was estimated as a function of pressure amplitude using probit analysis, a regression model for the analysis of categorical data often used for bioassay work (Finney 1971). From this estimate, the value where the probability for BBBD was 50% was found. All data analysis was performed by one author (NM) using software written in Matlab (version 6.1, Mathworks, Natick, MA, USA).
Results
In the contrast-enhanced MRI, blood-brain barrier disruption was observed as focal regions with signal intensity enhancement at the target locations (Figure 1). Plots of the probability for BBBD as a function of pressure amplitude were similar for Definity® and Optison® (Figure 2), based on the results obtained here at 0.5 MPa combined with previous work obtained over a range of pressure amplitudes (Hynynen et al. 2005). At 0.4 MPa, four of eight (50%) sonications resulted in contrast enhancement; at 0.8 MPa, six of six (100%) locations demonstrated BBBD. From the probit regression, the pressure amplitudes where the probability for BBBD was 50% were estimated to be 0.4 MPa for both agents. As the pressure amplitude increased, the magnitude of the signal intensity enhancement in MRI increased (Figure 3).
Figure 1.

MR image showing the signal intensity increase due to localized BBBD produced by focused ultrasound pulses combined with Definity® in the rabbit brain at four locations. The signal intensity increase was created from contrast-enhanced T1-weighted images normalized to a T1-weighted image acquired before baseline. The peak rarefactional pressure amplitude (estimated in brain) was 0.2, 1.1, 0.4, and 0.8 MPa for locations 1-4, respectively.
Figure 2.

Probability for BBBD for the six pressure amplitudes tested for Definity® and Optison®. The Optison® data consists of the data from this study (at 0.50 MPa) and data from a previously published study ((Hynynen et al. 2005)).
Figure 3.

a): Signal intensity enhancement – measured in contrast-enhanced T1-weighted images – for the six pressure amplitudes tested using Definity. The enhancement for Optison® after sonication at a pressure amplitude of 0.5 MPa is also shown. Mean values (± S.D.) of enhancement at all of the locations at each pressure amplitude are shown.
In histology, in many locations, a few small areas (dimensions of 100 μm or less) were found with extravasated erythrocytes. For locations where more than 20 areas with extravasation were found, some of these areas had dimensions as large as 200 μm. The number of these areas increased on average as the pressure amplitude increased (Table 2). Occasionally, tiny areas with minor damage to the brain parenchyma were observed, which sometimes included individual damaged neurons. The percentage of cases with such effects (score of two) also increased as a function of pressure amplitude (Table 2). Examples of the histological findings are shown in Figure 4. No locations were observed with contiguous regions of necrosis, as were found at higher pressure amplitudes in a previous study using Optison® at 0.69 MHz (Hynynen et al. 2005). In the six locations sonicated with Definity® where 20 or more areas containing extravasated erythrocytes were found, mild edema was also evident as slightly hyperintense regions in T2-weighted imaging. No edema was evident in the other 18 sonicated locations where T2-weighted imaging was acquired after sonication.
Table 2.
Number of locations with different numbers of areas with extravasated erythrocytes and with different histology scores
| Pressure Amplitude (MPa) |
Contrast Agent |
N Areas with Extravasated Erythrocytes1 | Histology Score2 | ||||||
|---|---|---|---|---|---|---|---|---|---|
| N = 0 | N=1-5 | N=6-10 | N=11-15 | N ≥20 | 0 | 1 | 2 | ||
| 0.2 | Definity® | 6 | 0 | 0 | 0 | 0 | 6 | 0 | 0 |
| 0.4 | Definity® | 6 | 2 | 0 | 0 | 0 | 6 | 2 | 0 |
| 0.5 | Definity® | 3 | 4 | 0 | 0 | 0 | 4 | 3 | 0 |
| 0.5 | Optison® | 0 | 7 | 3 | 1 | 0 | 0 | 8 | 3 |
| 0.8 | Definity® | 0 | 5 | 0 | 0 | 1 | 0 | 5 | 1 |
| 1.1 | Definity® | 0 | 1 | 1 | 1 | 2 | 0 | 1 | 4 |
| 1.5 | Definity® | 0 | 0 | 1 | 0 | 3 | 0 | 0 | 4 |
Counted in histology section with largest effect
Score defined in (Hynynen et al. 2005); see text for details
Figure 4.
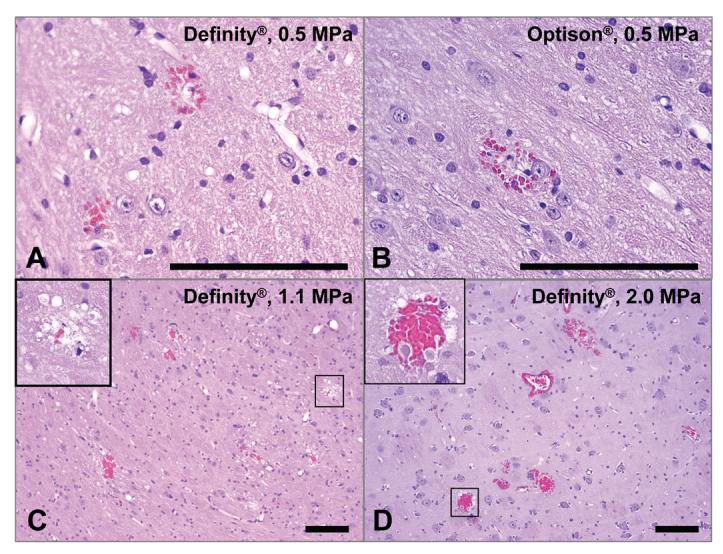
Microphotographs of H&E sections for four sonicated locations with BBBD produced with focused ultrasound combined with Definity® or Optison®. a) – b): histology score = 1; only three areas with extravasated erythrocytes were found in each of these examples. c): histology score = 2; twelve areas with extravasation were found in this example, as well as a vacuolated region (inset). d): histology score = 2; more than 20 regions with extravasations were found in this example, as well as damage (inset). In such cases with more than 20 areas with extravasated erythrocytes edema was evident as well in histology and in MRI. Bar: 100 μm.
Locations sonicated with Optison® at 0.5 MPa resulted in more MRI contrast enhancement on average than the locations sonicated with Definity® at the same pressure amplitude (Figure 3). The difference in mean enhancement at this pressure amplitude, 13.3 ± 4.4% vs. 8.4 ± 4.9%, was significant (P=0.04). The locations sonicated with Optison® at 0.5 MPa also resulted in more severe vascular effects on average, as reflected by a larger number of areas with extravasation and an increased histology score (Table 2). The difference in number of areas with extravasated erythrocytes at this pressure amplitude (5.0 ± 3.5 vs. 1.4 ± 1.9) was also significant (P=0.03).
Discussion
The probability for BBBD as a function of pressure amplitude with Definity® was the similar to that found earlier with Optison® at the ultrasound frequency tested in this work (Hynynen et al. 2005). The type of histological effects seen in the brain, a small number of areas containing extravasated erythrocytes and very minor damage to the brain parenchyma and isolated injured neurons, was also consistent with what has been observed with Optison® for all of the ultrasound frequencies tested to date (Hynynen et al. 2001; Hynynen et al. 2005; McDannold et al. 2005; Hynynen et al. 2006). It should be noted, however, that it has been shown that low-level BBBD is possible without any evident tissue effects when a lower ultrasound frequency (260 kHz) is used (Hynynen et al. 2006). The clinical significance of this small damage will have to be gauged with respect to any desired therapy. For example, it appears acceptable in our opinion at least for delivery of anti-cancer drugs to regions surrounding tumors that have intact BBB.
A small but statistically significant difference in the magnitude of the signal intensity enhancement and histological effects was observed between Optison® and Definity® for sonication at 0.5 MPa. While more work should be performed to confirm this difference, these results indicate that Optison® might produce a larger effect for a given ultrasound intensity. As the exact mechanism for the BBBD is not currently known, one can only speculate on the reasons for this difference.
The different responses for the two contrast agents may have been due to differences in the composition of the contrast agent. For example, the lipid shell of Definity® may be more difficult to break than the albumin shell of Optison® (Sonne et al. 2003) resulting in less free bubbles available to interact with the ultrasound beam. Optison® also contains a wider bubble size distribution than Definity®. It could be that larger bubbles closer to the resonant size at the frequency used were thus present in the brain with Optison®, making bubble collapse (inertial cavitation) and vessel damage and extravasation more likely.
A major factor to consider, however, is that the number of bubbles present in the tissue was different for the two agents. From the data supplied by the manufacturer, the concentration of bubbles in vivo for Definity® should have been approximately 3-5 times higher at the dosages used in this study. Since the tissue effects will likely depend on the dosage of contrast agent and the ultrasound parameters, a more comprehensive parametric study will be necessary to fully understand the differences in the two agents. We chose to use the dosage that is currently used clinically for imaging because it has already been accepted as safe for human use.
Previous studies in other tissues have observed, with few exceptions, similar effects when comparing the two agents. For example, Li et al. investigated permeability changes, petechiae, and premature ventricular contractions (PVCs) in the rat heart due to ultrasound pulses with parameters encountered in ultrasound imaging (Li et al. 2004). They found similar bio-effects for the two agents when the numbers of bubbles were similar (although the risk of PVCs appeared slightly lower for Definity®). A study in rats by Chen et al. found no significant difference between these agents on cardiac muscle (Chen et al. 2002). A study by Miller et al. also did not find a significant difference between these agents for membrane damage in phagocytic cells loaded with contrast agent (Miller and Dou 2004). It is difficult to compare our results to these studies, since the present feasibility study only examined a single dosage of contrast agent and one set of acoustic parameters.
In this work, only acute changes produced by the use of Definity® were examined. Further work is necessary to test whether BBBD with this agent produces any long-term effects. Additional studies should be performed to examine the length of time for the BBBD and the dependence of the BBBD magnitude and other tissue effects on the ultrasound frequency or other acoustic parameters for Definity®. Furthermore, delivery of therapeutic agents needs to be tested. However, the similarity in behavior we observed between Optison® and Definity® in this study is encouraging and suggests that these other studies may mimic the results found with Optison®.
This work continues to support our hypothesis that the use of pre-formed bubbles along with focused ultrasound can reliably produce BBBD by restricting the ultrasound-induced effects selectively to the blood vessels. The use of these agents also largely reduces the ultrasound intensities needed for the procedure, allowing for a more practical system. This use of ultrasound combined with an ultrasound contrast agent joins several other similar efforts in drug delivery in other organs (Bednarski et al. 1997; Unger et al. 1997; Greenleaf et al. 1998; Price et al. 1998; Shohet et al. 2000), although it is not known whether the mechanisms for BBBD that we see are the same as for those studies.
In conclusion, this study demonstrated the feasibility of focused-ultrasound induced BBBD using the ultrasound contrast agent Definity®. The type of acute histological effects was similar to that observed with Optison®. While the probability for BBBD as a function of pressure amplitude for the two ultrasound contrast agents was similar for the acoustic parameters and the dosages of agents tested in this study, Optison® appeared to produce larger effects than Definity® when applied at the same pressure amplitude, with respect to the magnitude of the BBBD and the resulting vasculature changes.
Acknowledgements
Support: NIH (R01EB003268, R33EB000705, U41RR019703). The authors thank Yongzhi Zhang for his help with these experiments.
Footnotes
Publisher's Disclaimer: This is a PDF file of an unedited manuscript that has been accepted for publication. As a service to our customers we are providing this early version of the manuscript. The manuscript will undergo copyediting, typesetting, and review of the resulting proof before it is published in its final citable form. Please note that during the production process errors may be discovered which could affect the content, and all legal disclaimers that apply to the journal pertain.
Reference List
- Abbott NJ, Romero IA. Transporting therapeutics across the blood-brain barrier. Mol Med Today. 1996;2:106–113. doi: 10.1016/1357-4310(96)88720-x. [DOI] [PubMed] [Google Scholar]
- Bednarski MD, Lee JW, Callstrom MR, Li KC. In vivo target-specific delivery of macromolecular agents with MR- guided focused ultrasound. Radiology. 1997;204:263–268. doi: 10.1148/radiology.204.1.9205257. [DOI] [PubMed] [Google Scholar]
- Bobo RH, Laske DW, Akbasak A, Morrison PF, Dedrick RL, Oldfield EH. Convection-enhanced delivery of macromolecules in the brain. Proc Natl Acad Sci U S A. 1994;91:2076–2080. doi: 10.1073/pnas.91.6.2076. [DOI] [PMC free article] [PubMed] [Google Scholar]
- Chen S, Kroll MH, Shohet RV, Frenkel P, Mayer SA, Grayburn PA. Bioeffects of myocardial contrast microbubble destruction by echocardiography. Echocardiography. 2002;19:495–500. doi: 10.1046/j.1540-8175.2002.00495.x. [DOI] [PubMed] [Google Scholar]
- Doolittle ND, Miner ME, Hall WA, Siegal T, Jerome E, Osztie E, McAllister LD, Bubalo JS, Kraemer DF, Fortin D. Safety and efficacy of a multicenter study using intraarterial chemotherapy in conjunction with osmotic opening of the blood-brain barrier for the treatment of patients with malignant brain tumors. Cancer. 2000;88:637–647. doi: 10.1002/(sici)1097-0142(20000201)88:3<637::aid-cncr22>3.0.co;2-y. others. [DOI] [PubMed] [Google Scholar]
- Finney DJ. Probit Analysis. Cambridge University Press; Cambridge, U.K.: 1971. [Google Scholar]
- Goss SA, Johnston RL, Dunn F. Comprehensive compilation of empirical ultrasonic properties of mammalian tissues. J Acoust Soc Am. 1978;64:423–457. doi: 10.1121/1.382016. [DOI] [PubMed] [Google Scholar]
- Greenleaf WJ, Bolander ME, Sarkar G, Goldring MB, Greenleaf JF. Artificial cavitation nuclei significantly enhance acoustically induced cell transfection. Ultrasound Med Biol. 1998;24:587–595. doi: 10.1016/s0301-5629(98)00003-9. [DOI] [PubMed] [Google Scholar]
- Guerin C, Olivi A, Weingart JD, Lawson HC, Brem H. Recent advances in brain tumor therapy: local intracerebral drug delivery by polymers. Invest New Drugs. 2004;22:27–37. doi: 10.1023/b:drug.0000006172.65135.3e. [DOI] [PubMed] [Google Scholar]
- Hynynen K, McDannold N, Sheikov NA, Jolesz FA, Vykhodtseva N. Local and reversible blood-brain barrier disruption by noninvasive focused ultrasound at frequencies suitable for trans-skull sonications. Neuroimage. 2005;24:12–20. doi: 10.1016/j.neuroimage.2004.06.046. [DOI] [PubMed] [Google Scholar]
- Hynynen K, McDannold N, Vykhodtseva N, Jolesz FA. Noninvasive MR imaging-guided focal opening of the blood-brain barrier in rabbits. Radiology. 2001;220:640–646. doi: 10.1148/radiol.2202001804. [DOI] [PubMed] [Google Scholar]
- Hynynen K, McDannold N, Vykhodtseva N, Raymond S, Weissleder R, Jolesz FA, Sheikov N. Focal disruption of the blood–brain barrier due to 260-kHz ultrasound bursts: a method for molecular imaging and targeted drug delivery. J Neurosurgery. 2006;105:445–454. doi: 10.3171/jns.2006.105.3.445. [DOI] [PubMed] [Google Scholar]
- Hynynen K, Vykhodtseva NI, Chung AH, Sorrentino V, Colucci V, Jolesz FA. Thermal effects of focused ultrasound on the brain: determination with MR imaging. Radiology. 1997;204:247–253. doi: 10.1148/radiology.204.1.9205255. [DOI] [PubMed] [Google Scholar]
- Kinoshita M, McDannold N, Jolesz FA, Hynynen K. Noninvasive localized delivery of Herceptin to the mouse brain by MRI-guided focused ultrasound-induced blood-brain barrier disruption. Proc Natl Acad Sci U S A. 2006a;103:11719–11723. doi: 10.1073/pnas.0604318103. [DOI] [PMC free article] [PubMed] [Google Scholar]
- Kinoshita M, McDannold N, Jolesz FA, Hynynen K. Targeted delivery of antibodies through the blood-brain barrier by MRI-guided focused ultrasound. Biochem Biophys Res Commun. 2006b;340:1085–1090. doi: 10.1016/j.bbrc.2005.12.112. [DOI] [PubMed] [Google Scholar]
- Li P, Armstrong WF, Miller DL. Impact of myocardial contrast echocardiography on vascular permeability: comparison of three different contrast agents. Ultrasound Med Biol. 2004;30:83–91. doi: 10.1016/j.ultrasmedbio.2003.09.004. [DOI] [PubMed] [Google Scholar]
- McDannold N, Tempany CM, Fennessy FM, So MJ, Rybicki FJ, Stewart EA, Jolesz FA, Hynynen K. Uterine leiomyomas: MR imaging-based thermometry and thermal dosimetry during focused ultrasound thermal ablation. Radiology. 2006;240:263–272. doi: 10.1148/radiol.2401050717. [DOI] [PMC free article] [PubMed] [Google Scholar]
- McDannold N, Vykhodtseva N, Raymond S, Jolesz FA, Hynynen K. MRI-guided targeted blood-brain barrier disruption with focused ultrasound: Histological findings in rabbits. Ultrasound Med Biol. 2005;31:1527–1537. doi: 10.1016/j.ultrasmedbio.2005.07.010. [DOI] [PubMed] [Google Scholar]
- Miller DL, Dou C. Membrane damage thresholds for 1- to 10-MHz pulsed ultrasound exposure of phagocytic cells loaded with contrast agent gas bodies in vitro. Ultrasound Med Biol. 2004;30:973–977. doi: 10.1016/j.ultrasmedbio.2004.05.010. [DOI] [PubMed] [Google Scholar]
- Neuwelt EA, Maravilla KR, Frenkel EP, Rapaport SI, Hill SA, Barnett PA. Osmotic blood-brain barrier disruption. Computerized tomographic monitoring of chemotherapeutic agent delivery. J Clin Invest. 1979;64:684–688. doi: 10.1172/JCI109509. [DOI] [PMC free article] [PubMed] [Google Scholar]
- Pardridge WM. Drug and gene delivery to the brain: the vascular route. Neuron. 2002;36:555–558. doi: 10.1016/s0896-6273(02)01054-1. [DOI] [PubMed] [Google Scholar]
- Price RJ, Skyba DM, Kaul S, Skalak TC. Delivery of colloidal particles and red blood cells to tissue through microvessel ruptures created by targeted microbubble destruction with ultrasound. Circulation. 1998;98:1264–1267. doi: 10.1161/01.cir.98.13.1264. [DOI] [PubMed] [Google Scholar]
- Raymond SB, Skoch J, Hynynen K, Bacskai BJ. Multiphoton imaging of ultrasound/Optison mediated cerebrovascular effects in vivo. J Cereb Blood Flow Metab. 2006 doi: 10.1038/sj.jcbfm.9600336. [DOI] [PubMed] [Google Scholar]
- Sheikov N, McDannold N, Vykhodtseva N, Jolesz F, Hynynen K. Cellular mechanisms of the blood-brain barrier opening induced by ultrasound in presence of microbubbles. Ultrasound Med Biol. 2004;30:979–989. doi: 10.1016/j.ultrasmedbio.2004.04.010. [DOI] [PubMed] [Google Scholar]
- Shohet RV, Chen S, Zhou YT, Wang Z, Meidell RS, Unger RH, Grayburn PA. Echocardiographic destruction of albumin microbubbles directs gene delivery to the myocardium. Circulation. 2000;101:2554–2556. doi: 10.1161/01.cir.101.22.2554. [DOI] [PubMed] [Google Scholar]
- Sonne C, Xie F, Lof J, Oberdorfer J, Phillips P, Carr EE, Porter TR. Differences in definity and optison microbubble destruction rates at a similar mechanical index with different real-time perfusion systems. J Am Soc Echocardiogr. 2003;16:1178–1185. doi: 10.1067/j.echo.2003.07.001. [DOI] [PubMed] [Google Scholar]
- Treat L, McDannold N, Vykhodtseva N, Zhang Y, Tam K, Hynynen K. MRI-guided therapeutic focused ultrasound to enhance drug delivery to the brain; Proceedings of the 5th meeting of the International Society on Therapeutic Ultrasound; Boston, MA. 2005. pp. 266–270. [Google Scholar]
- Unger EC, McCreery TP, Sweitzer RH. Ultrasound enhances gene expression of liposomal transfection. Invest Radiol. 1997;32:723–727. doi: 10.1097/00004424-199712000-00001. [DOI] [PubMed] [Google Scholar]