

Abstract
The cAMP response element binding protein (CREB) is a mammalian transcription factor which regulates the expression of many cellular genes. CREB is commonly expressed in E. coli and purified by heat-extraction followed by affinity chromatography. We have discovered that although this purification yields a reasonably pure product which is active in DNA-binding and functional assays, it contains a large amount of nucleic acid as well as CREB truncation products and other polypeptides. Consequently, this CREB is inadequate for use in biophysical studies including crystallography, and spectroscopic analysis such as analytical ultracentrifugation, FRET, and circular dichroism. We revised the purification protocol to incorporate expression in the Rosetta™ host strain, nuclease treatment, and denaturing/high salt size-exclusion chromatography. We typically obtain 10 mg of CREB per liter of culture media that is 99% homogenous, free of nucleic acid, and amenable to biophysical studies. Comparison of CREB from the original and revised protocols shows similar affinities for the cAMP response element (CRE) but small differences in their secondary structures when assayed by limited proteolysis and circular dichroism.
Introduction
The cAMP response element binding protein (CREB) is a widely studied transcription factor which activates a large number of cellular genes containing cAMP response elements (CREs). CREB is expressed in many tissues and regulates a wide range of biological functions including cellular growth, memory, and neuronal proliferation in response to a variety of intracellular signaling events. Several kinases activate CREB, including PKA, which phosphorylates the kinase inducible domain (KID) as serine133 [1]. CREB binds as a dimer to the CRE (5’-TGACGTCA-3’) via its basic leucine zipper (bZIP) domain and recruits the coactivator CREB-binding protein (CBP) or its paralogue, p300, to mediate transcriptional activation. [2–6].
To better understand CREB structure and function, we attempted to perform various biophysical studies with untagged CREB expressed and purified from E. coli. We utilized a conventional purification protocol which incorporates heat-treatment of the cell lysate [7, 8], followed by heparin-Sepharose affinity chromatography. Expression and purification using this protocol generated a CREB product that was approximately 65% pure, and active in a variety of DNA binding assays and in in vitro transcription assays. However, when analyzed by size-exclusion chromatography, this CREB eluted at an unusually large apparent molecular weight as an aggregate. We discovered that the aberrant elution and aggregation was attributable to contaminating nucleic acid that co-purified with CREB via non-specific bZIP interactions. In addition, we observed low molecular weight carboxy-terminal truncation products of CREB that co-eluted due to bZIP heterodimerization as well as other polypeptides.
The tight association of CREB with contaminating nucleic acid and truncation products is detrimental in a variety of assays, including proteolytic analysis, spectroscopic studies, and crystallography. To address these concerns, we developed a revised protocol that incorporates expression in a Rosetta™ host strain and purification by heat-treatment and heparin-Sepharose chromatography in the presence of nucleases, followed by denaturing/high salt size-exclusion chromatography. This revised protocol yields a large amount of soluble CREB protein which is 99% pure and free of contaminating nucleic acid. This highly-purified CREB is active for complex formation with the CRE and the KIX domain of CBP/p300. Analysis by limited proteolysis and circular dichroism, however, highlights the subtle yet significant differences between the two differently purified CREB products.
Material and Methods
CREB Expression
The bacterial expression vector for CREB327 [9] was expressed in E. coli BL21(DE3)pLysS cells (Stratagene, cat. #200132) for the conventional CREB purification and in E. coli Rosetta™ BL21(DE3)pLysS cells (Novagen, cat. #70956-4) for the revised CREB purification. Freshly transformed bacteria were grown in 10 ml of LB (2 cultures) containing ampicillin (100 µg/ml) and chloramphenicol (34 µg/ml) at 37°C overnight. The overnight cultures were expanded into 1L of the same media and cells were grown to an optical density (OD600) of 0.5–0.8. Protein expression was then induced with 0.4 mM IPTG and the culture was grown for 3 hours. The cells were harvested by centrifugation at 2,000g for 30 minutes at 4°C and resuspended in a buffer containing 50 mM Tris-HCl pH 7.9, 12.5 mM MgCl2, 100 mM KCl, and 1 mM EDTA pH 8.0 (15ml per liter of culture media). The resuspended cell pellet was stored at −80°C until use.
CREB Purification- Conventional Protocol
The cell resuspension was heated in 1 ml aliquots to 65°C for 15 min. in the presence of 1 mM PMSF, 8 µg/ml aprotinin, 8 µg/ml leupeptin, and 2 mM DTT. Following heat-treatment, the samples were placed on ice for 10 min. and the above reagents were again added to the same final concentrations. The supernatant containing soluble CREB was recovered by centrifugation at 13,000g for 30 minutes at 4°C and bound to Heparin Sepharose 6 Fast Flow resin (GE Healthcare, cat.#17-0998-01) overnight at 4°C. Unbound sample was collected in the flow-through and the resin was washed with 3 column volumes (CVs) of the resuspension buffer containing 2 mM DTT. Bound sample containing CREB was eluted with 3 CVs of the resuspension buffer containing 600 mM KCl and 2 mM DTT. The CREB eluate was dialyzed overnight at 4°C in a buffer containing 50 mM Tris-HCl pH 7.9, 100 mM KCl, 12.5 mM MgCl2, 1 mM EDTA pH 8.0, 20% glycerol, and 2 mM DTT.
CREB Purification- Revised Protocol
The revised protocol was carried out as described above with the following changes. RNase A (200 µg/ml) was added prior to the heat-treatment. RNase A (100 µg/ml) and DNase 1 (0.025U/µl) were added during the heparin sepharose binding step (RNase A, Sigma, cat. #R4875; DNase I, Roche, cat. #04536282001). The heparin sepharose elution was carried out at room temperature with a denaturing buffer containing 50 mM Na2PO4 pH 8.0, 8 M urea, 1 M NaCl, and 2 mM DTT. The denaturing buffer was always made fresh immediately before use to avoid cyanate accumulation, and further deionization with a mixed bed ion-exchange resin and/or addition of a cyanate scavenger such as 50 mM Tris can be included to avoid protein carbamylation. The eluate was then concentrated and fully exchanged into the denaturing buffer at room temperature using an Amicon Ultra-15 MWCO 10KDa concentrator (Fisher, cat. #UFC901024). The sample was loaded onto a room temperature pre-packed prep-grade HiLoad Superdex 200 HR 16/60 column (GE Healthcare cat. #17-1069-01) that was pre-equilibrated with the denaturing buffer. The column was run at a flow rate of 1.0 ml/min. and 1.5 ml fractions were collected. Absorbance was monitored at 280 nm. Peak fractions containing CREB were pooled and immediately dialyzed at room temperature against 4 liters of a buffer containing 50 mM Na2PO4 pH 8.0, 100 mM NaCl, 1 mM MgCl2, 2 mM DTT with 2 buffer changes. CREB was then dialyzed overnight at 4°C against 4 liters of the above dialysis buffer containing 20% glycerol. Aliquots were stored at −80°C.
Sizing column calibration and apparent molecular weight determination
Low and high molecular weight standards (GE Healthcare, LMW kit cat. #28-4038-41; HMW kit cat. #28-4038-42) were run on a pre-packed prep-grade HiLoad Superdex 200 HR 16/60 column at 4°C. KAV values were determined for each protein standard based on the following equation; KAV = (VR-VO)/(VC-VO) where VR = elution volume, VO = void volume, VC = column volume. KAV values were graphed versus the log of their molecular weights to determine the standard curve. Apparent molecular weights of the indicated column fractions were determined using their elution volumes and the equation obtained from the standards, where KAV = (VR −45.8)/78.2, y = −0.3562x + 1.1041 (y = log MW, x = KAV).
MALDI-TOF molecular weight determination and N-terminal sequencing
Molecular weight determination (MS analysis by MALDI-TOF) and N-terminal sequencing (automated analysis by Edman degradation) were performed at the Macromolecular Resources Core Laboratory of Colorado State University http://macromolecular.colostate.edu.
Electrophoretic mobility shift assays
Protein/DNA complexes were formed by incubating the indicated amounts of CREB protein with a 32P-end labeled double stranded CRE oligonucleotide (0.5 nM) and poly(dA-dT)·poly(dA-dT) (5 ng) for 1 hour on ice in a buffer containing 25 mM Tris pH 7.9, 50 mM KCl, 6.25 mM MgCl2, 0.5 mM EDTA, 10% glycerol, 0.1% Tween-20 and 2 mM DTT. Samples were resolved on a 5% (49:1 w/w acrylamide:bisacrylamide) non-denaturing gel in a buffer containing 40 mM Tris-HCl pH 8.5, 306 mM Tris-glycine and 0.1% Nonidet P-40, and visualized by autoradiography.
Nucleic acid detection
Samples were resolved on a 1% agarose gel in a buffer containing 40 mM Tris-acetate and 10 mM EDTA pH 8.0 then visualized by SYBR® gold nucleic acid gel stain (Molecular Probes, cat #S-11494).
Analytical Gel filtration chromatography of CREB/DNA complexes
CREB/DNA complexes were formed by incubating CREB (10 µM) and a 1.2-fold molar excess of 21 bp CRE oligonucleotide (6 µM) relative to the dimer for 1 hour on ice. Samples (500 µl) were injected onto a pre-packed analytical Superdex 200 10/300 GL size-exclusion column (GE Healthcare, cat. #17-5175-01) pre-equilibrated with buffer containing 10 mM Tris-HCl pH 8.0, 50 mM KCl, 2 mM MgCl2, 5 µM ZnSO4 and 2 mM DTT. The column was run at a flow rate of 0.5 ml/min, and protein/DNA absorbance was monitored at 280 nm. Blue dextran 2,000 and protein molecular mass standards between 14.4 and 669 kDa were used to calibrate the column. The void volume of the column was at approximately 7.8 ml.
Proteolysis
Protein samples were incubated with trypsin at a ratio of 1:100 (w/w, sequencing grade trypsin, Promega, cat #V5111) at 25°C in a buffer containing 50 mM ammonium carbonate pH 7.9 and 10 mM DTT for the times indicated. The reactions were performed with 3.8 µM CREB and a 1.5-fold molar excess of CRE DNA (2.8 µM) relative to the dimer. The reactions containing DNA were preincubated for 30 min. at 30°C prior to the addition of trypsin. At each time point, a volume equivalent to 4 µg of CREB was removed and the reaction was terminated with SDS sample dye and flash-freezing in liquid N2. Proteins were resolved by 10% Tris-Tricine SDS-PAGE and visualized by Coomassie Brilliant Blue staining.
Circular Dichroism Spectroscopy
Purified original CREB, new CREB, and a 21 bp CRE oligonucleotide were each exchanged into 20 mM sodium phosphate pH 8.0, 20 mM NaCl, 1mM MgCl2, and 1 mM TCEP pH 8.0. The protein concentration in each sample was 5 µM and the oligonucleotide concentration was 3 µM, as determined by UV spectrophotometry. Original CREB concentration was measured by the Bradford method due to contaminating nucleic acid absorbance at 276 nm, and confirmed by comparison to new CREB by SDS-PAGE and Coomassie staining. CREB/CRE binding reactions were incubated at 17°C for at least 1 hr prior to scanning. The buffer base line was subtracted from all samples and the CREB/CRE spectra were obtained by subtracting the spectra of the oligonucleotide from the spectra of the complex. Absorbance from the contaminating nucleic acid in the samples containing original CREB could not be subtracted away from raw data and are contributing to the final spectra. CD spectra were collected on a Jasco J-720 spectropolarimeter using a 0.05 cm path length quartz cell at 17°C. All spectra are the average of 15 accumulations measured from 260 nm to 190 nm with the following setup conditions: 1 nm bandwidth, 100 nm/min scan rate, 1 sec time constant, 1 nm step resolution, 50 L/min N2 purge rate. All spectra were normalized to per residue delta epsilon (Δε) units from their per residue molar ellipticity values.
Oligonucleotides
The top-strand sequences of the double-stranded (ds) oligonucleotides (IDT, USA) used in the indicated assays are as follows: Gel filtration and circular dichroism: 5’-CAGGCGTTGACGTCAACCCCT-3’. EMSA probe DNA (used in Fig. 2): 5’-GTCAGGCGTTGACGTCAACCCCTCA. EMSA probe DNA (used in Fig. 7): 5’-AGTTTTTTGAGGTGAGGGGTTGTCGTCAACGCCTGAGGACGGCTTGAC-3’. Proteolysis: 5’-TTCTTGATCCATGACGTCAATTGAGATCTCTCAAATGATCTC-3’. The cyclic-AMP response element (CRE) sites are underlined.
Figure 2. Identification of nucleic acid contamination.
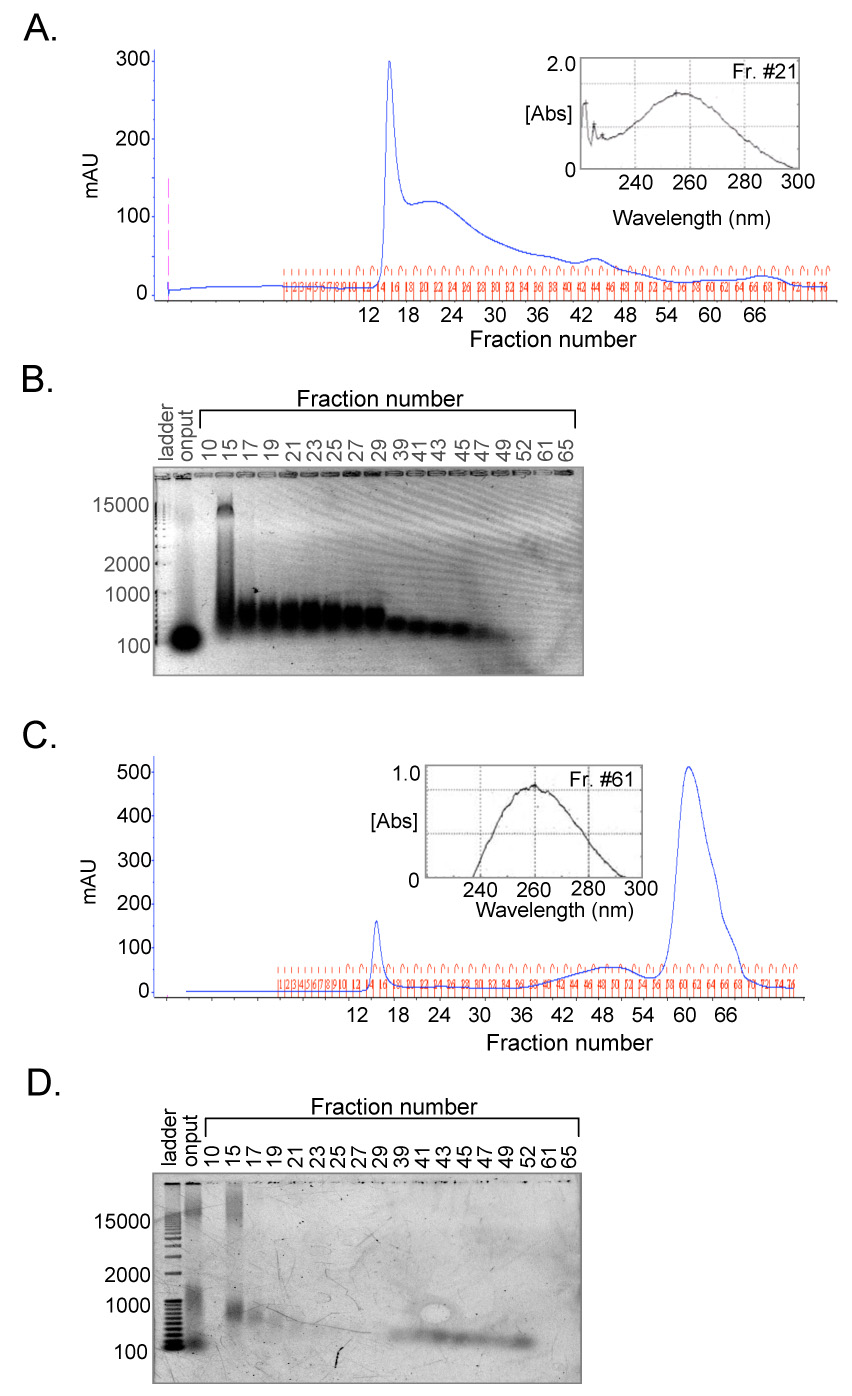
(A.) Elution profile of mock RNase A-treated CREB analyzed by size-exclusion chromatography. CREB (10 nmol in 1 ml) was mock RNase A-treated and loaded onto a prep-grade HiLoad Superdex 200 HR size-exclusion column. Absorbance (mAU) was measured at 280 nm. The peak fraction corresponding to CREB protein was analyzed by UV spectrophotometry (inset). (B.) Nucleic acids co-elute with CREB. Samples (18 µl) of elution fractions from figure 3A were resolved on a 1% agarose gel and visualized by SYBR™ gold staining. (C.) RNase A dramatically shifts the absorbance toward lower molecular weight species. CREB (10 nmol, 1 ml) was treated with RNase A (40 µg/ml) and loaded onto a prep-grade HiLoad Superdex 200 HR size-exclusion column. The new low molecular weight peak fraction was analyzed by UV spectrophotometry (inset). (D.) RNase A decreases the amount of nucleic acid present throughout the elution profile. Samples (18 µl) of elution fractions from figure 3C were resolved on a 1% agarose gel and visualized by SYBR™ gold staining.
Figure 7. Circular dichroism analysis reveals differences between original and new CREB.
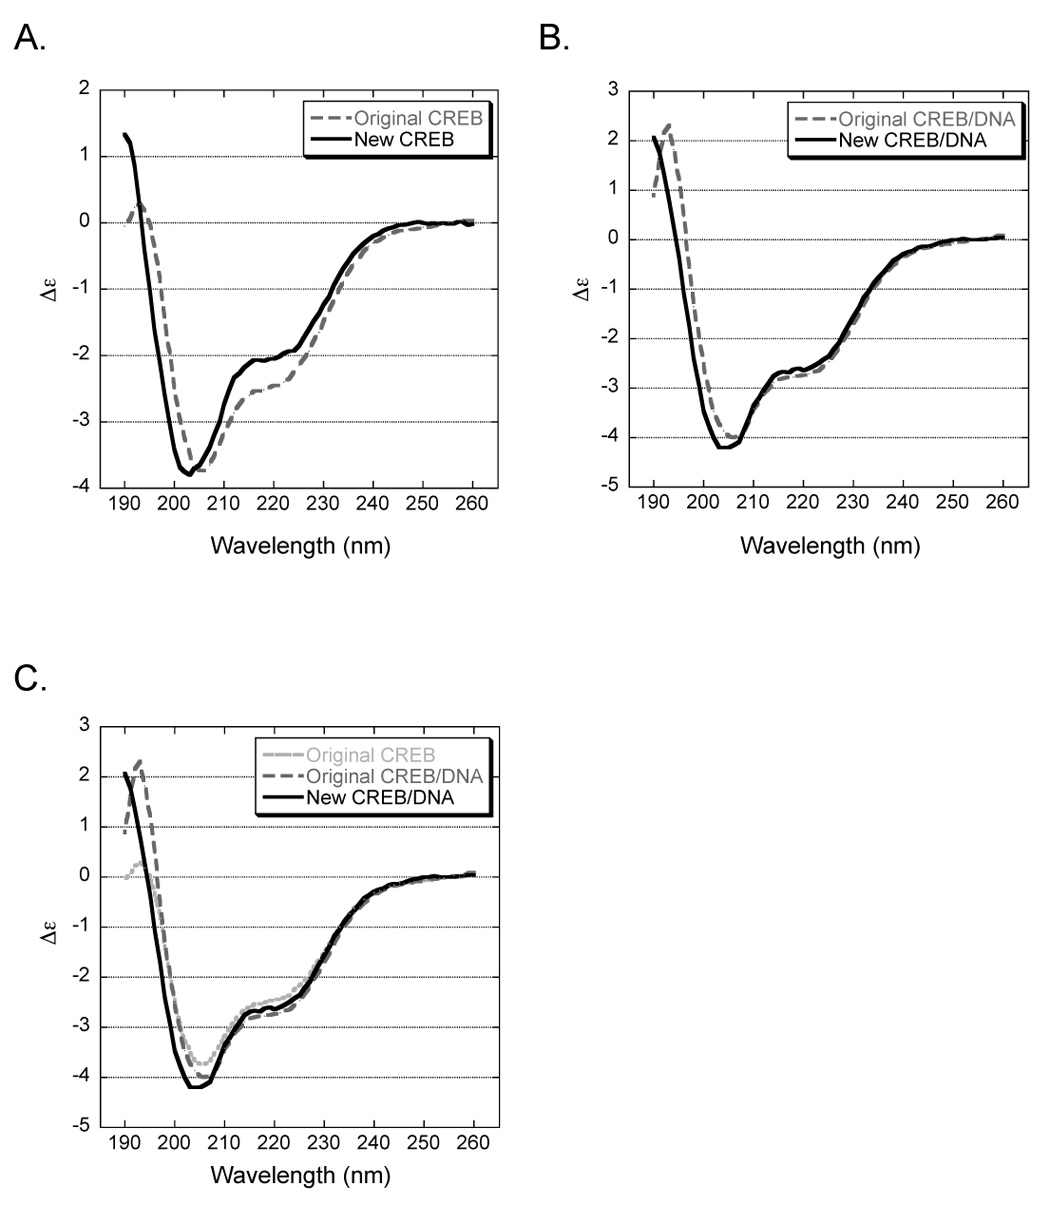
Wavelength (nm) is represented along the x-axis and change in molar per residue ellipticity (Δε) along the y-axis. (A.) Original and new CREB in solution have distinct structures. CD spectra of both CREB proteins (5 µM) were obtained in 20 mM phosphate, 20 mM NaCl, 1mM MgCl2 and 1mM TCEP (pH 8.0) at 17°C (B.) Original and new CREB bound to CRE DNA exhibit more structural similarities. CD spectra of both CREB proteins (5 µM) in complex with CRE DNA (3 µM). The signal from the CRE alone has been subtracted from both spectra. (C.) Original CREB is bound to contaminating nucleic acid. Comparison of original CREB in solution and both CREB proteins bound to the CRE.
Image processing and data reproducibility
SDS-PAGE and agarose gels were imaged using the Kodak EDAS 290 gel analysis system. EMSA gels were visualized by the GE Storm™ PhosphorImager™. Image Quant 5.1 software (Molecular Dynamics) was used to quantify band intensities. Background signal was subtracted from each band quantified. Images were processed in Adobe Photoshop enabling minor adjustments to brightness/contrast as needed. No bands were obscured or altered. Images were annotated in PowerPoint.
Results and Discussion
Conventional CREB expression and purification
For the studies described herein, we use the CREB327 isoform that has similar DNA binding and transcriptional activity as CREB341 [10–12]. This CREB isoform, which lacks the 14 amino acid alpha domain, has a calculated molecular weight of 35,136 Da and runs as a 40 kDa protein on an SDS polyacrylamide gel (Fig. 1B, lane 1). Throughout this manuscript, we refer to CREB327 as CREB.
Figure 1. CREB purification using a conventional protocol.
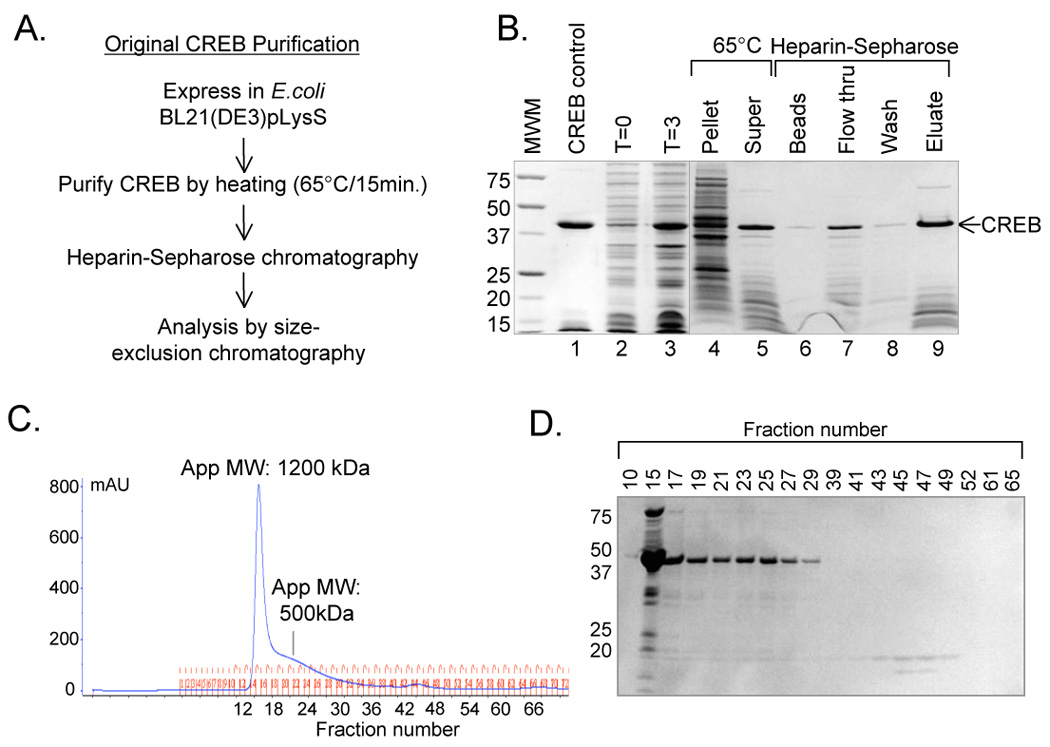
(A.) Schematic representation of the CREB purification protocol. (B.) CREB purification results in low molecular weight protein contaminants. Samples from each step of the purification were resolved on a 10% Tris-Tricine SDS-PAGE and visualized by Coomassie Brilliant Blue Staining. (C.) Elution profile of CREB analyzed by size-exclusion chromatography. CREB (13 nmol in 1 ml) was loaded onto a prep-grade HiLoad Superdex 200 HR column. Absorbance (mAU) was measured at 280 nm and the apparent molecular weight (App MW) of each major peak is noted. (D.) CREB protein is present throughout both major absorbance peaks. Samples (1 ml) of elution fractions from figure 2A were TCA precipitated, resolved on a 10% Tris-Tricine SDS-PAGE, and visualized by Coomassie Brilliant Blue staining.
CREB is frequently expressed in and purified from E. coli. We transformed the construct carrying untagged CREB [9] into this expression vector and induced protein expression to high levels (Fig. 1B, lanes 2, 3). A common first step in the purification protocol is heat treatment of the cell lysate [7, 8]. This step yields significant recovery and purification of CREB, which remains in the heat-soluble fraction (Fig. 1B, lanes 4, 5). Although it is unusual to heat-purify a protein, many studies have demonstrated that CREB retains activity following heat treatment [2, 7, 13–15]. This unique property has been attributed to a lack of significant structure in CREB, which is believed to be partially unfolded in solution [8, 16]. We have traditionally utilized this initial purification step by heating the CREB cell lysate to 65°C for 15 minutes followed by heparin-Sepharose chromatography, as outlined in figure 1A. The purification summary is presented in Table 1. Although the heparin-Sepharose step did not significantly improve CREB purity when analyzed by SDS-PAGE, we reasoned that this step removed heat-soluble cell debris including carbohydrates, lipids, and ribonucleic acids. We found that roughly half of our CREB protein did not bind the heparin-Sepharose resin. Using this method, we generally obtained 10 mg of CREB per liter of culture media, determined by the Bradford method. The product was approximately 65% pure and contained varying amounts of low molecular weight protein contaminants (Fig. 1B, lane 9).
Table 1.
Conventional CREB purification (1L culture media)
| Purification Steps | Total Proteina | CREB Yield Yieldb | CREB Purityb,c |
|---|---|---|---|
| (mg) | (%) | (%) | |
| Heat treatment | 20 | 70 | 65 |
| Heparin-sepharose chromatography | 10 | 40 | 65 |
Total protein was determined by the Bradford method.
CREB yield and purity were assessed by SDS-PAGE and Coomassie staining.
CREB purity does not take into account contaminating nucleic acid.
Size-exclusion chromatography suggests CREB is aggregated
To better characterize our purified CREB protein, we analyzed the heparin-Sepharose eluate by size-exclusion chromatography under native conditions. Molecular weight standards were used to determine approximate molecular weights of various elution fractions and their corresponding elution volumes (Table 2). Unexpectedly, we found that CREB, a 75 kDa dimer in solution, eluted from the HiLoad Superdex 200 column in two contiguous high molecular weight peaks. The first eluted near the void volume as a tight peak of approximately 1200 kDa, while the second eluted as a broad peak of approximately 500 kDa (Fig. 1C). Analysis by SDS-PAGE revealed that the elution of CREB protein correlated with the absorbance profile of the chromatogram. Additionally, a number of proteins co-eluted with CREB, suggesting that these proteins were in complex with CREB (Fig. 1D). Amino-terminal sequencing revealed that three of the lower molecular weight polypeptides were truncations of CREB. The amino-termini of these peptides mapped to amino acids 186, 255 and 277. Based on their size, these polypeptides carried the bZIP domain and thus the ability to dimerize with full-length CREB. The E. coli DNA binding protein HU-alpha (HU-2), and chain T of the E. coli 30S ribosomal subunit were also identified in the CREB-containing fractions. A larger (approximately 75 kDa) band mapped to amino acid 2 in CREB, which would correspond to a dimer of CREB that lacks the methionine start codon.
Table 2.
HiLoad Superdex 200 column elution fractions, volume and corresponding apparent molecular weights.
| Superdex 200 Fraction number | Corresponding Volume (ml) | Corresponding Molecular Weighta (kDa) |
|---|---|---|
| 12 | 41.5 | Void |
| 18 | 50.5 | 722 |
| 24 | 59.5 | 350 |
| 30 | 68.5 | 169 |
| 36 | 77.5 | 82 |
| 42 | 86.5 | 40 |
| 48 | 95.5 | 19 |
| 54 | 104.5 | 9 |
| 60 | 113.5 | 5 |
| 66 | 122.5 | 2 |
We performed electrophoretic mobility shift assays (EMSA) to qualitatively assess the DNA binding activity of proteins eluted the size-exclusion column (data not shown). We found that fractions containing full-length CREB formed a complex that migrated as expected, indicating that the CREB present in the high molecular weight fractions was active. Interestingly, we did not observe more slowly migrating complexes that might be expected from the apparently aggregated CREB protein. We noted the presence of a shifted band just below the CREB/DNA complex that was likely due to CREB/bZIP heterodimer complexes present in the preparation (see Fig. 5A). Importantly, the presence of these complexes in the sizing column eluate further confirmed that CREB carboxy-terminal truncation products co-elute with the full-length protein via interaction at their respective leucine zipper regions in solution.
Figure 5. Both preparations of CREB are competent for sequence-specific DNA binding.
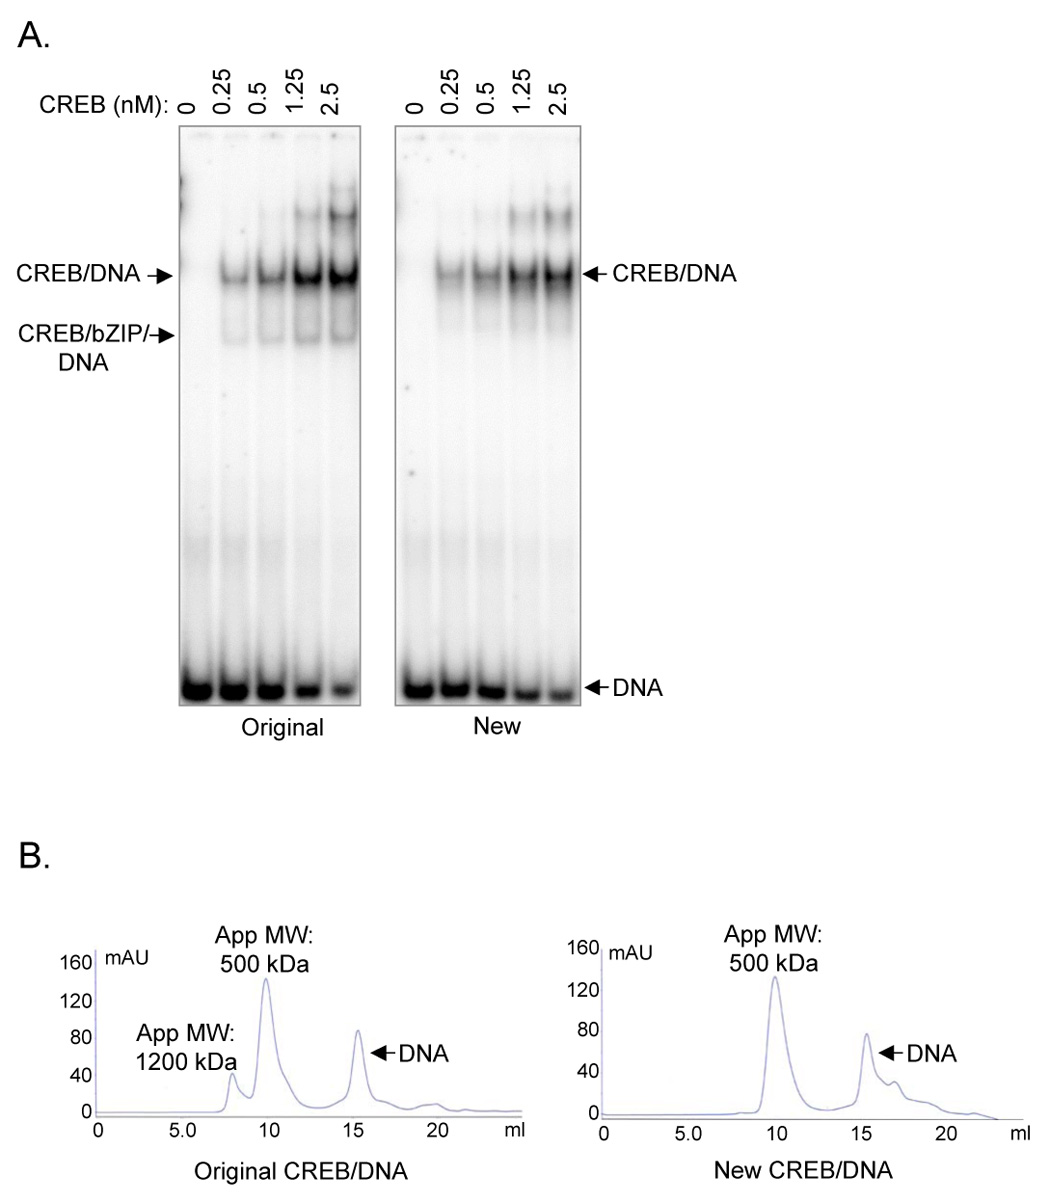
(A.) CREB purified by the conventional and revised protocols have identical DNA-binding activities as assayed by EMSA. Both CREB proteins were incubated with a 32P-labeled 48 bp CRE-containing probe (0.5 nM), as indicated. The samples were resolved by 5% nondenaturing PAGE and analyzed by autoradiography. The slower migrating bands at high CREB concentrations result from the use of a longer probe. (B.) Sequence-specific CRE DNA binding reverses the lattice formed between CREB and nucleic acid. Original CREB/DNA and new CREB/DNA complexes (5 µM) were analyzed by size-exclusion chromatography (analytical Superdex 200 10/300 GL). DNA was added in small excess to drive complex formation, and to serve as an internal marker for the elution profiles.
The elution profile of CREB from the sizing column was unexpected and suggested that the unusually high molecular weight may be due to extensive aggregation of the protein. The CREB bZIP domain contains three cysteine residues which can contribute to disufide bond formation and dimerization under oxidizing conditions. Although CREB was purified in the presence of 2 mM DTT, we observed a small amount of CREB dimer when analyzed by SDS-PAGE (Fig. 2B, fraction 15). Therefore, we considered whether intermolecular disulfide cross-links might contribute to CREB aggregation, and thus the aberrant elution profile. We again purified and analyzed CREB by size-exclusion chromatography in the presence of either 10 mM DTT or 3 mM TCEP and obtained the same elution profiles (data not shown). We also purified and characterized a CREB C → S mutant in which the three cysteines (Cys286, Cys296, and Cys323) were substituted with serine residues. This mutant CREB, which cannot form disulfide bonds, also exhibited an elution profile identical to that of wild type CREB (data not shown). Interestingly, the elution profile of the 8 kDa bZIP domain (CREB254–327) was identical to that of full-length CREB, suggesting that the cause of the aberrant elution profile was linked to a property of bZIP (data not shown).
CREB is contaminated with nucleic acid
CREB327 has an exceptionally low extinction coefficient (10150 M−1 cm−1 @ 276 nm) due to a lack of tryptophan and phenylalanine amino acids and a relatively low tyrosine content. Although the CREB elution profile from the size-exclusion column corresponded to the protein visualized by SDS-PAGE, the absorbance of the CREB eluate was very high and did not correlate with the amount of protein loaded. Additionally, analysis of the peak fractions containing CREB by UV spectrophotometry revealed a peak absorbance near 260 nm (Fig. 2A, inset). This absorbance peak lead us to consider whether the purified CREB protein was contaminated with endogenous nucleic acid from E. coli. The high number of basic amino acids within the bZIP domain would be predicted to tightly associate, albeit non-specifically, with both DNA and RNA.
To investigate possible nucleic acid contamination, we treated a 10 nmol sample with RNase A and “mock” treated a second identical sample. Both samples were analyzed in parallel by size-exclusion chromatography followed with SYBR® gold gel staining of individual column fractions. (Fig. 2). SYBR® gold detects both single and double-stranded nucleic acid with high sensitivity. In the mock-treated sample, we detected significant amounts of low molecular weight nucleic acid that appeared to be primarily tRNA, as it co-migrated with the 100 bp DNA marker (Fig. 2B). Notably, a significant amount of the nucleic acid co-eluted with CREB and ran as a broad, slightly shifted band suggesting that it existed in a stable complex with the protein (compare Fig. 2B and 1D). RNase A treatment dramatically shifted the majority of the absorbance on the chromatogram to a peak at fraction 61, a volume at which the smallest molecules elute from the size-exclusion column (Fig. 2C and 2D). Analysis of this fraction by UV spectrophotometry revealed a classic pure nucleic acid peak with absorbance at 260 nm, consistent with the presence of short RNAs generated by RNase digestion (Fig. 2C, inset). The nucleic acid in these fractions migrated off the agarose gel, and thus was not detected in the assay.
Interestingly, RNase A treatment did not completely remove the nucleic acid, as a residual peak at fraction 15 remained following treatment. This suggested that the RNA was tightly bound within CREB and the truncation products, thus protecting it from complete digestion and liberation. It is also possible that the remaining nucleic acid may have been DNA, which would not have been digested and removed by RNase. Treatment with RNase A caused a portion of the CREB protein to precipitate, suggesting that the nucleic acid contaminants may contribute to the stability of CREB. We did not observe the emergence of a CREB peak following the RNase A treatment, likely due to the small amount of protein loaded onto the column and the low extinction coefficient of CREB. From these data, we hypothesized that CREB, in complex with contaminating nucleic acid via the bZIP domain, forms an extended high molecular weight lattice. This lattice results from multiple CREB dimers and heterodimers bound randomly at several sites on a given tRNA or other nucleic acid molecule.
Revised protocol for CREB purification
Considering that our purified CREB possessed truncated products and a significant amount of nucleic acid, we revised both the expression and purification protocols to eliminate these contaminants, as outlined in figure 3. The purification summary is presented in Table 3 and shown in figure 4. The competent cell line used to express CREB was changed to the Rosetta™ host strain. This strain supplies tRNAs for rare codons in E. coli, thus alleviating codon bias and premature termination of translation. Approximately 10% of the CREB protein is encoded by these rare codons, and many occur in clusters that may stall the translational machinery. We revised the purification protocol to include nuclease digestion and denaturing/high salt size-exclusion chromatography for removal of bound nucleic acid and protein contaminants. The cell lysate was heated to 65°C for 15 min. in the presence of RNase A to digest the cellular nucleic acid under conditions unfavorable to protein-nucleic acid interaction. The heat-soluble fraction containing CREB was then bound to heparin-Sepharose in the presence of RNase A and DNase I. Treatment of a previously purified sample with various RNases, including RNase A, RNase T1, and RNase ONE, showed no major differences in digestion efficiency (data not shown). Furthermore, treatment with DNase I revealed that a small portion of the contaminant was DNA (data not shown). Nuclease digestion was performed at this step to remove negatively charged nucleic acid and increase CREB binding and recovery from the heparin-Sepharose resin. In addition, heparin-Sepharose served to stabilize CREB and prevent precipitation during nuclease treatment. CREB was eluted from the resin in a denaturing/high salt buffer containing 8 M urea, 1 M NaCl, 50 mM Na2PO4 pH 8.0, and 2 mM DTT to unfold the protein and disrupt any remaining protein/protein and protein/nucleic acid interactions. A minimum concentration of 8M urea was necessary to fully unfold and disrupt the contaminating interactions (data not shown). The eluate was concentrated and fully exchanged into the denaturing buffer before final purification by denaturing size-exclusion chromatography. Eluant fractions containing purified CREB were pooled and renatured by dialysis against a buffer lacking urea.
Figure 3. Revised CREB purification protocol.
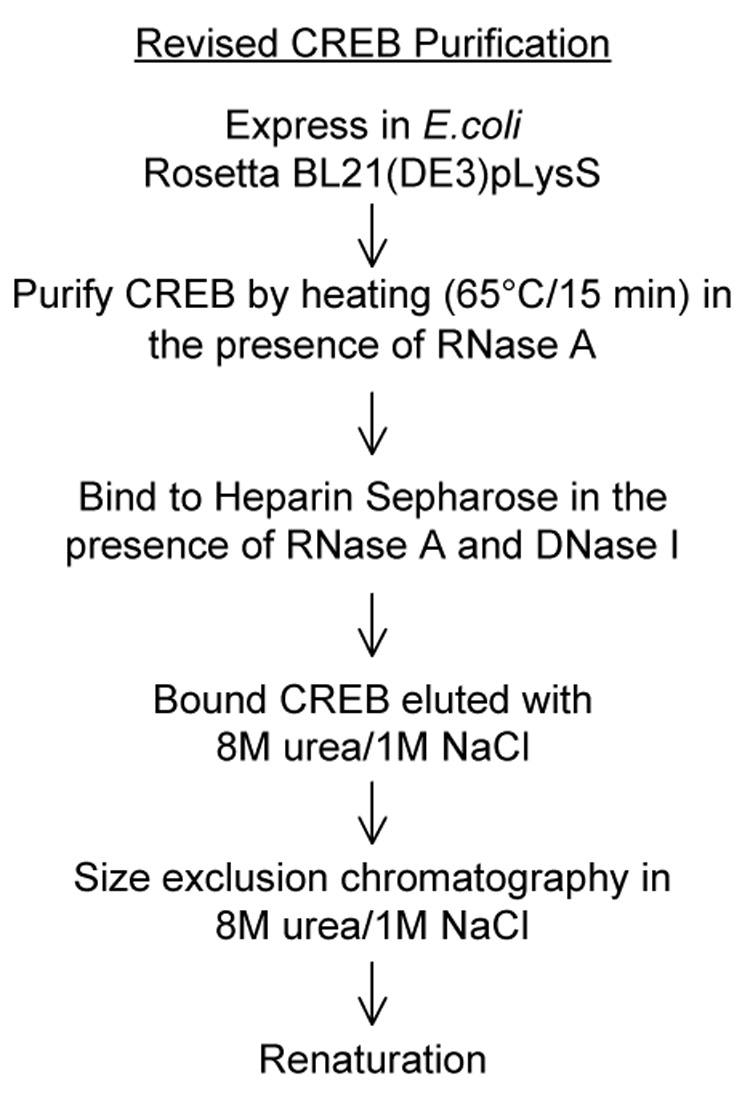
Revisions include a change in expression strain, nuclease treatment, and denaturing/high salt chromatography.
Table 3.
Revised Purification of CREB (1L culture media)
| Purification Steps | Total Proteina | CREB Yieldb | CREB Purityb |
|---|---|---|---|
| (mg) | (%) | (%) | |
| Heat treatment | 20 | 70 | 70 |
| Heparin-sepharose chromatography | 15 | 60 | 75 |
| Denaturing size-exclusion chromatography | 10 | 40 | 99 |
| Renaturation | 10 | 40 | 99 |
Total protein was determined by the Bradford method.
CREB yield and purity were assessed by SDS-PAGE and Coomassie staining.
Figure 4. Purification of CREB to 99% homogeneity using the revised protocol.
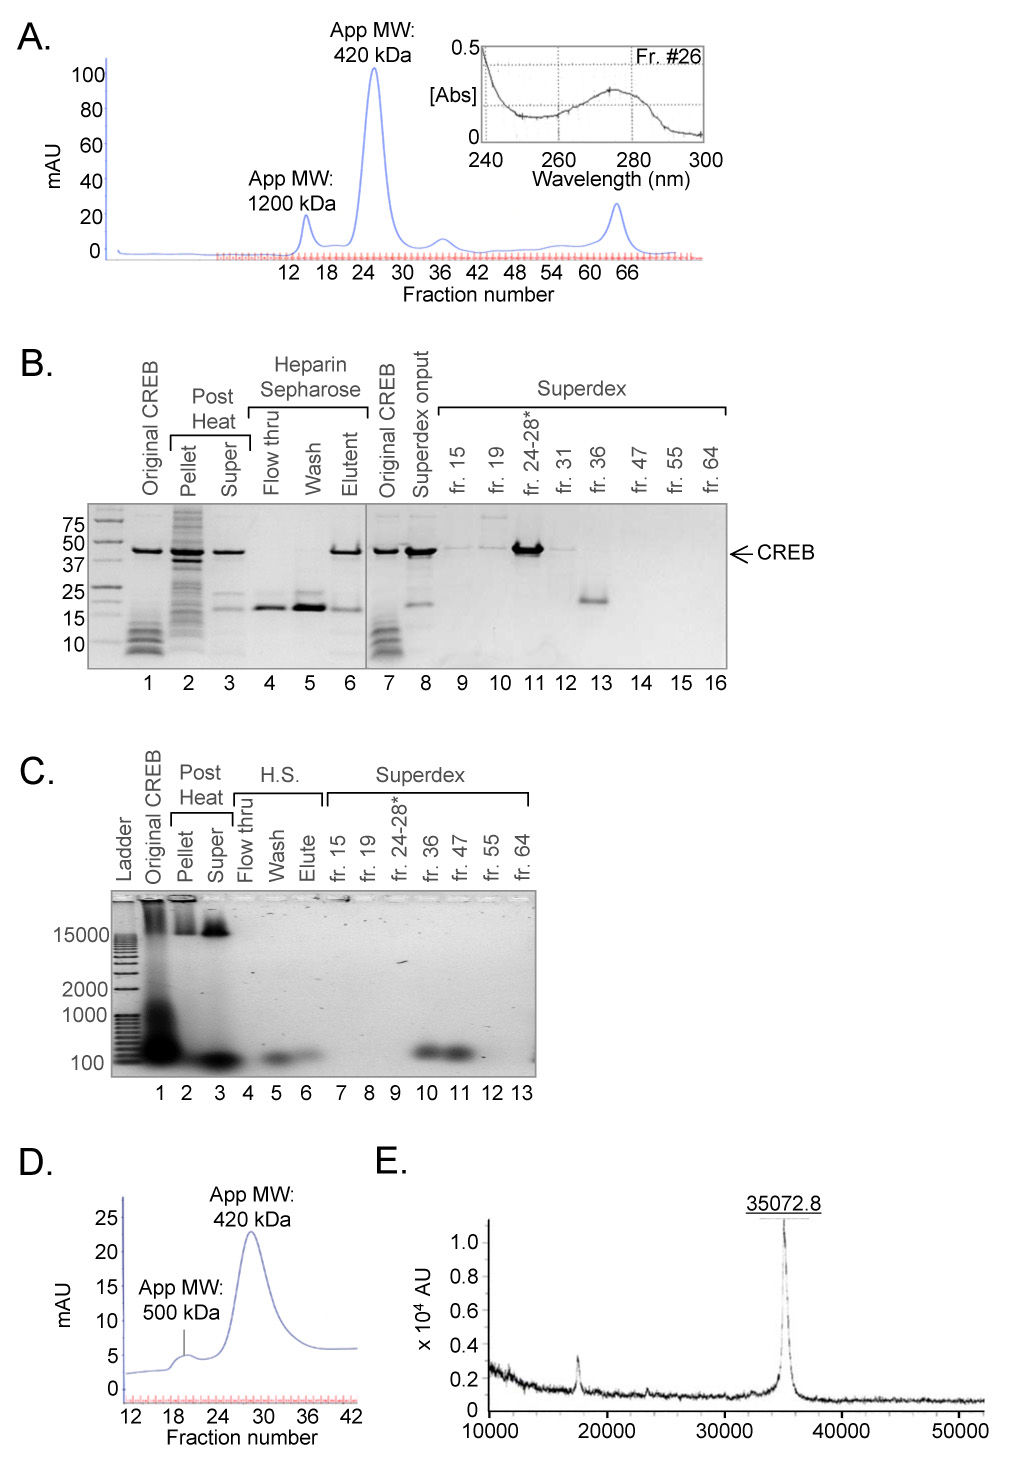
(A.) Elution profile of CREB purified by size-exclusion chromatography. The concentrated heparin-Sepharose eluate was loaded onto a denaturing/high salt prep-grade HiLoad Superdex 200 HR column for the final step in purification. Absorbance (mAU) was measured at 280 nm. The peak fraction corresponding to purified CREB protein was analyzed by UV spectrophotometry (inset). (B.) Revised CREB purification results in a highly pure product lacking low molecular weight protein contaminants. Samples from each step of the purification were resolved on a 10% Tris-Tricine SDS-PAGE and visualized by Coomassie Brilliant Blue Staining. The asterisk corresponds to purified CREB peak fractions. (C.) Revised CREB purification removes contaminating nucleic acids. Samples from each step of the purification were resolved on a 1% agarose gel and visualized by SYBR™ gold staining. (D.) Elution profile of purified CREB analyzed by native size-exclusion chromatography. CREB (30 nmol) was analyzed by prep-grade HiLoad Superdex 200 HR chromatography. Absorbance (mAU) was measured at 280 nm and the apparent molecular weight (App MW) of each major peak is noted. (E.) Mass spectroscopy analysis of purified CREB. Highly purified CREB was analyzed by MOLDI-TOF.
Analysis of highly purified CREB
Analysis of the revised purification protocol by size-exclusion chromatography (Fig. 4A), SDS-PAGE (Fig. 4B), and SYBR® gold agarose gel staining (Fig. 4C), revealed the progressive removal of both protein and nucleic acid contaminants. CREB expression in the Rosetta™ strain dramatically decreased the lower molecular weight protein contaminants, including the small bZIP species (Fig. 4B, compare lane 1 and 3). This strain, however, exhibited enhanced expression of an approximately 18 kDa protein which was conveniently purified away from the CREB protein during subsequent purification steps (Fig. 4B, lanes 4–6, 8 and 13). Heat-purification in the presence of RNase A resulted in considerably less nucleic acid present in the soluble fraction as compared to that from the conventional protocol (Fig. 4C, lanes 1–3). Nuclease treatment during the heparin-Sepharose binding step allowed CREB to fully bind the resin, as CREB was absent in the flow-through and wash fractions (Fig. 4B, lanes 4–5). Most strikingly, a small amount of nucleic acid co-eluted with CREB from the heparin-Sepharose resin and was not fully removed until the sample was further purified over the denaturing size-exclusion column. This final step resulted in complete removal of the lower molecular weight proteins and the contaminating nucleic acid (Fig. 4B and 4C, lanes 8–16). Analysis of the elution profile showed that the bulk of the absorbance had shifted to a highly symmetrical peak corresponding to fractions 23–27, with an apparent molecular weight of 420 kDa. These fractions corresponded to the purified CREB protein (Figure 4B, lane 11). Additionally, analysis of the peak fraction containing CREB by UV spectrophotometry revealed a peak absorbance near 276 nm (Fig. 4A, inset). The small peak at fraction 15, which corresponded to a low amount of CREB that remained bound to nucleic acid, resolved well from the purified CREB peak and could be separated away from the final product.
In summary, the revised protocol generally yielded 10 mg of highly pure CREB per liter of culture, determined by both the Bradford method and UV spectrophotometry. The product was approximately 99% pure and free from protein and nucleic acid contaminants. Analysis of this new CREB by size-exclusion chromatography under native conditions showed an identical elution profile as that observed under denaturing conditions (Fig. 4D, compare with 4A). The persistent, unusually large apparent molecular weight of highly purified CREB may reflect an extraordinarily asymmetric or oblong structure [17]. As a means to further analyze our purified CREB, we performed mass spectroscopy to determine whether the purified protein correlated with the expected molecular mass, and whether carbamylation occurred during the urea denaturation step (Fig. 4E). The predicted molecular mass of CREB is 35,136 Da, and mass spectroscopy data revealed a mass of 35,073 Da. Protein sequencing indicated that the amino-terminal methionine was absent from purified CREB, accounting in part for the small difference in predicted versus observed molecular weight. Importantly, comparison of mass spectroscopy data from original CREB (which was not exposed to urea) and CREB purified by the revised protocol revealed an identical molecular mass for the two proteins, confirming that the new CREB had not undergone modification (data not shown).
Highly purified CREB is competent for CRE DNA binding
A direct comparison of the DNA-binding activities of CREB purified by the two methods showed that the highly purified new CREB retained the same activity as the original CREB in an EMSA (Fig. 5A). Both CREB proteins were incubated with radiolabeled CRE probe for 1 hour on ice. By titrating increasing amounts of CREB as indicated, we determined the apparent dissociation constant (Kd) for complex formation. Both CREB products had an apparent Kd of 1 nM despite the presence of contaminating protein and nucleic acid in the original CREB and despite the two denaturing steps in the purification of the new CREB. The formation of heterodimers between CREB and a bZIP contaminant was apparent only in the sample obtained from the conventional purification. The highly-purified CREB is also active for complex formation with the KIX domain of CBP/p300 when analyzed by EMSA (data not shown).
Analytical size-exclusion chromatography of CREB/CRE DNA complexes revealed that sequence-specific DNA binding reversed the lattice formed between the original CREB and contaminating nucleic acid (Fig. 5B). The shift in the majority of CREB from the 1200 kDa peak to a smaller 500 kDa CREB/DNA peak further supported the notion that the CREB obtained from the conventional protocol was active for binding to a CRE. Together, these data suggested that the aberrant elution profile was not due to irreversible aggregation or disulfide bonds but rather reversible, nonspecific interactions with the nucleic acid contaminants.
Proteolytic digestion reveals striking differences between contaminated and highly-purified CREB
Previously published studies have shown that the CREB bZIP domain undergoes a conformational change upon DNA binding [8, 14]. To further complement the previous activity assays, we performed limited proteolysis to compare the conformation of CREB purified by the two methods. Differences in conformation can be visualized by a change in band pattern or intensity following protease treatment. Original and newly purified CREB were treated with trypsin (1:100 w/w) both in solution and bound to a CRE DNA oligonucleotide (Fig. 6A). Prominent bands observed by Coomasie staining in figure 6A are numbered and sequence analysis allowed assignment of several specific fragments (Fig. 6B). Due to non-specifically bound nucleic acid in the original CREB, we expected that the two CREB products would have different cleavage patterns in solution. Based on the identical DNA binding activities and elution profiles of both proteins in the presence of a CRE oligonucleotide, we also anticipated similar cleavage patterns in the presence of CRE DNA.
Figure 6. Proteolytic cleavage reveals that contaminating nucleic acid alters the confromation of CREB.
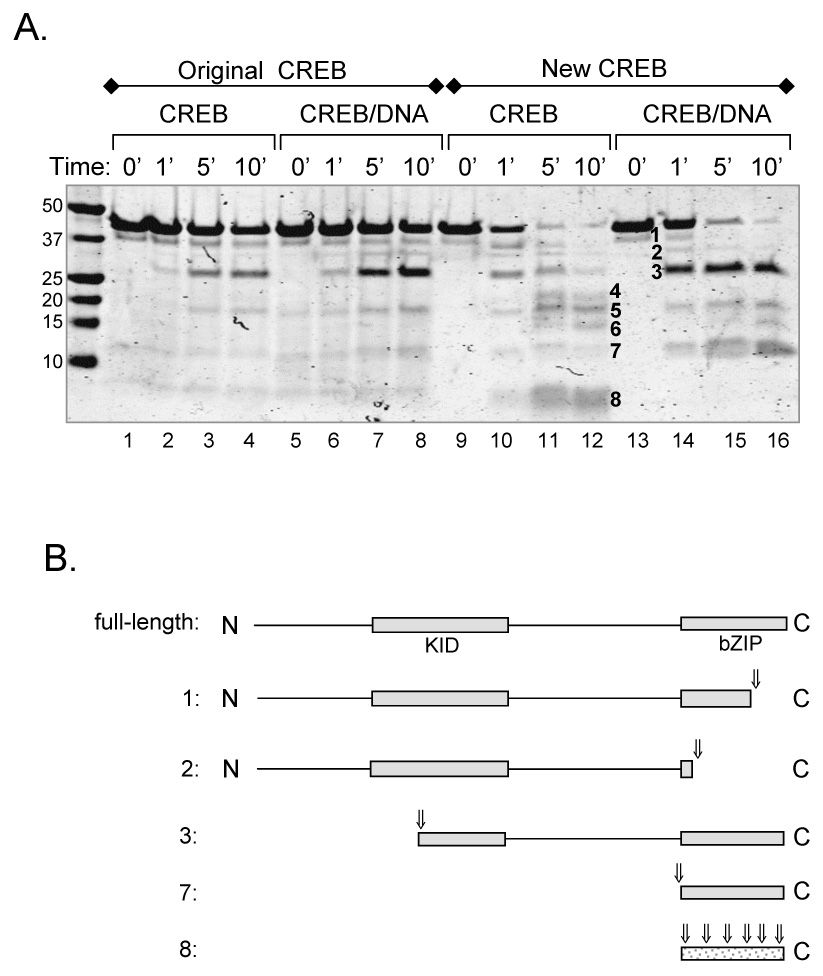
(A.) Original and new CREB in solution and bound to DNA show distinct proteolytic cleavage patterns. All samples were incubated with trypsin (1:100 w/w, trypsin:CREB). Proteins were resolved by 10% Tris-Tricine SDS-PAGE and visualized by Coomassie Brilliant Blue staining. Prominent cleavage products are numbered. (B.) Schematic diagram of CREB cleavage products following trypsin digestion. Numbered fragments correspond to the numbered bands in figure 7A. Assignments are based on sequence information obtained from a subset of cleavage products (bands 1, 2 and 3), coupled with the molecular weights of the fragments and the location of potential trypsin cleavage sites. Arrows represent observed cleavage sites.
As predicted, both CREB samples exhibited considerably distinct proteolytic cleavage patterns in solution. We observed the presence of three fragments (Fig. 6A, lane 11–12, band #4, 6, 8) that were unique to the new CREB sample. CREB protein obtained from the original purification protocol was significantly more resistant to trypsin cleavage, both in solution and bound to DNA, likely due to the contaminating nucleic acid. We observed an increased accumulation of a trypsin resistant fragment and the absence of the low molecular weight smear in the new CREB sample bound to DNA (Fig. 6A, band #3 and 8, respectively). The smear of small peptides only present in the unbound sample corresponds to digestion of the unbound bZIP domain, which contains an unusually high number of trypsin sites. Unexpectedly, the contaminated CREB sample displayed a nearly identical pattern in the absence and presence of the CRE. Notably, original CREB did not display the same extent of the low molecular weight species, suggesting that the bZIP domain was not in the same conformation as that of the highly purified CREB and was somewhat protected by the contaminating nucleic acid. Collectively, these observations suggest that the tight binding of CREB to contaminating nucleic acid and truncation products promotes interactions that significantly alter the pattern of proteolysis as compared to that of the highly-purified new CREB. Furthermore, this contamination may account for the differences in the qualitative and qualitative digestion patterns relative to those presented in previously published studies [3, 8, 18].
CD analysis reveals subtle differences between old and new CREB
We used circular dichroism to further identify any structural disparities between the two differently purified CREB proteins measured in the absence and presence of CRE DNA (Fig. 7). The CD spectra of both CREB proteins (5 µM) in solution and bound to the CRE (3 µM) were determined from 260-190 nm at 17°C. Excess CRE DNA was added to ensure complete complex formation, and the signal from this double-stranded oligonucleotide was subtracted from the complex spectra. Subtracting this signal assumes no conformational changes occur in the DNA upon binding, however, a slight deviation in the baseline at longer wavelengths may be due to observed changes in DNA structure. Pure protein is indistinguishable from the baseline in this region. The signal from the contaminating nucleic acid could not be subtracted from the original CREB spectra and is contributing to the final data obtained. Contaminating A-form tRNA and DNA would have similar spectra, characterized by a large positive band near 190 nm, smaller positive bands near 210 and 275 nm, and a negative band near 245 nm [19].
As expected, a comparison of both CREB proteins in solution showed that the original CREB sample had a distorted spectrum (Fig. 7A). At longer wavelengths, the original CREB spectrum displayed a sloped deviation from the baseline that is characteristic of nucleic acid. The two minima in original CREB, near 222 and 208 nm, had a smaller difference in amplitude than the new CREB, which also had one minima shifted nearer to 202 nm. Additionally, the large positive band at 190 nm present in the new CREB spectrum, a characteristic of α-helicity, was deflected negatively and toward 195 nm in the contaminated CREB spectrum. This change may have been due to an increased propensity toward random coil and/or, to a lesser extent, β-sheet induced by the contaminating nucleic acid. Random coils have a strong negative band near 200 nm while β-sheets have a characteristic positive band shifted to 195–200 nm. Although contaminating nucleic acid should have a positive contribution at these wavelengths, it is possible that such a change in structure could outweigh its signal.
A comparison of both CREB proteins bound to a CRE demonstrated stronger similarities (Fig. 7B). Both complexes displayed a general increase in amplitude of the two minima, indicative of an increase in α-helicity. Additionally, new CREB complex displayed an enhanced 222 nm band, narrowing the difference in amplitude between the minima to resemble that of the original CREB complex. The strong positive band near 190 nm was also enhanced in both samples upon binding to the CRE. Interestingly, although both spectra displayed a deviation from the baseline at the longer wavelengths, the slope in the original CREB/DNA complex spectrum was greater. This observation suggested that this DNA was in a different conformation than that in the new CREB/DNA complex. Analysis of the original CREB, original CREB/DNA, and new CREB/DNA supports the observation that the original CREB protein was tightly bound to the contaminating nucleic acid, as all three spectra have similar signals (Fig. 7C). A difference spectrum (ΔΔε), derived by subtracting the spectra of CREB in solution from CREB bound to the CRE, shows a significant change in secondary structure for both CREB proteins upon binding to DNA. The difference spectra obtained for original and new CREB are distinct from one another, suggesting that the conformational changes each undergoes upon binding to the CRE are not the same (data not shown). Furthermore, although differences in structure were observed, both CREB proteins showed similar conformations when bound to the CRE, indicating that the two denaturation/renaturation steps in the revised protocol did not adversely affect the proper folding of CREB.
Conclusions
The conventional purification protocols for CREB, which commonly utilize a heat-treatment step followed by chromatography, yield a largely pure product. However, we have found that this protein is highly contaminated with tightly-associated nucleic acid as well as CREB truncation products and other polypeptides. As a result, this contaminated CREB elutes as an unusually large aggregate (1200 kDa) when assayed by size-exclusion chromatography. Spectroscopic studies are not feasible due to absorbance from the contaminating nucleic acid and biophysical assays are unreliable due to aggregate formation. Consequently, we have revised the purification scheme to incorporate: 1) expression using the Rosetta™ host strain, 2) nuclease treatment, and 3) denaturing/high salt size-exclusion chromatography. CREB obtained from this revised protocol is 99% pure and elutes as a considerably smaller (500 kDa), homogenous species when analyzed by size-exclusion chromatography. Although CREB purified by the conventional and revised protocols form identical CREB/CRE complexes when assayed by EMSA and size-exclusion chromatography, limited proteolysis and CD indicate that both maintain structural differences in solution and when bound to CRE DNA. These more sensitive assays highlight the small variations in both CREB products which may not affect basic activity assays but would affect more stringent biophysical characterization.
Nucleic acid contamination may be an inherent property of many DNA-binding and positively-charged proteins. We know that these non-specific electrostatic interactions are occurring primarily within the CREB bZIP domain, since the absorbance and elution profile from the size-exclusion column of CREB254–327 is virtually identical to that of full-length CREB. Furthermore, CREB has been shown to bind with high affinity to hairpin binding sites [20], which may account for the tight association of the bZIP domain with contaminating tRNA. These observations raise the question as to how universal contaminating nucleic acid may be in purified preparations of proteins that have DNA binding activity.
Acknowledgements
We would like to thank Karolin Luger, Olve B. Peersen, Robert W. Woody, Steven J. McBryant, and members of their laboratories for helpful discussions and materials. We are especially thankful to Neelam Sharma for her assistance with the proteolysis experiments. This study was supported by a grant from the National Institutes of Health/NCI CA80002.
Footnotes
Publisher's Disclaimer: This is a PDF file of an unedited manuscript that has been accepted for publication. As a service to our customers we are providing this early version of the manuscript. The manuscript will undergo copyediting, typesetting, and review of the resulting proof before it is published in its final citable form. Please note that during the production process errors may be discovered which could affect the content, and all legal disclaimers that apply to the journal pertain.
References
- 1.Johannessen M, Delghandi MP, Moens U. What turns CREB on? Cell Signal. 2004;16:1211–1227. doi: 10.1016/j.cellsig.2004.05.001. [DOI] [PubMed] [Google Scholar]
- 2.Chrivia JC, Kwok RP, Lamb N, Hagiwara M, Montminy MR, Goodman RH. Phosphorylated CREB binds specifically to the nuclear protein CBP. Nature. 1993;365:855–859. doi: 10.1038/365855a0. [DOI] [PubMed] [Google Scholar]
- 3.Kwok RP, Lundblad JR, Chrivia JC, Richards JP, Bachinger HP, Brennan RG, Roberts SG, Green MR, Goodman RH. Nuclear protein CBP is a coactivator for the transcription factor CREB. Nature. 1994;370:223–226. doi: 10.1038/370223a0. [DOI] [PubMed] [Google Scholar]
- 4.Arias J, Alberts AS, Brindle P, Claret FX, Smeal T, Karin M, Feramisco J, Montminy M. Activation of cAMP and mitogen responsive genes relies on a common nuclear factor. Nature. 1994;370:226–229. doi: 10.1038/370226a0. [DOI] [PubMed] [Google Scholar]
- 5.Lundblad JR, Kwok RP, Laurance ME, Harter ML, Goodman RH. Adenoviral E1A-associated protein p300 as a functional homologue of the transcriptional co-activator CBP. Nature. 1995;374:85–88. doi: 10.1038/374085a0. [DOI] [PubMed] [Google Scholar]
- 6.Arany Z, Newsome D, Oldread E, Livingston DM, Eckner R. A family of transcriptional adaptor proteins targeted by the E1A oncoprotein. Nature. 1995;374:81–84. doi: 10.1038/374081a0. [DOI] [PubMed] [Google Scholar]
- 7.Hoeffler JP, Lustbader JW, Chen C-Y. Identification of multiple nuclear factors that inter-act with Cyclic Adenosine 3',5'-Monophosphate Response Element-Binding Protein and Activating Transcription Factor-2 by protein-protein interactions. Mol. Endocrin. 1991;5:256–266. doi: 10.1210/mend-5-2-256. [DOI] [PubMed] [Google Scholar]
- 8.Richards JP, Bachinger HP, Goodman RH, Brennan RG. Analysis of the structural properties of cAMP-responsive element-binding protein (CREB) and phosphorylated CREB. J Biol Chem. 1996;271:13716–13723. doi: 10.1074/jbc.271.23.13716. [DOI] [PubMed] [Google Scholar]
- 9.Franklin AA, Kubik MF, Uittenbogaard MN, Brauweiler A, Utaisincharoen P, Matthews MA, Dynan WS, Hoeffler JP, Nyborg JK. Transactivation by the human T-cell leukemia virus Tax protein is mediated through enhanced binding of activating transcription factor-2 (ATF-2) ATF-2 response and cAMP element-binding protein (CREB) J. Biol. Chem. 1993;268:21225–21231. [PubMed] [Google Scholar]
- 10.Berkowitz LA, Gilman MZ. Two distinct forms of active transcription factor CREB (cAMP response element binding protein) Proc Natl Acad Sci U S A. 1990;87:5258–5262. doi: 10.1073/pnas.87.14.5258. [DOI] [PMC free article] [PubMed] [Google Scholar]
- 11.Ruppert S, Cole TJ, Boshart M, Schmid E, Schutz G. Multiple mRNA isoforms of the transcription activator protein CREB: generation by alternative splicing and specific expression in primary spermatocytes. Embo J. 1992;11:1503–1512. doi: 10.1002/j.1460-2075.1992.tb05195.x. [DOI] [PMC free article] [PubMed] [Google Scholar]
- 12.Habener JF, Meyer TE, Yun Y, Waeber G, Hoeffler JP. Characterization of a cAMP-regulated enhancer-binding protein. Metabolism. 1990;39:13–16. doi: 10.1016/0026-0495(90)90199-m. [DOI] [PubMed] [Google Scholar]
- 13.Loriaux MM, Rehfuss RP, Brennan RG, Goodman RH. Engineered leucine zippers show that hemiphosphorylated CREB complexes are transcriptionally active. Proc Natl Acad Sci U S A. 1993;90:9046–9050. doi: 10.1073/pnas.90.19.9046. [DOI] [PMC free article] [PubMed] [Google Scholar]
- 14.Santiago-Rivera ZI, Williams JS, Gorenstein DG, Andrisani OM. Bacterial expression and characterization of the CREB bZip module: circular dichroism and 2D 1H-NMR studies. Protein Sci. 1993;2:1461–1471. doi: 10.1002/pro.5560020910. [DOI] [PMC free article] [PubMed] [Google Scholar]
- 15.de Groot RP, Delmas V, Sassone-Corsi P. DNA bending by transcription factors CREM and CREB. Oncogene. 1994;9:463–468. [PubMed] [Google Scholar]
- 16.Wright PE, Dyson HJ. Intrinsically unstructured proteins: re-assessing the protein structure-function paradigm. J Mol Biol. 1999;293:321–331. doi: 10.1006/jmbi.1999.3110. [DOI] [PubMed] [Google Scholar]
- 17.Sharma N, Lopez DI, Nyborg JK. DNA binding and phosphorylation induce conformational alterations in the kinase inducible domain of CREB: Implications for the mechanism of CREB transcription function. J Biol Chem. 2007 doi: 10.1074/jbc.M701435200. [DOI] [PubMed] [Google Scholar]
- 18.Gonzalez GA, Menzel P, Leonard J, Fischer WH, Montminy MR. Characterization of motifs which are critical for activity of the cyclic AMP-responsive transcription factor CREB. Mol Cell Biol. 1991;11:1306–1312. doi: 10.1128/mcb.11.3.1306. [DOI] [PMC free article] [PubMed] [Google Scholar]
- 19.Woody RW. Circular Dichroism. In: Creighton TE, editor. Encyclopedia of Molecular Biology. New York: Wiley; 1999. pp. 460–468. [Google Scholar]
- 20.Spiro C, Richards JP, Chandrasekaran S, Brennan RG, McMurray CT. Secondary structure creates mismatched base pairs required for high-affinity binding of cAMP response element-binding protein to the human enkephalin enhancer. Proc Natl Acad Sci U S A. 1993;90:4606–4610. doi: 10.1073/pnas.90.10.4606. [DOI] [PMC free article] [PubMed] [Google Scholar]