Abstract
A new functionalization procedure was developed to replace cyltrimethylammoniumbromide coating on gold nanorods (GNRs) fabricated through seed-mediated growth with chemically active alkanethiols; antibodies were then attached to the GNRs to yield gold nanorod molecular probes (GNrMPs). The functionalization procedure was shown to minimize nonspecific binding. Multiplex sensing was demonstrated for three targets (goat anti-human IgG, goat anti-rabbit IgG, and goat anti-mouse IgG) through the distinct response of the plasmon spectra of GNrMPs to binding events. Quantification of the plasmonic binding events and estimation of ligand binding kinetics tethered to these nanoscale structures was also demonstrated through a mathematical approach. Evaluation of the experimental and theoretical data yields an affinity constant Ka = 1.34 × 10⁷ M−1, which was in agreement with the IgG-antiIgG binding affinity reported in the literature. The GNrMP sensors were found to be highly specific and sensitive with the dynamic response in the range between 10−9 M and 10−6 M. The limit of detection of GNrMPs was found to be in the low nanomolar range, and is a function of the binding affinity: for a higher probe-target affinity pair, the limit of detection can be expected to reach femto molar levels. This technique can play a key role in developing tunable sensors for sensitive and precise monitoring of biological interactions.
INTRODUCTION
The development of biosensors for detection, monitoring, and characterization of a variety of molecular interactions is important for disease diagnosis, drug discovery, proteomics, and detection of biological warfare agents (1).
Fundamentally, a biosensor is constructed by coupling a ligand to its receptor complement via an appropriate signal transduction element (2). Various signal transduction mechanisms have been explored as biosensing schemes, including optical (3,4), radioactive (5,6), electrochemical (7,8), piezoelectric (9,10), magnetic (11,12), micromechanical (13,14), IR and Raman spectroscopic (15,16), and mass spectrometric (17,18). Although each of these methods has its individual strengths and weakness, optical sensors that utilize the surface plasmon resonance (SPR) phenomenon of planar gold surfaces have shown potential and have become the method of choice in many biosensing applications (4,19).
Other than macro-scaled SPR sensors using a planar gold surface, several research groups have begun to develop micro/nano scaled optical biosensors that utilize the unique optical properties of gold/silver nanostructures (20–29). The optical properties of gold/silver nano structures strongly depend on both the particle size and shape and are related to the interaction between the metal conduction electrons and the electric field component of the incident electromagnetic radiation, which leads to strong, characteristic absorption in the visible to infrared region of the spectrum (30).
In aqueous solutions, gold nano structures exhibit strong plasmon bands depending on their geometric shape and size. For spherical particles, a strong absorption band at ∼520 nm due to the excitation of plasmons by incident light can be readily observed (30). For nanorods, two distinct plasmon bands, one associated with the transverse (∼520 nm) mode and the other with the longitudinal mode (usually >600 nm), could be observed (30). Quadrupole plasmon modes have also been reported for more complex structures such as prisms (31). Biosensor applications (20–29) have been designed based on the fact that the wavelength of these bands are affected by changes in the dielectric properties in the close vicinity of these structures (known as nanoSPR (20), or localized surface plasmon resonance (21)) due to the binding of ligands to the corresponding receptor molecules (i.e., antibodies) immobilized onto the nanostructures through chemi- or physisorption. Nanostructures to probe specific targets can be fabricated by attaching target-specific antibodies to a suitable chemical tether to these nano structures. The magnitude of wavelength shift induced by target binding has been correlated to the dielectric property variations in the vicinity of these nanostructures. In general, the signal strength induced by receptor-ligand binding is related to the number of receptors and the number of bound ligands; therefore, by measuring the wavelength shift it might be possible to obtain quantitative information of the binding events.
When anisotropic particles such as nanorods are used to fabricate gold nanorod molecular probes (GNrMPs), single particle sensing could be achieved. Recently we have demonstrated that GNrMPs made with gold nanorods of different aspect ratios could be implemented in a multiplex mode to detect presence/absence of multiple targets simultaneously (29). However, in an earlier work the GNrMPs were only partially functionalized and were prone to nonspecific binding, and the detection of targets was not quantitatively interpreted. Van Duyne and co-workers (21) developed a mathematical model to study the response of nanoSPR devices from the binding of solution-phased streptavidin to biotin molecules immobilized onto triangular silver nanostructures fabricated on glass surface. Using this model, the binding affinity between streptavidin and biotin onto functionalized silver nanostructures was estimated as 1011 M−1, which is considerably smaller than the binding affinity between streptavidin and biotin in the solution phase, which is 1013–1015 M−1. The significant reduction in binding affinity could result from the restriction of free motion of the surface-immobilized biotins or partial denaturation due to binding of biomolecules to planar surfaces.
In this research, we introduce a simple but a novel methodology to functionalize GNrMPs completely by replacing the cyltrimethylammoniumbromide (CTAB) cap of the gold nanorods (GNRs) with a chemically active alkanethiol cap (11-mercaptoundecanoic acid (MUA)), which significantly reduces the nonspecific binding. Compared to other available functionalization strategies for gold nanorods that involved replacement of the CTAB bilayer by lecithin (32) and thiolated-PEG (33), our procedure is very simple but effective due to its ease of implementation and flexibility to accommodate a variety of biologically relevant molecules such as antibodies, DNAs, etc.
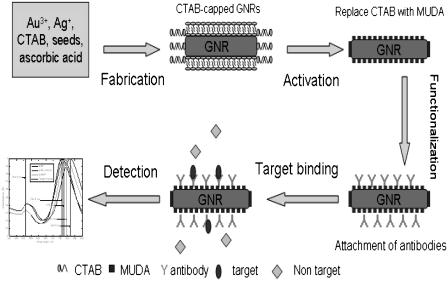
A systematic study of the response of GNrMPs to changes in dielectric properties (refractive indexes) in the vicinity is presented and quantitative analysis of binding events is provided. It is shown that these GNrMPs operate in a manner similar to macro SPR sensors and it is possible to transduce very small changes in refractive index near the surface of the GNrMPs into a measurable wavelength shift. The GNrMPs were found to be extremely sensitive and could measure the targets at low nanomolar level. The design, fabrication, and implementation of the GNrMP detection scheme are illustrated in Fig. 1.
FIGURE 1.
Fabrication, functionalization, and implementation of GNrMPs.
EXPERIMENTAL SECTION
Fabrication and characterization of gold nanorods
A seed-mediated growth procedure modified from that suggested by Nikoobakht and El-Sayed (34) was used to fabricate gold nanorods in the aspect ratio between 2.5 and 7. Details of the procedure were reported elsewhere (29). Hexadecyltrimethylammoniumbromide (99%), benzyldimethylammoniumchloride hydrate (99%), sodium borohydride (99%), L-ascorbic acid, goldIII chloride hydrate (>99%), and silver nitrate (>99%) were all purchased from Sigma-Aldrich (St. Louis, MO) and used without further purification. Nanopure deionized and distilled water (18.2 MΩ) was used for all experiments.
Assuming the density of the gold nanorods as equivalent to that of bulk gold (19.30 g/cm3), an average mass of gold nanorods of different aspect ratios could be calculated once their average sizes are determined by transmission electron microscope (TEM). The concentration of atomic gold in the solution of gold nanorods was determined by inductively coupled plasmon atomic emission spectroscopy (ICP-AES). A gold atomic absorption standard solution (Sigma-Aldrich, St. Louis, MO) was used for calibration in the ICP-AES experiments. Comparison of the concentration of atomic gold in the nanorod solution to the average nanorod volume obtained by TEM analysis yielded a molar concentration value in the range between ∼10 and 30 nM for gold nanorods of different aspect ratios. The gold nanorods were then concentrated to 100 nM by centrifugation. All subsequent characterization, activation, and functionalization were conducted using these nanorod samples.
The yield and aspect ratios of gold nanorods was determined using TEM, acquired with a Philips CM-100 TEM (Philips, Eindhoven, Netherlands) operating at 100 kV, 200 μm condenser aperture, 70-μm objective aperture, and a spot size 3. TEM grids were prepared by placing 1 μl of the nanorod solution in a 400-mesh formvar-coated copper grid and evaporating the solution at room temperature. Images were then captured using a Tietz F415 slow scan digital camera (TVIPS, Gauting, Germany) at 4K resolution. At least 150∼200 nanorods could be counted and measured per grid to provide an estimate of the mean aspect ratio of these nanorods after the synthesis step.
Absorption spectra of GNrMP samples through each stage of experiments were measured using a Jasco V570 UV-Vis-NIR spectrophotometer (Jasco, Easton, MD), in the wavelength range between 400 and 1500 nm. The measured spectra were normalized by rescaling the maximum absorbance of the longitudinal plasmon peak to 1.
To evaluate the sensitivity of gold nanorods with different aspect ratios to the changes in refractive indexes in the environment, sugar solutions (0.2 g/ml, 0.4 g/ml, 0.6 g/ml, 0.8 g/ml, 1 g/ml, 1.2 g/ml, 1.4 g/ml, and 1.6 g/ml) of different refractive indexes (1.3547, 1.374, 1.3906, 1.407, 1.42, 1.428, 1.439, 1.445) were prepared, gold nanorods of each aspect ratio were suspended in these sugar solutions, and their plasmon spectra were measured. The shift in the longitudinal plasmon peaks were recorded and the sensitivity factor S, defined as the relative change in resonance wavelength with respect to change in the refractive index of the surrounding medium, S = dλres/dns (35), was calculated.
Functionalization of gold nanorods to synthesize GNrMPs
Biofunctionalization of the GNRs constitutes a two-step process:
In Step 1, termed the Activation Step, a chemical anchor layer was formed on the nanorod surface to provide active functional groups to which biological molecules (i.e., antibodies) can be covalently attached.
In Step 2, the Functionalization Step, biomolecules were covalently linked to the anchor layer to produce GNrMPs for target specific sensing (Fig. 1).
Although the high binding affinity of alkanethiols to gold has been widely utilized to chemically modify gold nanoparticle surface for biological functionalization (36–39), it cannot be directly applied to CTAB-capped gold nanorods because the tightly-packed CTAB bilayers on the side faces of the gold nanorods block the access of alkanethiol molecules to the gold surface. Spontaneous reaction of alkanethiol molecules with gold under ambient temperature only occurs at the end faces of the gold nanorods to produce partially activated gold nanorods (36–38). In partially activated gold nanorods, the remaining CTAB, which is positively charged at physiological pH and attracts negatively-charged proteins, can cause severe nonspecific binding problems. To overcome this problem, the CTAB cap has to be replaced completely. A procedure was developed in our lab, to remove CTAB by elevating the temperature of the solution and the gold nanorods were kept from aggregation by sonication. 11-mercaptoundecanoic acid (MUDA) was used as an alkanethiol to react with gold nanorods to produce a fully activated surface for biofunctionalization. Briefly, the nanorods were suspended in water at 20 nM, to 5 ml of this solution, 1 ml of 20 mM MUDA in ethanol was added and the solution was kept at 60°C under constant sonication for 30 min, then the temperature was decreased to 30°C and the solution was kept under constant sonication for 3 h. Afterwards the solution was subjected to chloroform extraction for three rounds and the gold nanorods were collected by centrifugation and resuspended in phosphate-buffered saline (PBS) buffer (pH 7.4, Sigma).
Once the MUDA SAM was formed, human and mouse IgGs were then attached to the activated nanorods as follows: to 5 ml of the activated nanorods (∼100 nM), 1 ml of freshly prepared 0.4 M 1-ethyl, 3-(3-dimethylaminopropyl) carbodiimide (EDAC) and 0.1 M 4-(4-maleimidophenyl) butyric acid N-succinimidyl ester (NHS) (both from Pierce Biotechnology, Rockford, IL) solution were added and sonicated for 25 min at 4°C. The resulting structures were then collected by centrifugation at 5000 rpm for 5 min and resuspended in 5 ml PBS buffer (pH = 7.4). IgG suspended in PBS was then added to the resulting nanorod suspension (the concentration of IgG was varied between ∼200 and 1000 nM) and then incubated for 1 h under constant sonication at room temperature. The functionalized nanorods were subsequently collected by centrifugation at 5000 rpm for 5 min and three rounds of vigorous washing and sonication in PBS solution for 10 min. The supernatant was collected after each washing step and the cumulative protein content was measured using a Bio-Rad Protein Assay (Bio-Rad Laboratories, Hercules, CA) with bovine serum albumin as a protein standard. The amount of IgGs bound to the nanorods was determined by subtracting the IgGs left in the supernatant from the original amount.
Implementation of the gold nanorod molecular probes
Five milliliters of the GNrMPs (20 nM) was mixed with 5 ml of targets (respective anti-IgGs) with concentrations spanning from 10−6 M to 10−9 M for 30 min under mild stirring to allow the probe-target binding to reach equilibrium and the sensor response to the probe-target binding depicted by a pronounced shift of longitudinal plasmon peaks, as measured using UV-Vis-NIR spectroscopy. For multiplex analysis, three GNrMPs with different aspect ratios were mixed at equal concentrations, and the target solution containing the respective complement (anti-IgGs) at varying concentrations were prepared. Equal amount of GNrMP and target solutions were mixed and kept under mild stirring for 30 min and the plasmon spectra of the mixture were then measured. The response of GNrMPs to target binding events was then quantitatively evaluated.
RESULTS AND DISCUSSION
Nanorods fabrication and characterization
Gold nanorods of aspect ratios in the range between 2.8 and 7 were fabricated using the single- and double-surfactant protocols discussed earlier. For the aspect ratio considered, a linear correlation could be established between the aspect ratio of gold nanorods and the absorbance wavelength of the longitudinal plasmon bands, as reported elsewhere (29); hence, the aspect ratio of gold nanorods could be easily deduced from their plasmon spectra.
TEM imaging of nanorods of various aspect ratios confirmed yields of 93.5–98.5%. Another observation is that the width of nanorods (7∼10 nm) remained approximately the same; hence, an increase in aspect ratio was predominately determined by elongation of nanorods.
A mathematical model based on the Drude free electron model of metal proposed by Lee and El-Sayed in a recent article (40) to explain the sensitivity of the wavelength of the plasmon bands of gold nanorods to the refractive index of their surroundings, defined by a sensitivity factor, S, can be expressed as
 |
(1) |
where λres is the plasma wavelength of nanostructures, and ns is the refractive index of the surroundings.
The wavelength of the plasmon bands of gold nanostructures is given by
 |
(2) |
where λp is the plasmon wavelength of bulk metal, ɛb represents the interband contribution to the dielectric function of the gold nanostructure, ɛs is the dielectric constant of the surrounding medium, and Y is a geometric parameter proportional to the square of aspect ratio (AR) of the nanorods, Y ∝ AR2. Hence
 |
(3) |
Equation 3 shows that the sensitivity factor S of the surface plasmon wavelength in response to changes in the refractive index of the local environment depends on, among other factors such as electron relaxation time and background susceptibility, the type of metal through the bulk plasma wavelength and the geometry of the nano structure, i.e., the aspect ratio of the nanorods, and is linearly proportional to both. Therefore, as the aspect ratio increases, the sensitivity of the GNrMPs will increase.
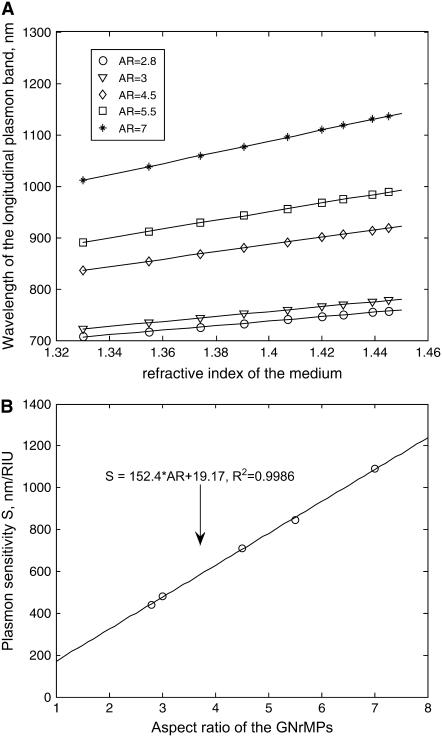
Fig. 2 A shows the experimentally observed correlations between maximum plasma wavelength and local refractive index, over a range of 1.33–1.45, for gold nanorods with ARs of 2.8, 3, 4.5, 5.5, and 7, respectively. The slopes of the lines give the sensitivity factor S for each gold nanorod. Fig. 2 B shows a correlation between S and aspect ratio to be linear. Once aspect ratio is known, S can be readily determined.
FIGURE 2.
Sensitivity factor of GNrMPs. (A) Longitudinal wavelength (λlong_res) versus refractive indexes of the surrounding medium (ns) for GNrMPs with varied aspect ratio (AR). (B) Plasmon sensitivity S versus AR.
Functionalization of gold nanorods to make GNrMPs
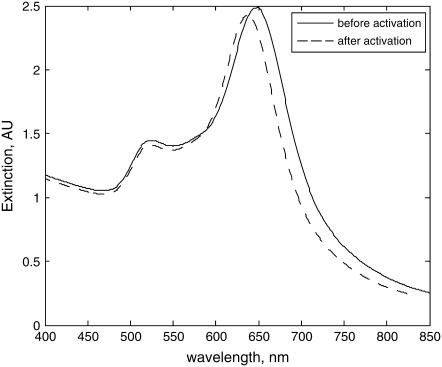
After the full activation of GNRs, the CTAB layers on the side face of these nanorods are replaced completely by MUDA. It is known that the refractive index (RI) of the CTAB layer (RI = 1.435 (41)) is smaller than the RI of MUDA (RI = 1.463 (21)). However, the CTAB layer is a bilayer with a thickness of 4∼5 nm (39), which is larger than the thickness of MUDA SAM (1.69 nm) (21). The effective local RI is then due to the combined effect of the refractive index and thickness of the layers in the vicinity of each gold nanorod. Since the effective RI is higher before activation (1.414) a blue shift of the plasmon bands is expected (effective RI after activation is 1.392, calculated using Eqs. 7 and 8). Fig. 3 shows the plasmon spectra of GNRs with AR = 2 before/after complete activation. Blue shifts of 11.5 nm observed matched well with the theoretical prediction (10.3 nm), confirming the complete activation of the nanorod surfaces.
FIGURE 3.
Longitudinal plasmon band of GNR blue-shifts as response to complete activation.
Once the MUDA SAM is formed, biomolecules can be covalently attached via the −NH2 bond of the antibodies to the −COOH terminus of the MUDA SAM. A further red shift of the plasmon peak can be observed due to antibody functionalization. After the attachment of human IgG Fab, these rods showed a significant shift (of up to 20 nm) compared to the unmodified rods. The sensitivity of the plasmon spectra to the attachment of molecular layers forms the basis of molecular biosensors using single particle SPR.
Although IgGs can only covalently attach to the MUDA activated sites, physisorption of IgGs to CTAB capped side faces is also possible for the partially activated rods. The isoelectric point for IgG Fabs are ∼6 (42); under the reaction pH (∼7.4), the IgG Fabs are negatively charged, and thus will bind to the positively charged CTAB cap due to electrostatic interaction. To obtain GNrMPs that have consistent IgG coating, the complete MUDA-activation route is necessary, especially when low IgG/nanorod ratio is required to quantify biomolecule interactions.
Responses of GNrMPs to target binding, as a function of target (anti-IgG) concentration
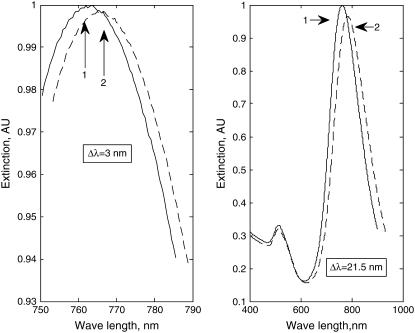
Exposure of the GNrMPs of three different aspect ratios (2.3, 3.5, and 5.1) (20 nM) to targets (anti-IgGs) of concentration 1 μM or higher resulted in maximum SPR responses (ΔRmax = Δλmax) of 15, 21.5, and 33.2 nm, respectively, depicting the saturation of GNrMPs with targets. When the targets are present at lower concentrations, a corresponding reduction in the response of GNrMPs (ΔR = Δλ) was observed, implying an unsaturated state. The smallest meaningful responses (∼3 nm shift) that could be observed at target concentration as low as 90 nM, 20 nM, and 10 nM for the three GNrMPs tested (an example is shown in Fig. 4, for GNrMPs with AR = 3.5) demonstrates that the sensitivity of GNrMPs is tunable by controlling its aspect ratio.
FIGURE 4.
The minimum and maximum observed plasmon shifts for GNrMPs (AR = 3.5) upon exposure to anti-IgG targets. (Left) Response before and after 20 nM target exposure; Δλlong res = 3 nm. (Right) Response before and after 1 μM target exposure, Δλlong res = 21.5 nm.
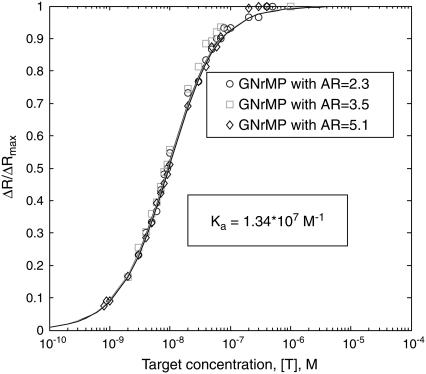
The normalized GNrMP responses, ΔR/ΔRmax, are plotted against the concentrations of the targets and shown in Fig. 5 for the three GNrMPs. The concentration range examined varied from 10−9 M to 10−5 M. The ΔR/ΔRmax versus concentration curve could be quantitatively interpreted using the steady-state binding kinetics model with the following assumptions:
Binding between solution-phased targets (anti-IgGs) and particle-bound capturing agents (IgGs) occurs by 1:1, with invariant affinities that are not affected by the antibody immobilization;
The only operative GNrMP sensing mechanism is the change in the local refractive index caused by binding events; and
The measured nanoSPR response, ΔR, is determined by the thickness, danalyte, of the absorbed analyte layer, and its refractive index, nanalyte.
Treating each GNrMP as a single sensing platform, the equilibrium surface excess that Γtargets expresses as the number of molecules/cm2, for 1:1 binding of anti-IgG to particle-bound IgG, is given by the Langmuir isotherm (21),
 |
(4) |
where  is the saturation value of Γtargets (i.e., when every capturing agent (IgGs) is saturated by the target (anti-IgGs)), [T] is concentration of targets, and Ka is the apparent affinity constant for 1:1 binding of IgG to anti-IgG.
FIGURE 5.
Normalized GNrMP response, ΔR/ΔRmax, versus target concentration [T].
Adopting the model developed by Campbell and co-workers (43) to analyze SPR responses to target binding, the GNrMP response (R) to target binding is given by
 |
(5) |
where S is the sensitivity factor of GNrMPs, defined in Eq. 3; next is the bulk refractive index of the external medium (next = nwater = 1.33); and neff is the effective refractive index of the quadralayer structure (layer 1 = MUA SAM, layer 2 = IgG, layer 3 = anti-IgG, and layer 4 = water) surrounding each GNrMP. S is determined experimentally for each GNrMP. The effective refractive index of the quadralayer structure is determined by integrating the distance-dependent local refractive index, n(z), weighted by the square of the local electromagnetic field, E(z) as (43)
 |
(6) |
where
 |
(7) |
Here nIgG = nanti-IgG; dsam is the thickness of the MUDA SAM; dIgG is the thickness of the IgG layer, which is the same as danti-IgG; E(z) is assumed to be only dependent on the local surface normal z; and ld is the characteristic decay length. Although the electromagnetic field surrounding these GNrMPs is known to be more complex (44), this simple approximation was shown to sufficiently illustrate the behavior of silver nanoSPR sensors (21), and will be adopted to illustrate the GNrMP characteristics. The factor 2/ld normalizes the integral in Eq. 6 so that neff = nwater when n(z) = nwater for all z. Van Duyne and co-workers (21) assumed exponential decay for E(z), E(z) = exp(−z/ld), with ld ∼5–6 nm, which was consistent for a saturation distance of ∼30 nm. The same assumption is made in this work. Equation 6 can now be evaluated and substituted into Eq. 5 to present the measured response of GNrMPs as ΔR = Rlayer3-Rlayer2,
 |
(8) |
where dIgG = dtarget (danti-IgG) is given by
 |
(9) |
The thickness of the SAM layer, dSAM, is approximated by (21)
 |
(10) |
where x, the number of CH2 units in MUDA = 10, a = 0.13 nm, and b = 0.66 nm (45).
The maximum GNrMP response, ΔRmax, for the target (anti-IgGs) saturation level is
 |
(11) |
The ΔR/ΔRmax ratio depicts the predicted normalized GNrMP response versus dT, which is directly related to target concentration, [T], through Eq. 9. Ka in Eq. 9 is the parameter to be optimized to best fit the experimental data.
To determine the best fit experimental data, the following experimentally determined values for the GNrMP-anti-IgG system were used: S = 152.4 × AR + 19.17 nm/RIU; AR is the aspect ratio of the GNrMPs; nSAM = 1.463 (21); nwater = 1.33; nIgG = 1.41 (46); ld = 6.0 nm; and dSAM = 1.96 nm. From saturation binding data of IgG to GNRs, the parameter  was found to be 2.13 × 10⁻² molecules/nm2, which yield a dT = dIgG =
  × VIgG. VIgG is approximated as 5.2 nm × 5.2 nm * 5.2 nm (47), so dT = 2.98 nm.
Using these parameters, for IgG-anti IgG binding, ΔRmax is found to be related to the aspect ratio of GNrMPs as
 |
(12) |
As shown in Fig. 5, this prediction matched well with the experiment results.
The ΔR/ΔRmax versus [T] data in Fig. 5 could be best fitted with a Ka = 1.34 × 10⁷ M−1. This Ka is consistent with the binding affinity reported in the literature for IgG-anti-IgG binding (47–49), suggesting that the immobilization of IgGs to gold nanorods did not significantly reduce their binding affinity.
The ΔR/ΔRmax versus [T] relationship is independent of the aspect ratio of GNrMPs; however, since the minimum response (ΔRmin) that can be measured by the spectrometer is fixed (depends on instrumentation), with ΔRmax being larger for GNrMPs with larger AR, the limit of detection (LOD = ΔRmin/ΔRmax) could be lower. For the IgG-anti-IgG complex studied, if AR = 10, the LOD could reach ∼1.8 nM (Eq. 9). The LOD is thus a function of the ligand-receptor pair, and is determined by the size of molecules (thickness of the absorbed layers on the GNrMPs), the binding affinity, and the AR of GNrMPs.
The sensitivity of the GNrMPs is largely dependent on the binding affinity between the probes and their targets. For a GNrMPs with AR = 10, for protein-protein interactions, it could be estimated (Eq. 9) that for Ka ∼ 1010 M−1, the LOD could reach fM level.
It should also be noticed that the dynamic range of the GNrMP system for detecting IgG-anti-IgG interaction is 10−9 M to 10−7 M; within this range the response of the nanoscale probes increases exponentially with respect to target concentration. Therefore, the GNrMP scheme is an excellent system for detecting targets in the nano molar range and is comparable in sensitivity to fluorescence methods (50).
Quantitative analysis of multiple targets using GNrMPs in a multiplex fashion
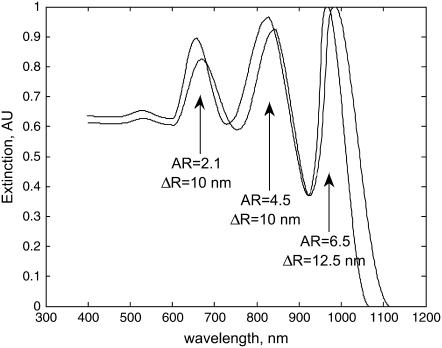
A major advantage of the GNrMP scheme is its multiplexing capability; by using GNrMPs with different aspect ratios, multiple targets can be probed simultaneously. In this study, GNrMPs with aspect ratios of 2.1, 4.5, and 6.5 functionalized with human IgG, rabbit IgG, and mouse IgG, respectively, were used in equal proportion (5 ml, 20 nM) to the rod concentration and incubated with a 10 ml target that contained 100 nM of the respective anti-IgG counterpart (20 nM goat anti-human IgG, 20 nM goat anti-rabbit IgG, and 20 nM goat anti-mouse IgG) for 30 min under mild stirring at 4°C. Fig. 6 shows the plasmonic spectrum before/after incubation with targets. Results in Table 1 show a reasonable agreement with actual concentrations, demonstrating that quantitative analysis of multiple targets could be achieved from our proof of concept study.
FIGURE 6.
Quantitative analysis of multiple targets in a sample using different GNrMPs shows plasmon red-shift due to GNrMPs binding to their respective targets.
TABLE 1.
Comparison of measured target concentration to real values
| Target 1 | Target 2 | Target 3 | |
|---|---|---|---|
| Real value | 100 nM | 20 nM | 20 nM |
| Measured value | 92.32 nM | 19.14 nM | 15.86 nM |
Nonspecific binding studies
Selectivity of the MUDA-SAM-based GNrMP plasmonic sensors is presented to demonstrate its application as a functional sensor. Fully activated GNrMPs (AR = 2.1) were incubated with goat anti-human IgGs, without EDAC-NHS mediated IgG coupling to eliminate the presence of covalently-linked IgGs at the GNrMP surfaces. A 1 nm shift was observed as the plasmon response of MDUA-activated GNrMPs to the goat anti-human IgGs, which is comparable to the peak-to-peak wavelength shift noise (0.5 nm, measured over five replications of the same sample). At a pH of 7.4, MUDA was deprotonated to become negatively-charged, thereby minimizing the electronic repulsion between MUDA− and anti-IgG− to result in minimal or no nonspecific binding. In our work, the minimum meaningful plasmon response due to target binding was 3 nm, giving an effective S/N ratio of ∼3.
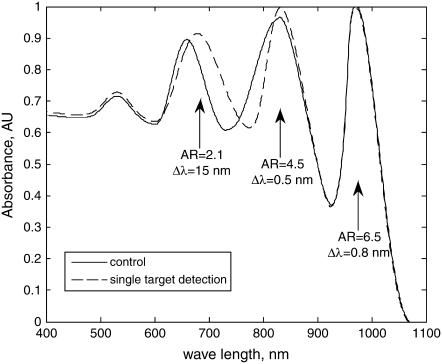
The nonspecific binding was also evaluated for multiplex detection using mixtures of equal amount (5 ml, 20 nM) of the three different GNrMPs used in multiplex experiments (AR = 2.1, 4.5, and 6.5, functionalized with MUDA with human IgG, rabbit IgG, and mouse IgG, respectively) and incubated with 10 ml of 100 nM goat anti-human IgGs for 30 min. The plasmon spectra before/after the incubation shown in Fig. 7 indicates that even the most sensitive GNrMPs (AR = 6.5) responded by only a mere 0.8 nm red-shift, suggesting negligible nonspecific binding for the detection limits probed.
FIGURE 7.
Specific response of multiple GNrMPs to a single target, demonstrating negligible nonspecific binding.
CONCLUSION
In this study we demonstrate a multiplex biosensor scheme for quantitative measurement of biological interactions. The LOD of the GNrMP scheme is determined by four factors: the aspect ratio of the rod-based GNrMP, the binding affinity, the molecular size of the ligand receptors, and the dielectric properties of the ligand-receptor complex. It was found that the GNrMP-based binding affinity calculations were close to the GNR-IgG-anti-IgG complex, which is close to the binding of free IgG-anti IgG. This is a major improvement over the solid-substrate SPR sensor, where the motion of surface-immobilized capturing molecules is restricted and the binding affinity is reduced by 2–3 orders in magnitude. It has also been demonstrated that the selectivity of the GNrMP scheme demonstrated to be in the nano molar range can be improved significantly by a full functionalization protocol to minimize nonspecific binding. The concept and methodology developed in this study can serve as the basis for evaluating detection limits and binding constants for a range of biomolecular complexes.
Acknowledgments
Partial fundings from the Oncological Science Center of Purdue University and Indiana University-Purdue University Indianapolis Walter Center grant is acknowledged for supporting this work.
Editor: David P. Millar.
References
- 1.Turner, A. P. F. 2000. Biosensors: sense and sensitivity. Science. 290:1315–1317. [DOI] [PubMed] [Google Scholar]
- 2.Klotz, I. M. 1997. Ligand Receptor Energetics: A Guide for the Perplexed. Wiley, New York.
- 3.Lee, H. J., T. T. Goodrich, and R. M. Corn. 2001. SPR imaging measurements of 1-D and 2-D DNA microarrays created from microfluidic channels on gold thin films. Anal. Chem. 73:5525–5531. [DOI] [PubMed] [Google Scholar]
- 4.Hall, D. 2001. Use of optical biosensors for the study of mechanistically concerted surface adsorption processes. Anal. Biochem. 288:109–125. [DOI] [PubMed] [Google Scholar]
- 5.Wang, J., X. Cai, G. Rivas, H. Shiraishi, P. A. M. Farias, and N. Dontha. 1996. DNA electrochemical biosensor for the detection of short DNA sequences related to the Human Immunodeficiency Virus. Anal. Chem. 68:2629–2634. [DOI] [PubMed] [Google Scholar]
- 6.Walterbeek, H. T., and A. J. G. M. van der Meer. 1996. A sensitive and quantitative biosensing method for the determination of γ-ray emitting radionuclides in surface water. J. Environ. Radioact. 33:237–254. [Google Scholar]
- 7.Thevenot, D. R., K. Toth, R. A. Durst, and G. S. Wilson. 2001. Electrochemical biosensors: recommended definitions and classification. Biosens. Bioelectron. 16:121–131. [DOI] [PubMed] [Google Scholar]
- 8.Mascini, M., I. Palchetti, and G. Marrazza. 2000. DNA electrochemical biosensors. Fresenius J. Anal. Chem. 369:15–22. [DOI] [PubMed] [Google Scholar]
- 9.Horacek, J., and P. Skladal. 1997. Improved direct piezoelectric biosensors operating in liquid solution for the competitive label-free immunoassay of 2,4-dichlorophenoxyacetic acid. Anal. Chim. Acta. 347:43–50. [Google Scholar]
- 10.Ebersole, R. C., J. A. Miller, J. R. Moran, and M. D. Ward. 1990. Spontaneously formed functionally active avidin monolayers on metal surfaces: a strategy for immobilizing biological reagents and design of piezoelectric biosensors. J. Am. Chem. Soc. 112:3239–3241. [Google Scholar]
- 11.Miller, M. M., P. E. Sheehan, R. L. Edelstein, C. R. Tamanaha, L. Zhong, S. Bounnak, L. J. Whitman, and R. J. Colton. 2001. A DNA array sensor utilizing magnetic microbeads and magnetoelectronic detection. J. Magn. Magn. Mater. 225:138–144. [Google Scholar]
- 12.Chemla, Y. R., H. L. Grossman, Y. Poon, R. McDermott, R. Stevens, M. D. Alper, and J. Clarke. 2000. Ultrasensitive magnetic biosensor for homogeneous immunoassay. Proc. Natl. Acad. Sci. USA. 97:14268–14272. [DOI] [PMC free article] [PubMed] [Google Scholar]
- 13.Raiteri, R., M. Grattarola, H.-J. Butt, and P. Skladal. 2001. Micromechanical cantilever-based biosensors. Sens. Actuators B. 79: 115–126. [Google Scholar]
- 14.Kasemo, B. 1998. Biological surface science. Curr. Opin. Solid State Mater. Sci. 3:451–459. [Google Scholar]
- 15.Yu, C., A. Ganjoo, H. Jain, C. J. Pantano, and J. Irudayaraj. 2006. Mid-IR biosensor: detection and fingerprinting of pathogens on gold island functionalized chalcogenide films. Anal. Chem. 78:2500–2506. [DOI] [PubMed] [Google Scholar]
- 16.Cao, Y. C., R. Jin, and C. A. Mirkin. 2002. Nanoparticles with Raman spectroscopic fingerprints for DNA and RNA detection. Science. 297:1536–1540. [DOI] [PubMed] [Google Scholar]
- 17.Natsume, T., H. Nakayama, and T. Isobe. 2001. BIA–MS–MS: biomolecular interaction analysis for functional proteomics. Trends Biotechnol. 19:S28–S33. [DOI] [PubMed] [Google Scholar]
- 18.Polla, D. L., A. G. Erdman, W. P. Robbins, D. T. Markus, J. Diaz-Diaz, R. Rizq, Y. Nam, H. T. Brickner, A. Wang, and P. Krulevitch. 2000. Microdevices in medicine. Annu. Rev. Biomed. Eng. 2:551–576. [DOI] [PubMed] [Google Scholar]
- 19.Schuck, P. 1997. Use of surface plasmon resonance to probe the equilibrium and dynamic aspects of interactions between biological macromolecules. Annu. Rev. Biophys. Biomol. Struct. 26:541–566. [DOI] [PubMed] [Google Scholar]
- 20.Nath, N., and A. Chilkoti. 2004. Label free colorimetric biosensing using nanoparticles. J. Fluor. 14:377–389. [DOI] [PubMed] [Google Scholar]
- 21.Haes, A., and R. P. van Duyne. 2002. A nanoscale optical biosensor: sensitivity and selectivity of an approach based on the localized surface plasmon resonance spectroscopy of triangular silver nanoparticles. J. Am. Chem. Soc. 124:10596–10604. [DOI] [PubMed] [Google Scholar]
- 22.Nath, N., and A. Chilkoti. 2002. A colorimetric gold nanoparticle sensor to interrogate biomolecular interactions in real time on a surface. Anal. Chem. 74:504–509. [DOI] [PubMed] [Google Scholar]
- 23.Yonzon, C. R., E. Jeoung, S. Zou, G. C. Schatz, M. Mrksich, and R. P. Van Duyne. 2004. A comparative analysis of localized and propagating surface plasmon resonance sensors: the binding of concanavalin A to a monosaccharide functionalized self-assembled monolayer. J. Am. Chem. Soc. 126:12669–12676. [DOI] [PubMed] [Google Scholar]
- 24.Ghosh, S. K., S. Nath, S. Kundu, K. Esumi, and T. Pal. 2004. Solvent and ligand effects on the localized surface plasmon resonance (LSPR) of gold colloids. J. Phys. Chem. B. 108:13963–13971. [Google Scholar]
- 25.Dahlin, A., M. Zach, T. Rindzevicius, M. Kall, D. S. Sutherland, and F. Hook. 2005. Localized surface plasmon resonance sensing of lipid-membrane-mediated biorecognition events. J. Am. Chem. Soc. 127:5043–5048. [DOI] [PubMed] [Google Scholar]
- 26.Raschke, G., S. Kowarik, T. Franzl, C. Sonnichsen, T. A. Klar, J. Feldmann, A. Nichtl, and K. Kurzinger. 2003. Biomolecular recognition based on single gold nanoparticle light scattering. Nano Lett. 3:935–938. [Google Scholar]
- 27.Raschke, G., S. Brogl, A. S. Susha, A. L. Rogach, T. A. Klar, J. Feldmann, B. Fieres, N. Petkov, T. Bein, A. Nichtl, and K. Kurzinger. 2004. Gold nanoshells improve single nanoparticle molecular sensors. Nano Lett. 4:1853–1857. [Google Scholar]
- 28.Lee, S., and H. Perez-Luna. 2005. Dextran-gold nanoparticle hybrid material for biomolecule immobilization and detection. Anal. Chem. 77:7204–7211. [DOI] [PubMed] [Google Scholar]
- 29.Yu, C., and J. Irudayaraj. 2007. Multiplex biosensor using gold nanorods. Anal. Chem. 79:572–579. [DOI] [PubMed] [Google Scholar]
- 30.Perez-Juste, J., I. Pastoriza-Santos, L. M. Liz-Marz'an, and P. Mulvaney. 2005. Gold nanorods: synthesis, characterization and applications. Coord. Chem. Rev. 249:1870–1901. [Google Scholar]
- 31.Millstone, J. E., S. Park, K. Shuford, L. Qin, G. C. Schatz, and C. A. Mirkin. 2005. Observation of a quadrupole plasmon mode for a colloidal solution of gold nanoprisms. J. Am. Chem. Soc. 127:5312–5313. [DOI] [PubMed] [Google Scholar]
- 32.Takahashi, H., Y. Niidome, T. Niidone, K. Kaneko, H. Kawasaki, and S. Yamada. 2006. Modification of gold nanorods using phosphatidylcholine to reduce cytotoxicity. Langmuir. 22:2–5. [DOI] [PubMed] [Google Scholar]
- 33.Pierrat, S., I. Zins, A. Breivogel, and C. Sonnichsen. 2007. Self-assembly of small gold colloids with functionalized gold nanorods. Nano Lett. 7:259–263. [DOI] [PubMed] [Google Scholar]
- 34.Nikoobakht, B., and M. A. El-Sayed. 2003. Preparation and growth mechanism of gold nanorods (NRs) using seed-mediated growth method. Chem. Mater. 15:1957–1962. [Google Scholar]
- 35.Lee, K., and M. A. El-Sayed. 2005. Dependence of the enhanced optical scattering efficiency relative to that of absorption for gold metal nanorods on aspect ratio, size, end-cap shape, and medium refractive index. J. Phys. Chem. B. 109:20331–20338. [DOI] [PubMed] [Google Scholar]
- 36.Chang, J., H. Wu, H. Chen, Y. Ling, and W. Tan. 2005. Oriented assembly of Au nanorods using biorecognition system. Chem. Commun. 8:1092–1094. [DOI] [PubMed] [Google Scholar]
- 37.Caswell, K. K., J. N. Wilson, U. H. F. Bunz, and C. Murphy. 2003. Preferential end-to-end assembly of gold nanorods by biotin-streptavidin connectors. J. Am. Chem. Soc. 125:13914–13915. [DOI] [PubMed] [Google Scholar]
- 38.Thomas, K. G., S. Barazzouk, B. I. Ipe, J. S. T. Shibu, and P. V. Kamat. 2004. Uniaxial plasmon coupling through longitudinal self-assembly of gold nanorods. J. Phys. Chem. B. 108:13066–13068. [Google Scholar]
- 39.Murphy, C. J., T. K. Sau, A. M. Gole, C. J. Orendorff, J. Gao, L. Gou, S. E. Hunyadi, and T. Li. 2005. Anisotropic metal nanoparticles: synthesis, assembly, and optical applications. J. Phys. Chem. B. 109:13857–13870. [DOI] [PubMed] [Google Scholar]
- 40.Lee, K., and M. A. El-Sayed. 2006. Gold and silver nanoparticles in sensing and imaging: sensitivity of plasmon response to size, shape, and metal composition. J. Phys. Chem. B. 110:19220–19225. [DOI] [PubMed] [Google Scholar]
- 41.Kekicheff, P., and O. Spalla. 1994. Refractive index of thin aqueous films confined between two hydrophobic surfaces. Langmuir. 10:1584–1591. [Google Scholar]
- 42.Kandimalla, V. B., N. S. Neeta, N. G. Karanth, M. S. Thakur, K. R. Roshini, B. E. Rani, A. Pasha, and N. G. Karanth. 2004. Regeneration of ethyl parathion antibodies for repeated use in immunosensor: a study on dissociation of antigens from antibodies. Biosens. Bioelectron. 20:903–906. [DOI] [PubMed] [Google Scholar]
- 43.Jun, L. S., C. T. Campbell, T. M. Chinowsky, M. N. Mar, and S. S. Yee. 1998. Quantitative interpretation of the response of surface plasmon resonance sensors to adsorbed films. Langmuir. 14:5636–5648. [Google Scholar]
- 44.Jensen, T. R., K. L. Kelly, A. Lazarides, and J. C. Schatz. 1999. Electrodynamics of noble metal nanoparticles and nanoparticle clusters. J. Cluster Sci. 10:295–317. [Google Scholar]
- 45.Walczak, M. M., C. Chung, S. M. Stole, C. A. Widrig, and M. D. Porter. 1991. Structure and interfacial properties of spontaneously adsorbed n-alkanethiolate monolayers on evaporated silver surfaces. J. Am. Chem. Soc. 113:2370–2378. [Google Scholar]
- 46.Vörös, J. 2004. The density and refractive index of adsorbing protein layers. Biophys. J. 87:553–561. [DOI] [PMC free article] [PubMed] [Google Scholar]
- 47.Murphy, R. M., H. Slayter, P. Schurtenberger, R. A. Chamberlin, C. K. Colton, and M. L. Yarmush. 1988. Size and structure of antigen-antibody complexes. Electron microscopy and light scattering studies. Biophys. J. 54:45–56. [DOI] [PMC free article] [PubMed] [Google Scholar]
- 48.Chevrier, M. C., I. Chateauneuf, M. Guerin, and R. Lemjeux. 2004. Sensitive detection of human IgG in ELISA using a monoclonal anti-IgG-peroxidase conjugate. Hybrid. Hybridomics. 23:362–367. [DOI] [PubMed] [Google Scholar]
- 49.Welschof, M., P. Terness, S. M. Kipriyanov, D. Stanescu, F. Breitling, H. Dorsam, S. Dubel, M. Little, and G. Opelz. 1997. The antigen-binding domain of a human IgG-anti-F(ab′)2 autoantibody. Proc. Natl. Acad. Sci. USA. 94:1902–1907. [DOI] [PMC free article] [PubMed] [Google Scholar]
- 50.Schwille, P., F. J. Meyer-Almes, and R. Rigler. 1997. Dual-color fluorescence cross-correlation spectroscopy for multicomponent diffusional analysis in solution. Biophys. J. 72:1878–1881. [DOI] [PMC free article] [PubMed] [Google Scholar]


