Abstract
In recent years, giant unilamellar vesicles (GUVs) have become objects of intense scrutiny by chemists, biologists, and physicists who are interested in the many aspects of biological membranes. In particular, this “cell size” model system allows direct visualization of particular membrane-related phenomena at the level of single vesicles using fluorescence microscopy-related techniques. However, this model system lacks two relevant features with respect to biological membranes: 1), the conventional preparation of GUVs currently requires very low salt concentration, thus precluding experimentation under physiological conditions, and 2), the model system lacks membrane compositional asymmetry. Here we show for first time that GUVs can be prepared using a new protocol based on the electroformation method either from native membranes or organic lipid mixtures at physiological ionic strength. Additionally, for the GUVs composed of native membranes, we show that membrane proteins and glycosphingolipids preserve their natural orientation after electroformation. We anticipate our result to be important to revisit a vast variety of findings performed with GUVs under low- or no-salt conditions. These studies, which include results on artificial cell assembly, membrane mechanical properties, lipid domain formation, partition of membrane proteins into lipid domains, DNA-lipid interactions, and activity of interfacial enzymes, are likely to be affected by the amount of salt present in the solution.
INTRODUCTION
Since the introduction of the celebrated Singer-Nicolson fluid-mosaic model (1), the current picture of biological membranes has been substantially refined in several aspects. One refinement postulates the existence of a local lateral organization in terms of differentiated membrane domains (2–4). Progress in understanding the lateral organization of biological membranes has been greatly helped by the use of membrane model systems. Particularly in the last few years, giant unilamellar vesicles (GUVs), 20 μm mean diameter, have become very popular membrane model systems because they allow direct visualization of the lateral organization of membranes by means of fluorescence microscopy (5–7). Extensive documentation has appeared in recent years describing the use of GUVs as model systems to study different physical aspects of membranes (lateral structure, mechanical properties), particularly considering the effects of lipid-lipid as well as lipid-DNA, lipid-peptide, and lipid-protein interactions (5–10). One of the reasons why giant vesicles are suitable membrane model systems is their size, on the order of a few tens of micrometers, similar to the size of eukaryotic cells. Because of their size, single vesicles can be directly observed using light microscopy techniques (5,6). One of the important benefits in using GUVs as model systems is the ability to control the molecular composition of the membrane as well as environmental conditions. For instance, studies of the lateral structure of membranes using GUVs were performed with compositions that range from single lipid species or mixtures of a few lipid components up to GUVs composed of natural lipid extracts and native membranes, including those where membrane proteins were incorporated in artificial lipid mixtures (5,7,9,10). The fact that similar experiments can be done using the same model system (GUVs) while increasing the compositional complexity of the membrane allows for comparative structural and dynamic studies between artificial lipid mixtures and the biological membrane of interest (9). However, two main drawbacks regarding GUV preparation are still unsolved: 1), low salt concentration (<10 mM NaCl) must be used during the preparation process (higher ionic strengths impair GUV formation) (11), and 2), GUVs lack membrane asymmetry. These observations hold for the most common GUV preparation protocols, i.e., the electroformation (12) and the gentle hydration (13) methods. Even though it was reported that high proportions of negatively charged lipids (∼15 mol %) in the lipid mixture allow the preparation of vesicles at high salt concentration (14), it is clear that the incorporation of negatively charged lipid species imposes strong limitations in choosing the desired membrane composition. Additionally, a promising protocol was recently reported to generate asymmetric GUVs (15), but an important drawback of this method is the impracticality of incorporating membrane proteins into the GUVs. Recently, the last problem was nicely overcome by the work of Baumgart et al., who generated giant plasma membrane vesicles by inducing plasma membrane vesiculation or “blebbing” (16). However, even though this model system is expected to retain significant leaflet asymmetry, the actual extent of lipid asymmetry of giant plasma membrane vesicles has not been checked so far (16). Additionally, this method is limited to cell plasma membranes, precluding the use of membranes from internal organelles to generate GUVs.
Here we demonstrate that assembly of giant vesicles composed either of native membranes or of lipid mixtures under physiological conditions is possible using a new electroformation protocol. This method circumvents the use of nonphysiological conditions such as water, low-salt, or special sugar solutions generally employed for formation of giant vesicles, which most often are composed of lipids only.
MATERIAL AND METHODS
Materials
1,1′-Dioctadecyl-3,3,3′,3′-tetramethylindocarbocyanine perchlorate (DiIC18), 6-lauroyl-2-(N,N-dimethylamino)naphthalene (Laurdan), Alexa Fluor 488 donkey anti-goat IgG, Alexa Fluor 633 rabbit anti-mouse IgG, Alexa Fluor 488 dextran (3000 mol wt), and Alexa Fluor 633 protein labeling kit were purchased from Invitrogen (Eugene, OR). Mouse IgG anti-human band III was from Sigma (St. Louis, MO). Goat IgG anti-human glycophorin A and blood group A1, A2, A3 antigen mouse monoclonal IgM were obtained from Santa Cruz Biotechnologies (Santa Cruz, CA).
Preparation of human erythrocyte ghosts
Blood (group A) was collected from healthy donors, placed in EDTA tubes (BD Vacutainer Systems, Franklin Lakes, NJ) and washed with 25 mM HEPES, 150 mM NaCl, pH 7.2 buffer. right-side-out (RSO) ghosts were prepared following the method of Steck and Kant (17) and inside-out (IO) ghosts based on the method by Sulpice et al. (18) with some modifications: the hemolyzing solution contained 5 mM KH2PO4, pH 8.0, and the resealed IO ghosts were further purified through a glucose barrier (density = 1.03). At the end of the process, these ghost preparations were resuspended in 20 mM HEPES, 0.5 mM DTT, 1 mM MgCl2, 150 mM KCl, pH 7.2. To obtain ghost preparations loaded with Alexa Fluor 488 dextran (3000 mol wt), all the buffers were supplemented with 15 μg/ml of this fluorescent probe before purification through a glucose barrier. After loading, the ghost preparation was washed several times to remove the nonentrapped probe.
Ghost suspensions were brought to a final lipid concentration (cholesterol plus phospholipids) of ∼2.5 mM (cholesterol, ∼1 mM final concentration, was evaluated by cholesterol concentration measurement kit from BioSystems, Barcelona, Spain, and phospholipid concentration was measured using phosphorus analysis (19)). Lipid extracts from erythrocyte ghosts in organic solvent were obtained as described previously (20). Depending on the experiment, 0.4 mol % of DiIC18 or Laurdan (from DMSO stock solutions of 1.25 mM) with respect to total lipids was added to the samples before GUV formation.
Preparation of GUVs
Giant vesicles were obtained by modifications of a new electroformation protocol proposed by T. Pott and P. Méléard that uses 500-Hz AC fields to generate GUVs composed of single-component phospholipids (T. Pott and P. Méléard, Université de Rennes, personal communication, 2007). A small aliquot (∼1 μl) of erythrocyte ghost suspension (RSO or IO) was deposited onto the Pt electrodes in a special home-made chamber that allows visualization in the microscope (21). The sample was covered to avoid light exposure and allowed to precipitate onto the Pt wires for 5 min. After this last step, 500 μl of 25 mM HEPES, 150 mM NaCl, pH 7.2, was added to the chamber containing the Pt electrodes, and an AC field was applied using a function generator (Vann Draper Digimess Fg 100, Stenson Derby, UK). The application of the AC field has three main steps, all performed at 37°C: 1), frequency 500 Hz, amplitude 106 mV (35 V/m) for 5 min; 2), frequency 500 Hz, amplitude 940 mV (313 V/m) for 20 min; 3), frequency 500 Hz, amplitude 2.61 V (870 V/m) for 90 min. The temperature used for G-ghost electroformation was 37°C.
Formation of GUVs from lipid mixtures in organic solvent follows the traditional protocol previously reported (11), but using the buffer and AC field conditions described above for the G-ghost formation protocol. In the latter case the temperatures used for GUV formation correspond to those at which the different membranes display a single fluid phase (well above the highest phase transition temperature, in our case 40°C for both DOPC/DPPC 3:2 mol and (DOPC:DPPC)/cholesterol (1:1)/20 mol %).
Recognition of the extracellular domain of glycophorin A and cytoplasmic domain of band III were done according to Kaufmann and Tanaka (22). Blood group A antigen mouse monoclonal IgM was labeled with the Alexa Fluor 633 protein-labeling kit. Control experiments showed absence of unspecific binding of the antibodies used against band III and glycophorin A (data not shown). All antibodies were added at a final concentration of 8 μg/ml. After incubation, unbound antibodies were removed by washing the chamber three times with the same buffer used during the electroformation.
Fluorescence microscopy
An inverted confocal/two-photon excitation fluorescence microscope (Zeiss -LSM 510 META NLO, Carl Zeiss, Jena, Germany) was used in our experiments. The excitation wavelengths were 488, 543, and 633 nm (for Alexa 488-, DiIC18-, and Alexa 633-labeled antibodies in one-photon excitation mode). The fluorescence signals for Alexa 488, DiIC18, and Alexa 633 were simultaneously collected using multitrack mode (software from Zeiss) into three (or two, depending of the experiment) different channels using bandpass filters of 520 ± 10 nm, 590 ± 25 nm, and 670 ± 25 nm, respectively. For the Zeiss-LSM 510 META NLO microscope, the Ti:Sa laser used for the two-photon excitation mode was a MaiTai XF-W2S (Broadband Mai Tai with 10 W Millennia pump laser, tunable excitation range 710–980 nm, Spectra Physics, Mountain View, CA). The Laurdan GP images were computed with SimFCS software (Laboratory for Fluorescence Dynamics, Irvine, CA) using fluorescence intensity images obtained simultaneously in the blue and red regions of the probe emission spectra (bandpass filters 428 ± 38 nm and 520 ± 10 nm). The images were obtained using 780 nm as excitation wavelength (under two-photon excitation mode). The objective used in all the experiments was a Zeiss C-Apochromat 40× water immersion, NA 1.2.
RESULTS AND DISCUSSION
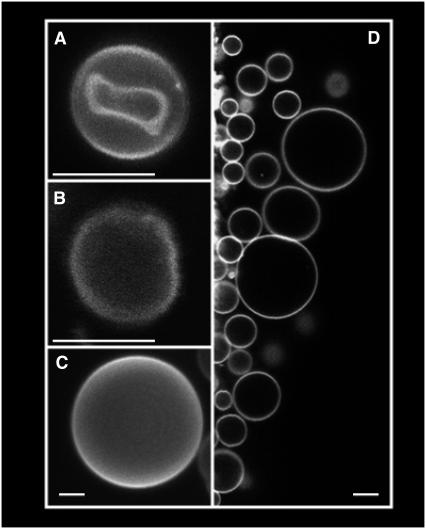
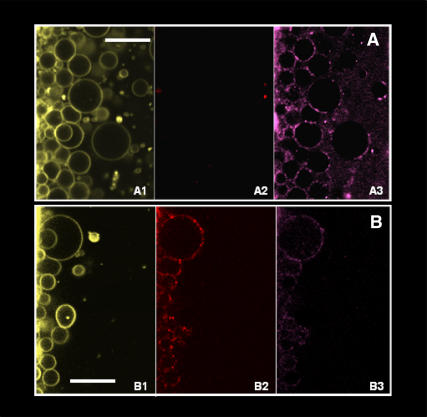
Using a modified version of a new electroformation protocol proposed by T. Pott and P. Méléard (private communication, 2007, see Methods), we succeeded in preparing GUVs starting from intact erythrocyte ghosts under physiological ionic strength conditions (Fig. 1). We named these vesicles RSO giant ghosts (RSO G-ghosts). The new electroformation protocol differs from that proposed by Angelova et al. (12) in the frequency value of the applied AC field, i.e., the 10 Hz used in Angelova's protocol is changed to 500 Hz. The diameters of the obtained RSO G-ghosts range from 10 to 50 μm, and ∼90% of the vesicles are unilamellar. RSO G-ghosts are highly stable and remain intact for several days. To characterize these vesicles, we tested whether relevant erythrocyte membrane proteins and lipids are present in the RSO G-ghost and oriented as in the red blood cell membrane. Two particular membrane proteins from erythrocyte cells were selected to be identified using immunofluorescence labels (see Methods section), i.e., the extracellular domain of glycophorin A and the cytoplasmic domain of band III. Fig. 2 shows a summary of our results. Fig. 2 A shows RSO G-ghost membranes labeled with the hydrophobic fluorescent probe DiIC18 and the specific glycophorin A immunofluorescence marker (A1 and A3, respectively). RSO G-ghosts completely lack the signal corresponding to the band III immunofluorescence marker (Fig. 2 A2). These results suggest that the tested proteins maintain the same orientation as the native red blood cell membrane.
FIGURE 1.
Fluorescent images (false color representation) of DiIC18-labeled red blood cell (A), RSO ghost (B), and RSO G-ghosts (C and D). All the images were obtained at 20°C in 25 mM HEPES, 150 mM NaCl, pH 7.2. The white bars correspond to 5 μm.
FIGURE 2.
(A) Multicolor fluorescence image of RSO G-ghosts in the presence of band III (red, A2) and glycophorin A (magenta, A3) specific immunofluorescence markers (false color representation); the G-ghosts are labeled with DiIC18 lipophilic fluorescent probe (yellow, A1). (B) Multicolor fluorescence image of IO G-ghosts in the presence of band III (red, B2) and glycophorin A (magenta, B3) specific markers. As showed in A, the G-ghosts are labeled with DiIC18 lipophilic fluorescent probe (yellow, B1). The white bars correspond to 30 μm.
To validate the aforementioned hypothesis, i.e., the natural orientation of the proteins in our model system, IO G-ghosts were generated using the same modified electroformation protocol and tested with the specific fluorescent markers against band III and glycophorin A. As shown in Fig. 2 B2, immunofluorescence recognition of band III was positive in the IO G-ghosts. This very relevant result is in contrast to that obtained for RSO G-ghosts, where the fluorescence intensity coming from the immunofluorescence label against band III was absent (see Fig. 2 A2). Additionally, glycophorin A immunofluorescence label was occasionally observed in the IO G-ghost membranes (Fig. 2 B3). The latter result is not unexpected because a fraction of the ghosts obtained using the IO preparation protocol are indeed RSO ghosts (∼20–30% in our preparation (18)). In summary, the experiments shown in Fig. 2 strongly suggest that membrane proteins in the model system preserve the original orientation found in the native biological membrane used for giant vesicle preparation. These results also disregard any effect of the electroformation protocol on the ghost's membrane protein orientation.
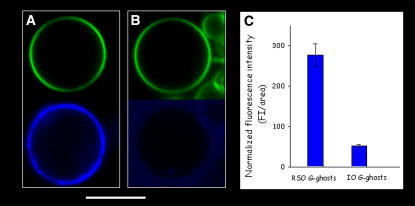
To further test the asymmetric nature of the G-ghost membranes, the orientation of lipid-based blood group antigens was studied in these model membranes. These particular glycosphingolipids (globosides) are present in the outer leaflet of the erythrocyte membrane, and their carbohydrate-based polar headgroups are responsible for blood group specificity (23). Fig. 3 shows representative fluorescent images of RSO and IO G-ghosts (Fig. 3, A and B, respectively) obtained on addition of the immunofluorescence label against blood group A. From Fig. 3, A and B, it is evident that the immunofluorescence label against the globoside is substantially higher in RSO than in IO G-ghosts (although low sporadic binding of the immunofluorescence label is observed in IO G-ghosts because of the presence of RSO ghosts in the IO ghost preparation, see above (18)). The latter observation was confirmed by calculating the average normalized fluorescence intensity from several RSO and IO G-ghosts (over at least 30 individual vesicles) on addition of the immunofluorescence label (Fig. 3 C). The information reported in Fig. 3 strongly indicates that the orientation of the tested lipid is preserved in the RSO G-ghosts. Our observations put forward that these lipids in the G-ghost preserve the asymmetric orientation of the red blood cell membrane, suggesting that the proposed electroformation protocol does not affect the integrity of the native membrane. Additional experiments must be performed to check the full lipid asymmetry in the RSO G-ghosts. For instance, experiments using fluorescently labeled annexin V in the presence of Ca2+ were performed by us to check the asymmetric orientation of PS phospholipids. In this experiment the vesicles were electroformed in the presence of buffer containing Ca2+ and were obtained with as good a yield as the ones obtained with Ca2+-free buffer. However, we found a strong membrane destabilization on annexin V addition, indicated by the presence of fluorescently labeled annexin V inside both the RSO and IO G-ghosts. The latter fact prevented us from correctly assigning inner or outer protein binding to the G-ghost membrane and consequently to obtain reliable information about PS asymmetry (data not shown). Additionally, it is important to remark that Ca2+ activates scramblases in red blood cell membranes that destroy lipid asymmetry (24). Moreover, Ca2+ promotes formation of domains composed exclusively of negatively charged phospholipids in red blood cell membranes, which may affect their membrane distribution (25). The aforementioned facts make it difficult to obtain clear information about phospholipid asymmetry in the G-ghosts using Ca2+-dependent analysis (such as the annexin V experiment). Currently, experiments are being planned to obtain more information about the asymmetric distribution of phospholipids in the G-ghosts.
FIGURE 3.
Fluorescence intensity representative images of RSO (A) and IO (B) G-ghosts in the presence of blood group A specific marker (blue); the G-ghosts are labeled with DiIC18 lipophilic fluorescent probe (green). (C) Normalized average fluorescence intensity observed in RSO and IO G-ghost preparations (obtained over 30 individual vesicles) on addition of the immunofluorescence marker against blood group A (right panel). All the images were obtained at 20°C in 25 mM HEPES, 150 mM NaCl, pH 7.2. The white bar corresponds to 20 μm.
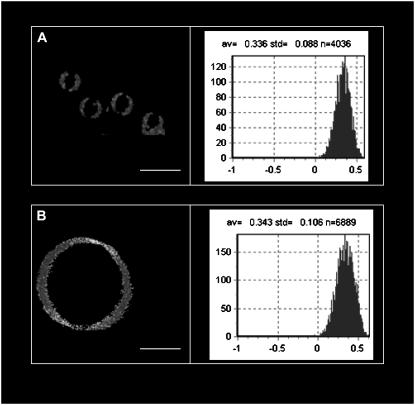
To further characterize the RSO G-ghost preparation method, we decided to ascertain whether the G-ghosts maintain the overall phase state of the biological membrane used for GUV preparation. The membrane phase state is extremely sensitive to the overall membrane composition and constitutes a physiologically relevant physical property for proper membrane function. To evaluate the membrane phase state of the RSO G-ghosts, we measured the Laurdan GP function both in the G-ghosts and in red blood cell membranes using the Laurdan probe. The Laurdan GP function is a parameter that is extremely sensitive to the particular membrane phase state (5). Fig. 4, A and B, shows Laurdan GP images and the corresponding GP histograms for erythrocytes and G-ghosts, respectively. The average Laurdan GP values indicate the presence of a liquid ordered-like phase in both systems (5,26). This observation is in agreement with that previously reported for red blood cell membranes (27). These results show that the erythrocyte membrane phase state is preserved in the RSO G-ghost, suggesting that membrane overall composition is maintained in the RSO G-ghosts after the electroformation protocol.
FIGURE 4.
Laurdan GP images and the corresponding GP histograms obtained for red blood cells (A) and RSO G-ghosts (B). The white bars correspond to 10 μm. All the images were obtained at 20°C in 25 mM HEPES, 150 mM NaCl, pH 7.2.
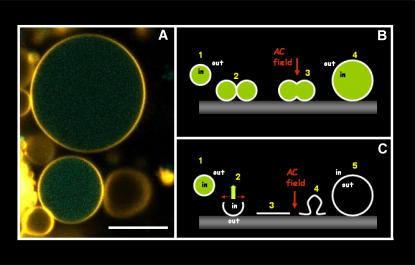
Although some explanations have been proposed in the past (28), the mechanism of giant vesicle formation using electric fields still remains uncertain (11). In particular, we consider it important to understand how the ghost membrane preserved the orientation of the tested membrane proteins and glycosphingolipids during electroformation. Fig. 5 A shows G-ghosts electroformed from ghosts loaded with Alexa 488 dextran (3000 mol wt). We observed that after formation >93% of the G-ghost population (measured over 125 vesicles) is still loaded with Alexa 488 dextran. Based on this latter result and on the fact that G-ghosts maintain the same membrane protein and globoside orientation as the one occurring in the native membrane utilized for giant vesicle formation (Figs. 2 and 3), we conclude that leakage-free ghost fusion is an important event during electroformation. This mechanism is able to explain both why G-ghosts preserve the original membrane protein and globoside orientations and why the fluorescent dextran is kept inside the vesicles (Fig. 5 B). In particular, we reasoned that it is very unlikely that the G-ghosts are formed by electroswelling of planar membranes generated after ghost explosion on the surface of the platinum electrode (Fig. 5 C). The explosion event (proposed previously for the formation of planar membranes composed of erythrocyte ghosts on silica beads (22)) will produce formation of unloaded G-ghosts with opposite membrane protein and globoside orientations with respect to those of the native membrane utilized in the G-ghost formation protocol (Fig. 5 C). The results reported in Figs. 2, 3, and 5 A show exactly the opposite. Additionally, the results obtained in Figs. 2 and 3 also rule out the possibility that the RSO G-ghosts are formed from ghost membrane patches with different orientations.
FIGURE 5.
(A) Fluorescence intensity image (false color representation) of DiIC18-labeled RSO G-ghosts (yellow) electroformed from erythrocyte ghosts loaded with Alexa 488 dextran (3000 mol wt, green). Notice that the fluorescent dextran remains entrapped in the G-ghosts after electroformation. (B and C) Sketches of the possible mechanisms proposed for G-ghost electroformation. Based on the results reported in Figs. 2, 3, and 5 A, the mechanism described in panel C is excluded (see text). The white bar corresponds to 20 μm.
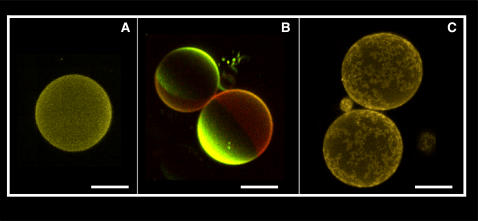
Finally, the new formation protocol presented here was also successfully applied to form GUVs from stocks of artificial and natural lipid mixtures in organic solvents. Preparation of GUVs composed of lipid extracts from erythrocyte ghosts and artificial lipid mixtures displaying liquid ordered/liquid disordered and gel/fluid phase coexistence are shown in Fig. 6 (A, B, and C, respectively). Although in these preparations the membrane does not show compositional asymmetry (because the lipids are previously mixed in organic solvent before GUV preparation), the vesicles are formed in buffer at physiological ionic strength. To our knowledge, this is the first time that an electroformation-based GUV formation protocol has been successfully applied at physiologically relevant ionic strength conditions to generate GUVs composed of artificial lipid mixtures.
FIGURE 6.
Fluorescence images (false color representation) of DiIC18-labeled GUVs composed of red blood cell membrane lipid extracts (A). Laurdan-labeled GUVs composed of (DOPC:DPPC)/cholesterol ((1:1)/20 mol %); red and green areas correspond to liquid-ordered and liquid-disordered phases, respectively (B). DiIC18-labeled GUVs composed of POPC/DPPC 3:2 mol (C); the high-fluorescence-intensity areas correspond to DPPC-rich gel phase. All the images were obtained at 20°C in 25 mM HEPES, 150 mM NaCl, pH 7.2. The white bar corresponds to 10 μm.
In conclusion, the possibility to generate GUVs composed of native membranes (including plasma membrane and membranes from internal cell organelles) as well as GUVs composed of lipid mixtures of any desired composition under physiologically relevant conditions using the proposed protocol, opens exciting opportunities to design new experiments and reexamine observations reported in previous studies using GUVs in low-salt, water, or sugar solutions. For example, results on artificial cell assembly, membrane mechanical properties, lipid phase diagrams, partition of membrane proteins in different lipid phases, DNA/lipid interactions, and activity of interfacial enzymes obtained in GUVs devoid of salts (5–10) are likely to be influenced by the presence of high-ionic-strength conditions, promoting changes in the system final scenario. In addition, we envisage an important application of this new electroformation protocol to perform simultaneous electrophysiological/membrane lateral structure studies. The presence of salts in this type of experiments is crucial and can be easily accomplished using the new electroformation method proposed here.
Acknowledgments
The authors thank Helene Bouvrais, Dr. T. Pott, and Dr. P. Méléard for providing the original 500-Hz electroformation protocol.
Research in the laboratory of L.A.B. is funded by a grant from Research in the laboratory of L.A.B. is funded by a grant from Forskningsrådet for Natur og Univers, Denmark (272-06-0511), and the Danish National Research Foundation (which supports MEMPHYS Center for Biomembrane Physics). The authors are also grateful to the Spanish Ministerio de Educación y Ciencia for grants No. BFU 2005-0695 (A.A.) and BFU 2004-02955 (F.M.G.), and to the University of the Basque Country for grant No. GIU06/42 (F.M.G.).
Editor: Michael Edidin.
References
- 1.Singer, S. J., and G. L. Nicolson. 1972. The fluid mosaic model of the structure of cell membranes. Science. 175:720–731. [DOI] [PubMed] [Google Scholar]
- 2.Edidin, M. 2003. The state of lipid rafts: from model membranes to cells. Annu. Rev. Biophys. Biomol. Struct. 32:257–283. [DOI] [PubMed] [Google Scholar]
- 3.Simons, K., and W. L. Vaz. 2004. Model systems, lipid rafts, and cell membranes. Annu. Rev. Biophys. Biomol. Struct. 33:269–295. [DOI] [PubMed] [Google Scholar]
- 4.Mukherjee, S., and F. R. Maxfield. 2004. Membrane domains. Annu. Rev. Cell Dev. Biol. 20:839–866. [DOI] [PubMed] [Google Scholar]
- 5.Bagatolli, L. A. 2006. To see or not to see: lateral organization of biological membranes and fluorescence microscopy. Biochim. Biophys. Acta. 1758:1541–1556. [DOI] [PubMed] [Google Scholar]
- 6.Menger, F. M., and J. S. Keiper. 1998. Chemistry and physics of giant vesicles as biomembrane models. Curr. Opin. Chem. Biol. 2:726–732. [DOI] [PubMed] [Google Scholar]
- 7.Veatch, S. L., and S. L. Keller. 2005. Seeing spots: complex phase behavior in simple membranes. Biochim. Biophys. Acta. 1746:172–185. [DOI] [PubMed] [Google Scholar]
- 8.Ambroggio, E. E., F. Separovic, J. H. Bowie, G. D. Fidelio, and L. A. Bagatolli. 2005. Direct visualization of membrane leakage induced by the antibiotic peptides: maculatin, citropin, and aurein. Biophys. J. 89:1874–1881. [DOI] [PMC free article] [PubMed] [Google Scholar]
- 9.Bernardino de la Serna, J., J. Perez-Gil, A. C. Simonsen, and L. A. Bagatolli. 2004. Cholesterol rules: direct observation of the coexistence of two fluid phases in native pulmonary surfactant membranes at physiological temperatures. J. Biol. Chem. 279:40715–40722. [DOI] [PubMed] [Google Scholar]
- 10.Kahya, N., and P. Schwille. 2006. Fluorescence correlation studies of lipid domains in model membranes. Mol. Membr. Biol. 23:29–39. [DOI] [PubMed] [Google Scholar]
- 11.Bagatolli, L. A., T. Parasassi, and E. Gratton. 2000. Giant phospholipid vesicles: comparison among the whole lipid sample characteristics using different preparation methods: a two photon fluorescence microscopy study. Chem. Phys. Lipids. 105:135–147. [DOI] [PubMed] [Google Scholar]
- 12.Angelova, M., S. Soléau, P. Meléard, J. Faucon, and P. Bothorel. 1992. Preparation of giant vesicles by external AC fields. Kinetics and application. Prog. Colloid Polym. Sci. 89:127–131. [Google Scholar]
- 13.Reeves, J. P., and R. M. Dowben. 1969. Formation and properties of thin-walled phospholipid vesicles. J. Cell. Physiol. 73:49–60. [DOI] [PubMed] [Google Scholar]
- 14.Akashi, K., H. Miyata, H. Itoh, and K. Kinosita, Jr. 1996. Preparation of giant liposomes in physiological conditions and their characterization under an optical microscope. Biophys. J. 71:3242–3250. [DOI] [PMC free article] [PubMed] [Google Scholar]
- 15.Pautot, S., B. J. Frisken, and D. A. Weitz. 2003. Engineering asymmetric vesicles. Proc. Natl. Acad. Sci. USA. 100:10718–10721. [DOI] [PMC free article] [PubMed] [Google Scholar]
- 16.Baumgart, T., A. T. Hammond, P. Sengupta, S. T. Hess, D. A. Holowka, B. A. Baird, and W. W. Webb. 2007. Large scale fluid/fluid phase separation of proteins and lipids in giant plasma membrane vesicles. Proc. Natl. Acad. Sci. USA. 104:3165–3170. [DOI] [PMC free article] [PubMed] [Google Scholar]
- 17.Steck, T. L., and J. A. Kant. 1974. Preparation of impermeable ghosts and inside-out vesicles from human erythrocyte membranes. Methods Enzymol. 31:172–180. [DOI] [PubMed] [Google Scholar]
- 18.Sulpice, J. C., A. Zachowski, P. F. Devaux, and F. Giraud. 1994. Requirement for phosphatidylinositol 4,5-bisphosphate in the Ca(2+)-induced phospholipid redistribution in the human erythrocyte membrane. J. Biol. Chem. 269:6347–6354. [PubMed] [Google Scholar]
- 19.Böttcher, C., C. van Gent, and C. Fries. 1961. A rapid and sensitive sub-micro phosphorous determination. Anal. Chim. Acta. 1061:297–303. [Google Scholar]
- 20.Bligh, E. G., and W. J. Dyer. 1959. A rapid method of total lipid extraction and purification. Can. J. Biochem. Physiol. 37:911–917. [DOI] [PubMed] [Google Scholar]
- 21.Fidorra, M., L. Duelund, C. Leidy, A. C. Simonsen, and L. A. Bagatolli. 2006. Absence of fluid-ordered/fluid-disordered phase coexistence in ceramide/POPC mixtures containing cholesterol. Biophys. J. 90:4437–4451. [DOI] [PMC free article] [PubMed] [Google Scholar]
- 22.Kaufmann, S., and M. Tanaka. 2003. Cell adhesion onto highly curved surfaces: one-step immobilization of human erythrocyte membranes on silica beads. ChemPhysChem. 4:699–704. [DOI] [PubMed] [Google Scholar]
- 23.Hakomori, S. 1999. Antigen structure and genetic basis of histo-blood groups A, B and O: their changes associated with human cancer. Biochim. Biophys. Acta. 1473:247–266. [DOI] [PubMed] [Google Scholar]
- 24.Bevers, E. M., T. Wiedmer, P. Comfurius, J. Zhao, E. F. Smeets, R. A. Schlegel, A. J. Schroit, H. J. Weiss, P. Williamson, and R. F. Zwaal. 1995. The complex of phosphatidylinositol 4,5-bisphosphate and calcium ions is not responsible for Ca(2+)-induced loss of phospholipid asymmetry in the human erythrocyte: a study in Scott syndrome, a disorder of calcium-induced phospholipid scrambling. Blood. 86:1983–1991. [PubMed] [Google Scholar]
- 25.Haverstick, D. M., and M. Glaser. 1987. Visualization of Ca2+-induced phospholipids domains. Proc. Natl. Acad. Sci. USA. 84:4475–4479. [DOI] [PMC free article] [PubMed] [Google Scholar]
- 26.Dietrich, C., L. A. Bagatolli, Z. N. Volovyk, N. L. Thompson, M. Levi, K. Jacobson, and E. Gratton. 2001. Lipid rafts reconstituted in model membranes. Biophys. J. 80:1417–1428. [DOI] [PMC free article] [PubMed] [Google Scholar]
- 27.Parasassi, T., E. Gratton, W. M. Yu, P. Wilson, and M. Levi. 1997. Two-photon fluorescence microscopy of Laurdan generalized polarization domains in model and natural membranes. Biophys. J. 72:2413–2429. [DOI] [PMC free article] [PubMed] [Google Scholar]
- 28.Angelova, M. I., and D. S. Dimitrov. 1988. A mechanism of liposome electroformation. Prog. Colloid Polym. Sci. 76:59–67. [Google Scholar]


