Abstract
The β→α transition of β-lactoglobulin, a globular protein abundant in the milk of several mammals, is investigated in this work. This transition, induced by the cationic surfactant dodecyltrimethylammonium chloride (DTAC), is accompanied by partial unfolding of the protein. In this work, unfolding of bovine β-lactoglobulin in DTAC is compared with its unfolding induced by the chemical denaturant guanidine hydrochloride (GnHCl). The final protein states attained in the two media have quite different secondary structure: in DTAC the α-helical content increases, leading to the so-called α-state; in GnHCl the amount of ordered secondary-structure decreases, resulting in a random coil-rich final state (denatured, or D, state). To obtain information on both mechanistic routes, in DTAC and GnHCl, and to characterize intermediates, the kinetics of unfolding were investigated in the two media. Equilibrium and kinetic data show the partial accumulation of an on-pathway intermediate in each unfolding route: in DTAC, an intermediate (I1) with mostly native secondary structure but loose tertiary structure appears between the native (β) and α-states; in GnHCl, another intermediate (I2) appears between states β and D. Kinetic rate constants follow a linear Chevron-plot representation in GnHCl, but show a more complex mechanism in DTAC, which acts like a stronger binding species.
INTRODUCTION
Conformational transitions of labile proteins (which easily undergo radical changes in their secondary/tertiary structures) occasionally lead to misfolding and consequent self-association or accumulation in cells, causing the so-called “conformational diseases” (1). An example is the prion protein (PrP), which can trigger infectious neurodegenerative diseases such as the human Creutzfeldt-Jakob's disease and the bovine spongioform encephalopathy (1,2). These disorders originate in a conformational transition of PrP in which part of the α-helices change into β-sheets (2). The study of this α-helix to β-sheet transition (α→β), in several proteins, has thus become an important topic of research to better understand the in vivo folding and misfolding and the physiological function of these proteins (3).
An α→β transition also occurs in the in vivo folding process of β-lactoglobulin (4–6), a protein abundant in the milk of several mammals. Bovine β-lactoglobulin has thus been frequently chosen as a model protein to clarify the mechanism of the α→β (or β→α) transition(s).
The globular conformation of the native state of β-lactoglobulin (BLG) (see Fig. 10 below) results mainly from a central β-barrel, formed by eight antiparallel β-strands (βA−βH) shaped into a flattened cone, or calyx (7); outside the calyx lie one further β-strand (βI), one α-helix, and four short 310-helices (3).
FIGURE 10.
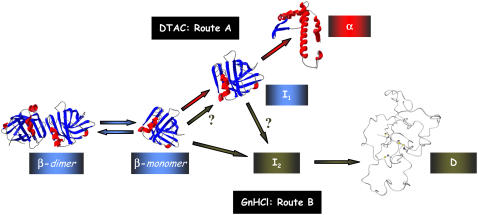
Pictorial illustration of the detected conformational states of β-lactoglobulin, and their mechanistic interrelation, for the two unfolded routes investigated: (A) DTAC-induced unfolding to state α; (B) GnHCl-induced unfolding to state D. The drawings for the native state (β-dimer and β-monomer) were generated with the coordinates of the file 1BEB of the Protein Data Bank (PDB) using the software Deep View Swiss PDB Viewer (DVSV). A picture of state-α was obtained by applying the software DVSV to the same 1BEB file, but including the structural changes described by Kuwata et al. (3), induced in BLG by trifluoroethanol. The image for state D was reproduced from Kuwata et al. (38). State I2 is not illustrated by a picture, because its characteristics could not be found in this work. Color legend is as follows: the α-helices are represented in red, the β-strands in blue, and the random coil in gray; the meaning of the arrow colors is given in the text.
The quaternary structure of BLG in water above pH ≈ 3 (but depending on the protein concentration, ionic strength, and temperature) is a dimer (8), where the monomer units, bound noncovalently through their βI-strands, retain their native secondary and tertiary structures (7). Below pH ≈ 3, BLG is generally monomeric (8).
BLG is a labile protein in what refers to its secondary structure because, even though being mainly a β-sheet protein when native, a significant number of its residues have a marked α-helical propensity (4,5). The so-called “α-state” of BLG (containing a large amount of α-helices) was confirmed to be induced by 2,2,2-trifluoroethanol, by NMR measurements (3). The interaction with some other alcohols and organic solvents also increases the protein α-helical content (see, e.g., the literature (9–14)). Furthermore, this behavior was observed in the presence of phospholipid bilayers (15) and synthetic mixed micelles and vesicles used as models of cell membranes (16). These latter studies (15,16) aimed at a deeper understanding on the interaction of BLG with biological membranes.
In previous work (16), we investigated secondary- and tertiary-structure changes of BLG, in equilibrium conditions. The α-helix and β-sheet contents of the protein were estimated by far-UV CD spectroscopy; whereas changes in tertiary structure were investigated by near-UV CD and steady-state fluorescence techniques, sensing the environment of the tryptophans (Trp-19 and Trp-61). It was found that both mixed micelles and vesicles, formed spontaneously in the bicationic surfactant system DDAB-DTAC (didodecyldimethylammonium bromide–dodecyltrimethylammonium chloride; (17,18)), induce a β→α transition in BLG and stabilize the nonnative, partially unfolded, α-state of the protein (16).
In pure DTAC media, higher surfactant concentrations were needed to induce the β→α transition of BLG than those needed to (partially) unfold the protein. This noncoincidence on the evolution of secondary- and tertiary-structure changes suggests the accumulation of an intermediate (I1) between states β and α of BLG. However, the nature of state I1 could not be found from equilibrium data alone (16).
The purpose of this work is to complement previous equilibrium studies of the β→α transition of BLG, induced by DTAC, with a detailed kinetic investigation of the corresponding unfolding route. The transition, initiated by means of a stopped-flow device, was followed through the fluorescence of the two BLG tryptophans.
Previous spectroscopic characterization of BLG (16) showed that the nature of the α-state is quite different from that of the completely unfolded state (D) induced by the chemical denaturant guanidine hydrochloride (GnHCl). Therefore, in this work, we also investigate the kinetics of the two BLG unfolding routes: route A, induced by the surfactant DTAC, leading to the α-state; and route B, induced by the denaturant GnHCl, producing the D-state.
A detailed characterization of the equilibrium and kinetic intermediates of BLG will be of interest to understand the role of local and nonlocal interactions along the protein unfolding route(s). Analysis of equilibrium data of BLG in DTAC was addressed in our previous article (16). Therefore, we only present herein a short description of the main equilibrium results in DTAC, and compare them with those in GnHCl. On the other hand, unfolding kinetics of BLG are described with some detail in the two media. In this work, we obtain information not only on the rates of the unfolding phases but also on the fluorescence properties of all states (initial, intermediate, and final), as a function of the concentration of the “unfolding agents”, DTAC and GnHCl. Finally, we compare the mechanistic pathways leading to the different protein states α and D.
MATERIALS AND METHODS
Materials
The protein BLG, a mixture of the bovine variants A and B, was purchased from Sigma (St. Louis, MO) with ≈90% purity, as determined by polyacrylamide gel electrophoresis. The surfactant DTAC was purchased from TCI (Tokyo Kasei, Japan) as an ion-pair chromatographic reagent, with purity ≥98%, and the denaturant GnHCl was obtained from Gibco Life Sciences (Gaithersburg, MD) or from Invitrogen (puritiy ≥99%). Buffers were prepared with Na2HPO4 (≥97% pure) and NaH2PO4 (≥98% pure) from BDH, to obtain a final pH of 7; or with HCl (37% solution, from Merck, Rahway, NJ) and KCl (≥99.5% pure, from Fluka, Milwaukee, WI) to obtain a final pH of 2. All compounds were used as purchased, without further purification. Freshly bidistilled (Millipore, Billerica, MA) water was used in all samples.
Sample preparation
β-Lactoglobulin solutions
Concentrated aqueous solutions of BLG (with approximately twice the final concentration) were stored in the refrigerator, and used within two days to prepare the final samples in water.
DTAC solutions
DTAC samples were prepared from a stock aqueous solution above the critical micelle concentration, stored at room temperature. The measured pH in the final samples (6.0−6.5) was above the BLG isoelectric point, pI ≈ 5.2.
GnHCl solutions
Equilibrium experiments were performed in 0.1 M phosphate buffer, pH = 7, from stock solutions (≈8 M in GnHCl) kept at room temperature. For kinetic experiments, GnHCl stock solutions (≈8 M) were prepared without buffers and stored in the refrigerator; the final (diluted) GnHCl solutions (with a measured pH ≈ 5.0−6.0) were stored in the refrigerator.
Spectral and kinetic measurements
UV-visible absorption
Absorption spectra of BLG were obtained in the near-UV (240−340 nm) on a Jasco V-560 UV-visible absorption spectrometer, using a quartz cell with an optical path of 1 cm. These spectra were used to calibrate the protein concentration, using a molar extinction coefficient ɛ = 17,600 M−1 cm−1 for the monomeric BLG in water at 280 nm (19).
Circular dichroism spectra
CD spectra of BLG were obtained on a Jasco J-720 spectropolarimeter. The secondary structure was followed in the far-UV (190−260 nm for DTAC solutions, and 215−260 nm for GnHCl solutions), using a protein concentration of ≈10 μM (in monomer) and an optical path of 2 mm. The tertiary structure was observed in the near-UV (250−330 nm) with a BLG monomeric concentration of 40−100 μM and an optical path of 1 cm. A mean of five spectra was averaged for each solution. Baseline correction was performed by subtracting the corresponding solvent spectrum from each sample spectrum. The results were expressed as molar ellipticity per monomer unit of the protein, [θ].
In the case of DTAC solutions, the fraction of each main secondary-structure element (α-helix, β-sheet, β-turn, random coil, etc.) was evaluated by deconvolution of the far-UV CD spectra, using the self-consistent algorithm SELCON3 (20,21) from the program package “Dicroprot 2000” downloaded from the internet (22). However, because of the limited far-UV spectral range used in the case of GnHCl solutions, only an estimation of the fraction of α-helical secondary structure could be obtained from the ellipticity at 222 nm, [θ]222.
Steady-state fluorescence
Fluorescence spectra of BLG for the main equilibrium studies were obtained on a Perkin-Elmer LS-50B luminescence spectrometer; later on, a Spex Fluorolog Tau-3-11 luminescence spectrometer, from Horiba Jobin-Yvon (configured for steady-state conditions), was used for most of equilibrium and all kinetic runs. The BLG tryptophans were excited selectively at 293 ± 2 nm, and the emission was collected from 300 to 450 nm. To obtain relative emission intensities in a set of experiments, all operating conditions (excitation and emission slits, etc.) were kept constant.
The signal/noise ratio of the Fluorolog, as determined by the Raman peak of water (23), was usually ≈500−900.
Stopped-flow/fluorescence
Unfolding kinetic runs were initiated by a stopped-flow mixer, the RX2000 from Applied Photophysics (Leatherhead, UK). The drive syringes (permitting a 1:1 mixing ratio), the connecting tubes, and the stopped-flow cell were maintained at a controlled temperature of 25.0 ± 0.1°C in all essays.
The observation silica cell (with an excitation optical path of 1 cm) was placed in a standard cell holder of the Spex luminescence spectrometer described above, operated in the time-drive mode. The tryptophans were excited selectively at 293 ± 2 nm; the emission was collected at 340 ± 4 or 340 ± 8 nm, for the DTAC-induced unfolding, and at 370 ± 12 nm for the GnHCl-induced unfolding runs.
Baseline intensities were also recorded from the stopped-flow cell, in the same conditions as for the corresponding kinetic runs. To compare a set of traces performed in the same day, excitation and emission slits were kept constant.
The dead-time of the stopped-flow unit (due to driving/mixing time) is ≈6 ms. The fluorimeter has a maximum data acquisition rate of 1 point per 1 ms.
Differential rate equations corresponding to chosen kinetic mechanisms were integrated numerically with a fourth-order Runge-Kutta algorithm, using the program BerkeleyMadonna (Berkeley Madonna, Berkeley, CA), version 8.3.9 for Windows, developed by R. I. Macey and G. F. Oster. The fitting of the experimental data to the integrated rate equations was also performed by the same program, which can be downloaded from the internet (24).
RESULTS AND DISCUSSION
Equilibrium studies
The native state of BLG in water consists mostly of antiparallel β-strands, as proved by its far-UV CD spectrum (Fig. 1 A, curve 1) (see, e.g., Drake (25) for CD spectra of the most typical protein secondary-structure elements). This state (see Fig. 10 below) will thus be referred to by the β (or N) state.
FIGURE 1.
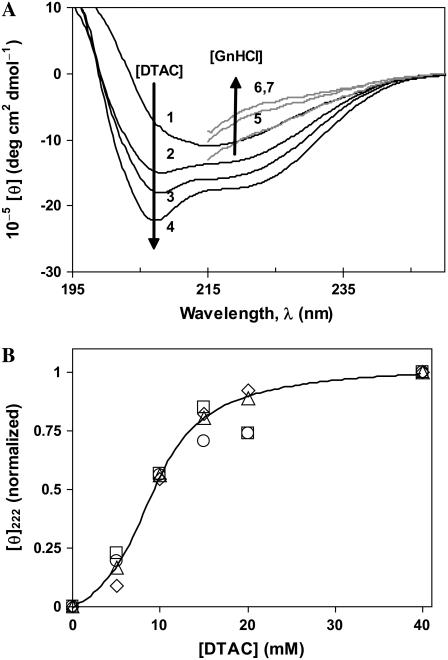
(A) Far-UV CD spectra of β-lactoglobulin in water (1), DTAC aqueous solutions (2−4), and GnHCl solutions at pH ≈ 7 (5−7). [θ] is the molar ellipticity per monomeric protein. [DTAC] = 10, 18, and 40 mM for curves 2−4, respectively; [GnHCl] = 3, 4, and 5 M for curves 5−7, respectively. (B) Effect of the protein concentration on the evolution of [θ]222 versus [DTAC], normalized at [DTAC] = 40 mM (micelle region), where the α-helical content is stabilized. [BLG] = 2 (⋄), 5 (▵), 10 (□), and 20 μM (○). The sigmoidal curve through the data is a guide to the eye.
BLG attains quite different equilibrium conformations in the two investigated media: In the detergent DTAC (Fig. 1 A, curves 2−4), the protein α-helical content increases considerably at the expense of its native β-sheet content, forming the so-called α-state. In the chemical denaturant GnHCl (curves 5−7), the amount of “ordered” secondary-structural elements (β-strands and α-helices) strongly decreases, resulting in a random coil-rich final state: the denatured or D-state.
The β→α transition in DTAC is independent of the protein concentration in the range 2−20 μM (Fig. 1 B): indeed, within the experimental error, all normalized data of [θ]222 versus [DTAC] (for [DTAC] = 5−40 mM) approximately fall on the same sigmoidal curve. This likely means that, for [DTAC] ≥ 5 mM, the oligomeric equilibrium dimer↔monomer (βdim↔βmon) is strongly shifted to the BLG monomer.
Fig. 2 illustrates tertiary-structure changes of BLG, induced by DTAC and GnHCl, when observed through the fluorescence of the intrinsic trytophans.
FIGURE 2.
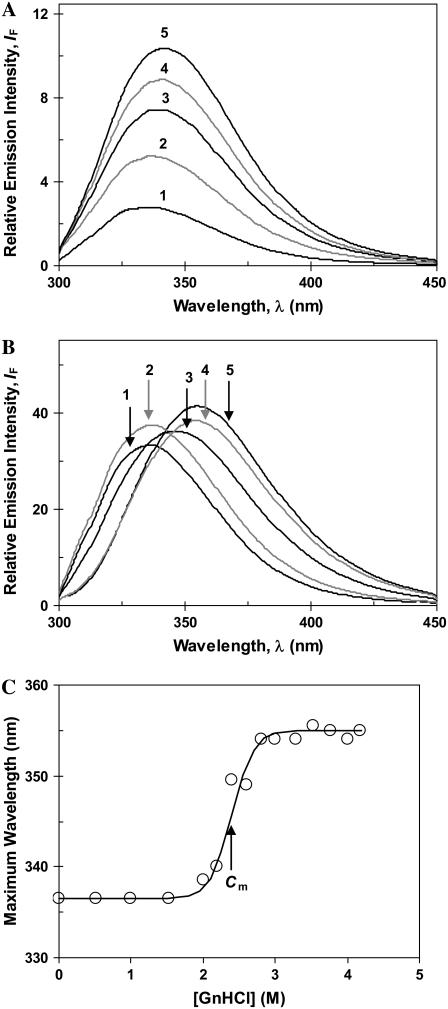
(A) Fluorescence spectra of β-lactoglobulin in water (1) and in DTAC aqueous solutions: [DTAC] = 3.75, 10, 15, and 30 mM for curves 2−5, respectively. (Adapted from Viseu et al. (16)). (B) Fluorescence spectra of β-lactoglobulin in water (1) and in GnHCl solutions, at pH ≈ 7: [GnHCl] = 2.1, 2.6, 3.0, and 6.1 M for curves 2−5, respectively. (C) Wavelength of maximum emission (λF-max) as a function of the GnHCl concentration. In panel C, the data were fitted to Eq. 1a of the text.
About 80% of the spectral emission intensity of the native BLG has been attributed (26) to Trp-19 (embedded in a hydrophobic environment, at the bottom of the calyx), and the other 20% to the more surface-exposed Trp-61 (located at the dimer interface). The combined spectrum (Fig. 2 A, curve 1) has a maximum emission wavelength (λF-max) at ≈329 nm (see Fig. 4 A below), which reflects a medium of global low polarity sensed by these residues (27). Its low emission quantum yield has been attributed to the quenching of Trp-61, either by the nearby Cys-66−Cys-160 disulfide bond (28) and/or by the Trp-61 of the other monomer subunit (29).
FIGURE 4.
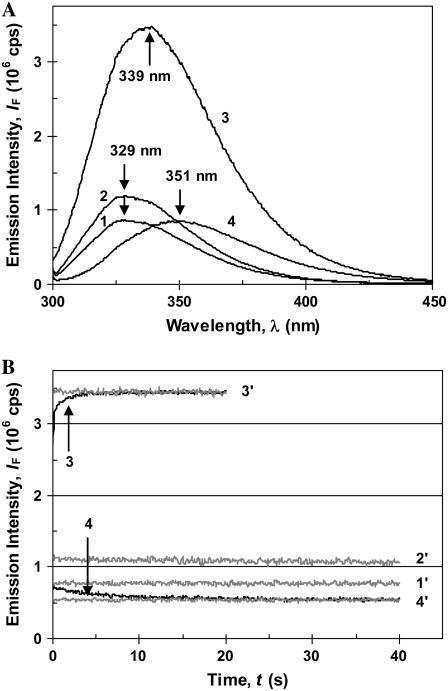
(A) Emission spectra of the main β-lactoglobulin conformations are: (1) native dimer in water, pH ≈ 6 (βdim); (2) native monomer in water, pH = 2.2 (βmon); (3) state-α, in DTAC micelles ([DTAC] = 25 mM), pH ≈ 6.5; and (4) state D, in 4 M GnHCl, pH ≈ 6.5. (B) Unfolding kinetics of β-lactoglobulin with λexc = 293 nm and λem = 340 nm (curves in black) in 25 mM DTAC (3) and in 4 M GnHCl (4). The kinetic baselines obtained in the stopped-flow cell are shown for comparison (curves in gray): (1′) in water, pH ≈ 6.5, for the native dimer (βdim); (2′) in water, pH = 2.2, for the native monomer (βmon); (3′) in 25 mM DTAC, after stabilization of state α; and (4′) in 4 M GnHCl, after stabilization of state D.
Even though the maximum emission wavelength is only slightly red-shifted in the presence of DTAC (to ≈339 nm; see Fig. 4 A below), the emission intensity (IF) drastically increases (Fig. 2 A, curves 2−5) up to the micelle region (CMC = 22−22.5 mM (18)). This significant increase in IF can be explained by a less quenched Trp-61 in state α than in the native protein; and it also suggests that state α is less compact than state N, according to our near-UV CD data (16).
This tertiary-structure transition is independent of the protein concentration, in the range of 2−20 μM: indeed, and except for very low DTAC contents (≈5 mM), all normalized IF data approximately fall on the same curve (not shown herein). This also favors the above hypothesis that the equilibrium βdim↔βmon is strongly deviated to the βmon state, for [DTAC] ≥ 5 mM.
When the denaturant GnHCl is present, IF increases, but much less than in DTAC (Fig. 2 B), suggesting that the BLG tryptophans (or, at least, Trp-61) are still quenched. A marked red shift, up to λF-max ≈ 351 nm, is observed in this medium (see Fig. 4 A below), indicating a complete exposure of the trytophans to water (30). So, it is likely that BLG becomes completely unfolded at high GnHCl concentrations (reaching the D-state).
This significant shift in λF-max clearly defines the tertiary-structure transition of BLG induced by GnHCl, as illustrated in Fig. 2 C. The data follow a sigmoidal curve, which was fitted to a Boltzmann-type function, Eq. 1a, applicable to two-state transitions (see, e.g., Fersht (31)):
 |
(1a) |
In Eq. 1a, Y is the value of the spectroscopic property; YN and YD are the values of Y for the protein initial and final states, N and D; C is the molar concentration of the denaturant; Cm is its midpoint transition concentration (where 50% of the protein molecules are in each state, N or D); and m is a parameter related to the transition cooperativity: it is proportional to the fraction of amino-acid residues exposed to the solvent during the transition, and thus to the slope of the curve in the transition region.
Even though a two-state transition is only a broad approximation in our case (as seen below), we used Eq. 1a to fit our equilibrium data in GnHCl because they follow a sigmoidal trend. The fitted values of YN (336.5 nm) and YD (355 nm) compare very well with the experimental ones, taken from Fig. 2 C. The value for the transition mid-point, Cm = 2.40 M, agrees with that obtained by Hamada and Goto, 2.4 M, detected by the change in the ellipticity at 295 nm (6). For the cooperativity parameter, we obtained the value m = 16.5 kJ mol−1 M−1.
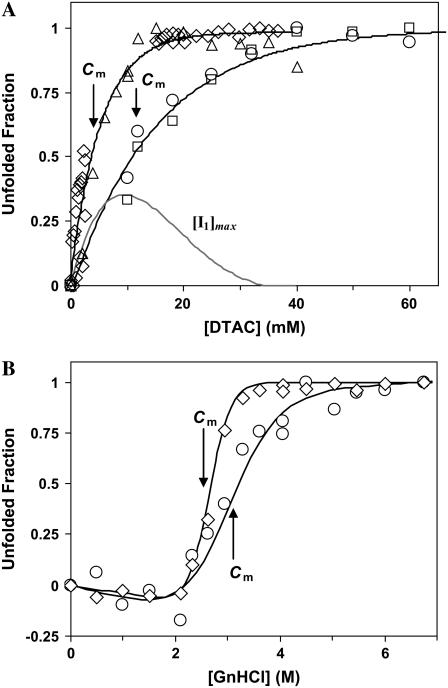
All these results (as well as near-UV CD spectra, not shown) confirm that BLG unfolds completely in GnHCl, attaining the unordered D-state (16,32), but only partially in DTAC, forming the loose α-state (16). Comparing Fig. 3, A (for DTAC) and B (for GnHCl), it is seen that the transition in DTAC spans a concentration range of only ∼50 mM (from ≈0 to ≈50 mM), whereas the one in GnHCl spans a much wider range, of ∼1 M (from ≈2 to ≈3 M). This means that the β→α transition in DTAC is much more cooperative than the β→D unfolding in GnHCl.
FIGURE 3.
(A) DTAC-induced secondary- and tertiary-structure transitions of β-lactoglobulin (adapted from Viseu et al. (16)). The gray curve shows the maximum accumulation of the intermediate I1 during the β→α transition, calculated as described in the text. (B) GnHCl-induced secondary- and tertiary-structure transitions of β-lactoglobulin. In both panels, the protein α-helical content was evaluated from [θ]222 (circles) and/or by the program SELCON3 (squares), whereas tertiary-structure changes were obtained from [θ]293 (diamonds) and/or the maximum emission intensity with excitation at 293 nm (triangles). Cm is the midpoint concentration of the unfolding agent, DTAC or GnHCl, assuming a two-state transition. The curves through the data in panel A are guides to the eye, whereas those in panel B are the data fits to Eqs. 1a–1c of the text.
Fig. 3 A compares tertiary- and secondary-structure changes induced in BLG by DTAC. The noncoincidence of their midpoint DTAC concentrations (4 and 11 mM, respectively) means that the protein unfolds more easily (i.e., at lower DTAC concentrations) than suffers the β→α transition. Therefore, an intermediate state (I1) should accumulate between states β and α. This means that the β→α transition is not a simple two-state process as it has been treated in a first approximation (16).
The concentration of the intermediate I1, which can accumulate during the DTAC-induced unfolding, shown as a gray curve in Fig. 3 A, was calculated from the difference between tertiary- and secondary-structure changes, assuming that: i), the tertiary-structure transition has reached its completion on the intermediate, where ii), no disruption of the secondary structure has occurred yet. Therefore, it is the maximum accumulation that can be theoretically achieved. The actual intermediate accumulation is probably lower than the one predicted here.
Fig. 3 B compares the tertiary- and secondary-structure changes of BLG induced by GnHCl (i.e., for the β→D transition). It is observed that changes in the tertiary structure occur at lower GnHCl concentrations than those in the secondary structure, with Cm values of 2.65 and 3.0 M, respectively. This latter value agrees with that obtained by Hamada and Goto (3.0 M) using the same technique, the change in the ellipticity at 222 nm (6). In Fig. 3 B, the data were fitted to Eq. 1a, but taking also into account the following linear relations (31):
 |
(1b) |
 |
(1c) |
In Eqs. 1b and 1c, the parameters a and b are, respectively, the Y axis intercepts and the slopes of the transition curves, before (N-state) and after (D-state) the transition region. From the fits, we obtained m values of 12.4 and 5.5 kJ mol−1 M−1, respectively, for the tertiary- and secondary-structure transitions of BLG. This means that a higher cooperativity was found for the former type of transition.
The noncoincidence of the midtransition points for the GnHCl-induced secondary- and tertiary-structure changes in BLG means that another intermediate (I2) accumulates between the states β and D. Kinetic results described below will shed more light on the nature of I1 and I2 states.
Kinetic studies
Unfolding kinetic studies used the fluorescence of the intrinsic BLG tryptophans as the detection technique. Steady-state emission spectra of the main protein equilibrium forms at pH ≈ 6−7 (β-dimer, α, and D; Fig. 4 A), show that state α has the highest fluorescence yield, whereas state D has the most red-shifted emission. These distinct characteristics of the main equilibrium conformations of BLG allow an easy monitoring of its unfolding kinetics, induced by either DTAC or GnHCl.
Fig. 4 B illustrates typical unfolding kinetic traces of BLG in both media (DTAC and GnHCl), as well as the corresponding baselines for the equilibrium states involved. It is seen that, even though much lower concentrations of the detergent (rather than the denaturant) are needed for BLG unfolding, the DTAC-induced transition generally proceeds much faster than the GnHCl-induced one. This is not surprising, given the two quite different final states. Indeed, the β→α transition (that alters considerably the protein secondary structure but only induces a moderate change in its tertiary structure—and so mainly involves local interactions) is expected to be faster than the protein denaturation (which produces drastic alterations in both secondary and tertiary structures—i.e, it also involves nonlocal interactions).
The transition dimer → monomer in the native state (βdim→βmon), induced by an aqueous HCl−KCl buffer at pH = 2.2 (at which BLG is monomeric (8)), was too fast to be acquired by the equipment used. This means that it occurs within the dead-time of the stopped-flow apparatus (≈6 ms). Therefore, the native monomer (βmon) is not the kinetic intermediate detected in either the DTAC-induced or the GnHCl-induced unfolding, but it is probably involved in a rapid preequilibrium, in both media. In Fig. 4 A, the emission spectra of the protein native dimer (at pH ≈ 6, curve 1) and monomer (at pH ≈ 2, curve 2) can be compared, whereas Fig. 4 B shows their baseline traces (1′ and 2′, respectively, for the dimer and monomer).
DTAC-induced unfolding
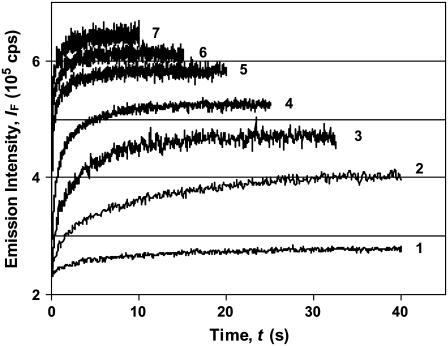
Kinetic curves characterizing the β→α transition of BLG, at the level of the tertiary structure, are illustrated in Fig. 5, at several DTAC concentrations.
FIGURE 5.
Kinetic profiles for the DTAC-induced unfolding of the native β-lactoglobulin in water. The traces were obtained by following the Trp fluorescence, with excitation at 293 nm and emission at 340 nm. Effect of the DTAC concentration is: [DTAC] = 2.5, 6.25, 10, 12.5, 17.5, 22.5 (at the CMC), and 25 mM, for curves 1−7, respectively. [BLG] = 10 μM in all runs.
Because the surfactant is in great excess relatively to the protein (≈1000:1, in molar units), pseudo-first-order processes are expected, i.e., the protein concentration should not affect unfolding rates as long as the equilibrium dimer↔monomer is not involved in kinetics. This fact was confirmed by the almost coincidence of normalized kinetic curves, for BLG concentrations in the range 5−20 μM (results not shown); at higher BLG concentrations, a slight deviation (to lower rates) could indeed be due to the presence of some protein dimer, in equilibrium with the monomer.
The fluorescence growth observed experimentally could not be fitted to a single exponential time function, but, instead, was fitted to a biexponential. This latter function is adequate to model two first-order, sequential, kinetic steps between three protein states β, I1, and α, with rate constants k1 and k2:
 |
(Mechanism A1) |
Mechanism A1 implies the rise and decay of an on-pathway intermediate (I1) during the transition. Integration of the differential rate equations corresponding to this mechanism (subject to the initial conditions: [β]t=0 = [β]0; [I1]t=0 = [α]t=0 = 0) gives the following concentration-time functions (see, e.g., Steinfeld et al. (33)):
 |
(2a) |
 |
(2b) |
 |
(2c) |
The experimental observable in Fig. 5 is the total fluorescence intensity F (the sum for that of the β, I1, and α states, with relative emission yields  and
and  ), at the chosen emission wavelength (in this case, 340 nm):
 |
(2d) |
The initial protein concentration [β]0 is known, and so each kinetic curve is a function of five parameters: two rate constants and three relative emission yields. These parameters, illustrated in Fig. 6, were obtained by the data fitting program, which also integrates differential kinetic equations numerically (see the “Materials and Methods” section) and so the analytical solution, Eqs. 2a–2c, was not used directly.
FIGURE 6.
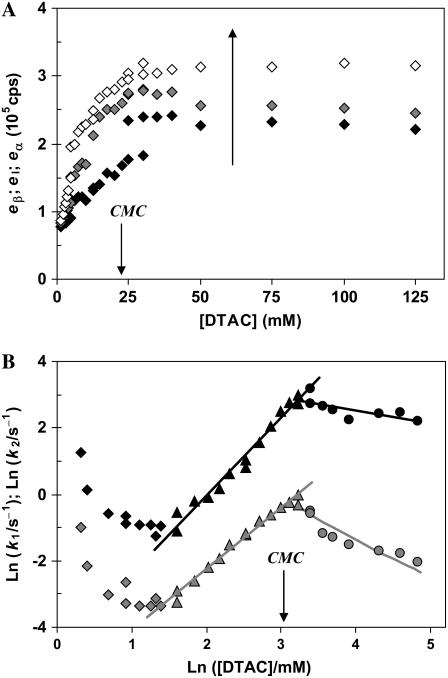
Fitted parameters to a kinetic model of two sequential processes for the DTAC-induced unfolding of β-lactoglobulin, as a function of [DTAC] are: (A) relative emission intensities (the large arrow indicates the reaction coordinate for the transition) and (B) modified “Chevron Plot” of the fast (k1; black symbols) and slow (k2; gray symbols) rate constants (Ln−Ln scale). Panel B shows the different DTAC concentration regimes: low (diamonds); intermediate (triangles, fitted to a linear equation); and high (circles, fitted to Eq. 7 of the Appendix, which is linear in this plot). The CMC of DTAC is indicated in both panels.
Mechanism A1 did not consider the reversibility of the two processes (with rate constants k1 and k2). Therefore, the observed rate constants (which are represented in Fig. 6 B) should be the sum of the forward and reverse rate constants, being close to the forward rate constants only at relatively high DTAC concentrations. We should note as well that we assumed that k1 is the faster, and k2 the slower, rate constants of mechanism A1. However, because of the nonidentifiability of the two calculated rate parameters in sequential, first-order reaction schemes (34), k1 could correspond to the slower rate constant and k2 to the faster one. But in this latter hypothesis the intermediate I1 would be very labile (and the steady-state approximation would apply to it), which is inconsistent with our experimental data, where the accumulation of an intermediate was easily detected (recall Fig. 3 A).
Fig. 6 A shows that the relative emission yields of the three protein states involved in the transition (β, I1, and α) follow the same order at all DTAC concentrations:  <
<  <
<  This means that, as long as [DTAC] increases, a progressive and similar effect is induced on both partially unfolded states, I1 and α. Unexpectedly, the emission intensity of the native state (
 ) is not constant with [DTAC]. This seems inconsistent, and probably happens because of the poor sensitivity in the calculation of this parameter from the initial data of Fig. 5, which are close to the dead-time of the stopped-flow apparatus.
The observed (pseudo-first-order) rate constants depend on the DTAC concentration because the population of the final denatured state increases with [DTAC]. However, a Chevron plot of the two rate constants as a function of [DTAC] (not shown herein) does not present any detectable linear region.
On the other hand, a “modified Chevron plot” (Ln−Ln) of k1 and k2 as a function of [DTAC] shows two linear regions for each rate constant (Fig. 6 B). As long as [DTAC] increases, both the fast and slow rate constants show a similar trend: after an initial decrease, at low [DTAC], k1 and k2 increase with [DTAC], tend to stabilize when micelles are formed, for [DTAC] = 22.5 mM (18), and then slowly decrease again above the CMC. The initial rate decrease (similarly to a Chevron plot for two-state unfolding proteins) is attributed to the competition of the reverse refolding process. The minimum values of both rate constants are observed for [DTAC] ≈ 4 mM and the maximum values appear slightly above the CMC, for [DTAC] ≈ 25−30 mM.
A linear Ln−Ln representation was also found by Otzen and Oliveberg (35) for the unfolding rate of the small protein S6 induced by cylindrical micelles of sodium dodecylsulfate (SDS). These nonspherical micelles are formed at SDS concentrations about two orders of magnitude higher than its CMC. The authors proposed that the unfolding occurs via a binding complex between the protein and the micelles (S6#:SDS) formed in the burst-phase of the stopped-flow experiment (≈8 ms).
In our case, a linear Ln−Ln Chevron plot is observed for DTAC concentrations mainly in the premicelle region and up to slightly above the CMC, ≈4−30 mM. We propose herein that a rapid preequilibrium between the protein and the DTAC monomers (but not with the DTAC micelles) is established within the dead-time of the stopped-flow apparatus (≈6 ms), forming a complex. This complex may be represented as BLG#:nDTAC, in which BLG# could be the native monomer (βmon) bound to nDTAC molecules. In this case, the complete unfolding mechanism would be written as (where n′ and n′′ may be different from n):
 |
(Mechanism A2) |
According to mechanism A2, the observed rate constants were fitted to the following linear equation, which is analogous to the one proposed for the unfolding of S6 induced by cylindrical SDS micelles (35,36):
 |
(3) |
In Eq. 3, kobs is the observed rate constant at a given DTAC concentration C; kref is the rate constant at a chosen reference concentration Cref; and Δn is the increase in the number of protein-DTAC interactions during the unfolding step(s). Using Cref ≈ 10 mM for both kinetic steps, i.e., for the two series of data in Fig. 6 B, the values obtained for Δn (for [DTAC] = 3.75−25 mM) were 2.2 and 1.7 for steps 1 and 2, respectively, of mechanism A2 (or Δn ≈ 2 for both steps). This means that, after formation of the initial BLG#:nDTAC complex, two more DTAC molecules participate in each of the subsequent unfolding steps, i.e.,  and
and  Even though the value of n is unknown, this result seems reasonable if we consider the successively more loosen tertiary structures of the three protein states, in the order β → I1 → α, which can successively bind more DTAC molecules.
On the other hand, the saturation of the rate constants above the detergent CMC will occur if the DTAC monomers are the entities responsible for the transitions, as proposed in mechanism A2. Indeed, above the CMC, the concentration of monomers is constant and thus no increase in the rate constants is expected. The small decrease observed (especially in k2), when the concentration of micelles becomes more significant, probably means that some protein molecules are incorporated into the DTAC micelles, which somehow prevent the transition induced by the DTAC monomers. To explain this decrease, e.g., for k2, we propose a mechanism based on the partition of the intermediate I1 between the solution phase (where it can interact with the DTAC monomers) and the micelles. (An analogous mechanism may also explain the decrease in the rate constant k1, if we assume that the N-state is also partitioned between the solution and the DTAC micelles.) The equations obtained from this mechanism are described in the Appendix (Eqs. 1–7). Support for this mechanism is given in Fig. 6 B, where the observed k2 values were fitted to Eq. 7 of the Appendix: from the critical micelle concentration, CMC ≈ 22.5 mM (18), and the mean aggregation number, AN ≈ 50 (37), a value of 0.29 ± 0.04 mM was calculated for the dissociation constant  Using a similar procedure, a value of 7 ± 6 mM was estimated for
  reflecting the lower affinity of the protein native state for the DTAC micelles as compared to that of the intermediate state.
GnHCl-induced unfolding
Effect of the emission wavelength.
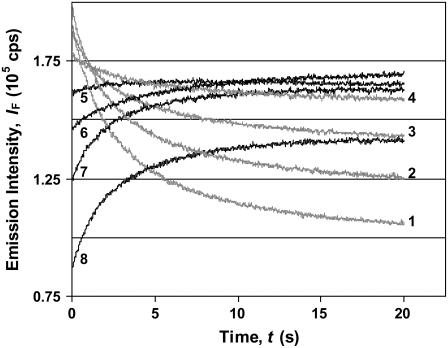
In the case of the GnHCl-induced unfolding of BLG, kinetic curves collected at different emission wavelengths presented an inversion on the curve trend (from decay to growth) at 345−350 nm (Fig. 7). This wavelength is not far from the iso-emissive point of the N and D states (at ≈345 nm) found in steady-state spectra (Fig. 4 A).
FIGURE 7.
Typical kinetic profiles (decays in gray, growths in black) for the GnHCl-induced unfolding of the native β-lactoglobulin, in water. Effect of the fluorescence emission wavelength: λem = 330; 335; 340; 345; 350; 355; 360; and 370 nm for curves 1−8, respectively. [BLG] = 10 μM and [GnHCl] = 4 M.
To verify if an on-pathway intermediate accumulates between states N and D, a set of experimental kinetic curves collected at different wavelengths (310−410 nm) were fitted to biexponential time functions. It was found that all growth and decay profiles could be described by this type of function, meaning that the GnHCl-induced unfolding is a sequential, two-step mechanism, B1, involving an intermediate I2:
 |
(Mechanism B1) |
The five parameters extracted from the fits at each wavelength (two rate constants and three relative emission yields) are illustrated in Fig. 8.
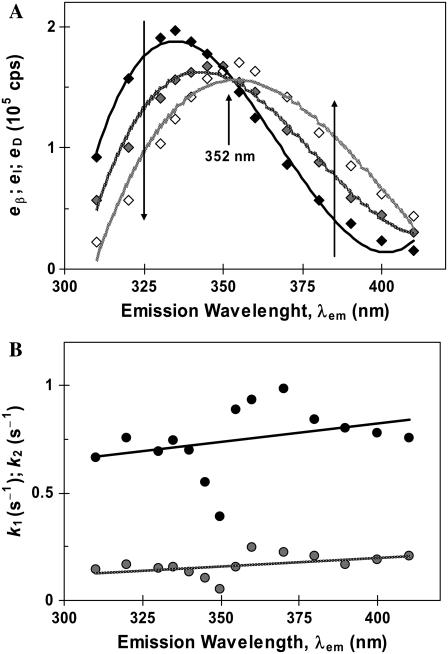
FIGURE 8.
Fitted parameters to a kinetic model of two sequential processes for the GnHCl-induced unfolding of β-lactoglobulin, as a function of the emission wavelength: (A) relative emission intensities (the larger arrows indicate the reaction coordinate for the transition) and (B) fast (k1; black circles) and slow (k2; gray circles) rate constants.
The relative emission intensities (Fig. 8 A) should represent the recovered emission spectra of the three conformational states β, I2, and D. Curiously, all spectra cross at the same wavelength (352 nm), which should be an isoemissive point for the three states. However, the wavelength found is not exactly the same as the one obtained by steady-state emission spectra (≈345 nm; Fig. 4 A). Furthermore, the maximum emission intensities of the protein β and D states (Fig. 8 A) are reversed with respect to those acquired in steady-state conditions (Fig. 4 A).
These discrepancies might be explained if the “initial” emission intensities obtained from kinetic data would correspond to a protein precursor state (P) with stronger fluorescence intensity than the native state βdim (and also stronger than the final D state). State P, stabilized by GnHCl as a solvent, should be formed within the stopped-flow dead-time (≈6 ms). The complete mechanism would thus be written as:
 |
(Mechanism B2) |
where  denotes a generic protein state X “solvated” (or stabilized) by GnHCl.
Mechanism B2 corresponds to the same kinetics as mechanism B1 if the equilibrium forming the precursor state P is established within the experimental burst-phase (≈6 ms). State P, having more intense fluorescence than the native state βdim, could either be the native monomer, βmon, the intermediate I1, or even an α-state, stabilized by GnHCl—possibly different from the DTAC-stabilized analogous states.
The fact that both rate constants k1 and k2 are approximately independent of the emission wavelength, as seen by the nearly horizontal trend-lines in Fig. 8 B, is an indication that we are dealing with the correct mechanism. The irregularities observed near the isoemissive point can be explained by the lower sensitivity in the parameter fitting, in this wavelength range, due to a lower signal/noise ratio (because the initial and final emission intensities do not differ too much; Fig. 7).
Effect of the GnHCl concentration.
Unfolding kinetic profiles of BLG induced by GnHCl as a function of the denaturant concentration (data not shown herein) were obtained for [GnHCl] ≈ 2−4 M.
GnHCl concentrations <2.0 M do not denature the protein, i.e., the corresponding “kinetic” profiles were nearly horizontal baselines, and so no kinetic parameters could be obtained. This was expected because, according to equilibrium results, BLG remains in the N-state in these conditions (see Figs. 2 C or 3 B). An incipient “refolding limb” seems to appear at [GnHCl] ≈ 2 M (see Fig. 9 B below), but we have not enough data in this range to confirm this trend.
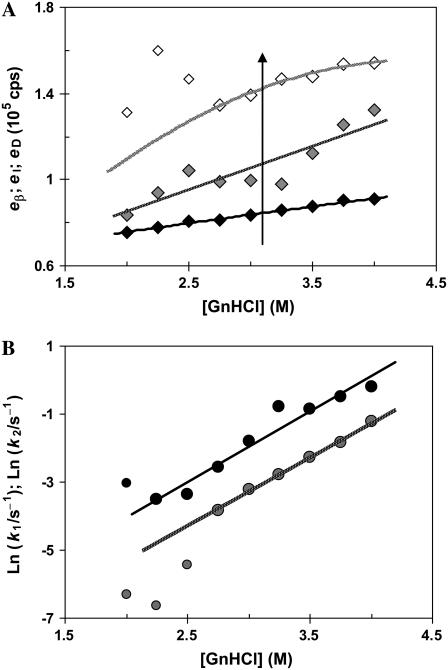
FIGURE 9.
Fitted parameters to a kinetic model of two sequential processes for the GnHCl-induced unfolding of β-lactoglobulin, as a function of [GnHCl] are: (A) relative emission intensities (the arrow indicates the reaction coordinate for the transition) and (B) Chevron plot of the fast (k1; black circles) and slow (k2, gray circles) rate constants.
At 2−4 M GnHCl (i.e., for the transition region and above), all unfolding kinetic traces were best fitted to biexponentials. Fig. 9 illustrates the rate constants and relative emission yields extracted from the fits.
The relative emission intensities of the three protein states, P, I2, and D, follow the same order at all GnHCl concentrations (Fig. 9 A). This means that GnHCl, as long as its concentration increases, induces a progressive and similar effect on both partially unfolded (I2) and denatured (D) states (and on the respective transition states). It is also seen that, at the observation wavelength of 370 nm, the fluorescence yield of D is higher that that of I2, which is higher than that of the precursor state.
Both the fast and slow rate constants show an exponential trend with the GnHCl concentration (for [GnHCl] > 2.5 M, when almost all of the protein molecules become denatured), thus following linear Chevron-plot representations (Fig. 9 B). This trend results from an inverse linear relationship between the free energy change and the GnHCl concentration, for each step of the mechanism.
For GnHCl concentrations in the range 2−2.5 M, the observed rate constant k2 shows an irregular trend (Fig. 9 B); this also happens with eD, the emission yield of the final state (Fig. 9 A). This behavior is due to the inadequate time range used for the fit, which was too short to obtain stable values for these parameters. This means that the fitting was not very sensitive to k2 and eD. A sensitivity analysis of the kinetic profiles (33), the purpose of which is to assess the sensitivity of the systems solutions to small changes in input parameters, could provide a better knowledge of these uncertainties and thus help in better designing the experimental measurements.
Proposed mechanisms
Fig. 10 illustrates the main conformational states of β-lactoglobulin, and their mechanistic interrelation, for the DTAC-induced unfolding (route A) and the GnHCl-induced unfolding (route B).
Regardless of the medium, the equilibrium native-dimer ↔ native-monomer (βdim↔βmon, represented by blue arrows in the figure) is too fast to be resolved in the experiments. This means that BLG becomes monomeric within the dead-time of the stopped-flow device, and behaves as such in the subsequent unfolding pathways.
Route A (represented by red arrows in the figure) ends in state α. This BLG conformation is quite different from the native state, both in secondary (mostly α-helical) and tertiary structure (partially unfolded). The detected intermediate in this route, I1, is similar to the native state in secondary structure but has a looser tertiary structure, more similar to the one of state α.
Route B (represented by green arrows in the figure) is initiated by the formation of a precursor state P, within the experimental burst-phase. Possible precursor states can be the native monomer or the intermediate I1 found in route A, but stabilized by GnHCl as a solvent. The two unfolding routes can thus have these states in common.
Route B ends in the denatured state D, which is devoid of ordered secondary structure and is almost totally unfolded: it only maintains the two native disulfide bonds (38). A kinetic intermediate was also found in route B: state I2, with a relative emission yield intermediate between those of the precursor and D states. Apart from its fluorescence characteristics, the nature of I2 could not be determined in this work, and so it is not pictured in Fig. 10.
CONCLUSIONS
Bovine β-lactoglobulin, a β-sheet protein when native, easily undergoes a transition to a conformation where α-helices prevail, the α-state. The β→α transition, induced herein by the cationic detergent DTAC, goes along with the protein partial unfolding, meaning that the α-state has a more flexible tertiary structure than the native β-state.
Unfolding in DTAC, which occurs at millimolar detergent concentrations, was compared to the almost complete unfolding in a common chemical denaturant, GnHCl. The unordered D state was obtained in the molar range of denaturant concentrations. The β→α transition, in DTAC, is thus much more cooperative than the protein total unfolding (β→D) in GnHCl.
Equilibrium results were complemented by detailed kinetic studies, to gain information on the mechanism of these two BLG unfolding routes, in DTAC and in GnHCl. Kinetic profiles were obtained with the stopped-flow technique coupled to Trp fluorescence detection.
Unfolding kinetic traces of BLG in DTAC were biexponential functions, meaning that an on-pathway intermediate (I1) accumulates between the β- and α-states. The emission characteristics of I1 show that this protein state has a looser tertiary structure than the native state. The evolution of the rate constants with the DTAC concentration follows a “modified Chevron-plot” (linear in a Ln−Ln scale). Based on a similar behavior described in the literature, this trend was explained by the establishment of a preequilibrium within the experimental burst-phase, leading to the formation of a binding complex, BLG#:nDTAC, between the protein and the DTAC monomers.
Unfolding profiles were also biexponentials in GnHCl, and so another BLG intermediate (I2) accumulates between states β and D. The fluorescence spectra of the three main protein states, recovered from kinetic data at several emission wavelengths, showed an isoemissive point. However, the “initial” state seen from kinetic profiles was not state β, but a precursor state P, stabilized by GnHCl and formed within the experimental burst-phase. A Chevron plot of the rate constants shows an inverse linear relationship between the free energy change and the GnHCl concentration, meaning that the denaturant acts as a solvent in BLG unfolding.
Acknowledgments
The authors are most grateful to Prof. J. Pessoa for providing the CD spectrometer.
The work was supported by 3° Quadro Comunitário de Apoio (FEDER) of Centro de Química Estrutural-4/Fundação para a Ciência e a Tecnologia (CQE4/FCT), and by projects POCI/QUI/58816/2004 and REEQ/115/QUI/2005, funded by FCT. T.I.C. acknowledges a research grant through CQE4/FCT and a PhD grant from FCT. R.F.C. acknowledges a research grant through project POCI/QUI/58816/2004.
APPENDIX
If I1 interacts with the DTAC micelles according to a very fast, reversible, equilibrium, and this interaction prevents its transition to the α-state, the observed rate constant,  will be lower than k2, and given by:
 |
(1) |
where  the fraction of I1 that interacts with the DTAC monomers in solution, is:
 |
(2) |
The equilibrium constant of I1 between micelles and solution (dissociation constant,  ) is given by:
 |
(3) |
where  and
and  are, respectively, the concentration of micelles and the concentration I1 incorporated in micelles.
The concentration of micelles is calculated from the total surfactant concentration,  the critical micelle concentration, CMC ≈ 22.5 mM (18), and the mean aggregation number, AN ≈ 50 (37), by:
 |
(4) |
Combining Eqs. 2 and 3, we obtain:
 |
(5) |
Below the CMC, ln k2 depends linearly on ln  (see Fig. 6 B), so:
 |
(6) |
Above the CMC, we can use for  the value obtained at the CMC attenuated by the fraction of I1 that interacts with the DTAC monomers in solution (Eq. 1). Applying logarithms to Eq. 1 and using Eq. 5 for
  the following relationship holds:
 |
(7) |
This equation was used to fit the decrease in  above the CMC, by varying
  The parameters
  and m are not linked to
  because they relate to different ranges of DTAC concentrations; so, they were determined independently by linear regression of the first linear part of Fig. 6 B (corresponding to the values of
  for
for  between 5 and 25 mM), and then were used to determine
  in Eq. 7.
An analogous mechanism may also explain the decrease in the rate constant  if we assume that the N-state is also partitioned between the solution and the DTAC micelles, with a dissociation constant
Abbreviations used: BLG, β-lactoglobulin; DTAC, dodecyltrimethylammonium chloride; GnHCl, guanidine hydrochloride; Trp, tryptophan; CMC, critical micelle concentration; CD, circular dichroism; UV, ultraviolet.
Editor: Heinrich Roder.
References
- 1.Carrell, R. W., and D. A. Lomas. 1997. Conformational disease. Lancet. 350:134–138. [DOI] [PubMed] [Google Scholar]
- 2.Prusiner, S. B. 1997. Prion diseases and the BSE crisis. Science. 278:245–251. [DOI] [PubMed] [Google Scholar]
- 3.Kuwata, K., M. Hoshino, S. Era, C. A. Batt, and Y. Goto. 1998. α→β Transition of β-lactoglobulin as evidenced by heteronuclear NMR. J. Mol. Biol. 283:731–739. [DOI] [PubMed] [Google Scholar]
- 4.Shiraki, K., K. Nishikawa, and Y. Goto. 1995. Trifluoroethanol-induced stabilization of the α-helical structure of β-lactoglobulin: implication for non-hierarchical protein folding. J. Mol. Biol. 245:180–194. [DOI] [PubMed] [Google Scholar]
- 5.Hamada, D., Y. Kuroda, T. Tanaka, and Y. Goto. 1995. High helical propensity of the peptide fragments derived from β-lactoglobulin, a predominantly β-sheet protein. J. Mol. Biol. 254:737–746. [DOI] [PubMed] [Google Scholar]
- 6.Hamada, D., and Y. Goto. 1997. The equilibrium intermediate of β-lactoglobulin with non-native α-helical structure. J. Mol. Biol. 269:479–487. [DOI] [PubMed] [Google Scholar]
- 7.Brownlow, S., J. H. M. Cabral, R. Cooper, D. R. Flower, S. J. Yewdall, I. Policarpov, T. North, and L. Sawyer. 1997. Bovine β-lactoglobulin at 1.8 Å resolution: still an enigmatic lipocalin. Structure. 5:481–495. [DOI] [PubMed] [Google Scholar]
- 8.Verheul, M., J. S. Pedersen, S. P. F. M. Roefs, and K. G. de Kruif. 1999. Association behavior of native β-lactoglobulin. Biopolymers. 49:11–20. [DOI] [PubMed] [Google Scholar]
- 9.Dufour, E., and T. Haertlé. 1990. Alcohol-induced changes of β-lactoglobulin: retinol-binding stoichiometry. Protein Eng. 4:185–190. [DOI] [PubMed] [Google Scholar]
- 10.Hirota, N., K. Mizuno, and Y. Goto. 1997. Cooperative α-helix formation of β-lactoglobulin and melittin induced by hexafluoroisopropanol. Protein Sci. 6:416–421. [DOI] [PMC free article] [PubMed] [Google Scholar]
- 11.Uversky, V. N., N. V. Narizhneva, S. O. Kirschstein, S. Winter, and G. Löber. 1997. Conformational transitions provoked by organic solvents in β-lactoglobulin: can a molten globule like intermediate be induced by the decrease in dielectric constant? Fold. Des. 2:163–172. [DOI] [PubMed] [Google Scholar]
- 12.Hirota-Nakaoka, N., and Y. Goto. 1999. Alcohol-induced denaturation of β-lactoglobulin: a close correlation to the alcohol-induced α-helix formation of melittin. Bioinorganic & Medicinal Chemistry. 7:67–73. [DOI] [PubMed] [Google Scholar]
- 13.Mendieta, J., H. Folqué, and R. Tauler. 1999. Two-phase induction of the nonnactive α-helical form of β-lactoglobulin in the presence of trifluoroethanol. Biophys. J. 76:451–457. [DOI] [PMC free article] [PubMed] [Google Scholar]
- 14.Kauffmann, E., N. C. Darnton, R. H. Austin, C. Batt, and K. Gerwert. 2001. Lifetimes of intermediates in the β-sheet to α-helix transition of β-lactoglobulin by using a diffusional IR mixer. Proc. Natl. Acad. Sci. USA. 98:6646–6649. [DOI] [PMC free article] [PubMed] [Google Scholar]
- 15.Brown, E. M., R. J. Carroll, P. E. Pfeffer, and J. Sampugna. 1983. Complex formation in sonicated mixtures of β-lactoglobulin and phosphatidylcholine. Lipids. 18:111–118. [Google Scholar]
- 16.Viseu, M. I., T. I. Carvalho, and S. M. B. Costa. 2004. Conformational transitions in β-lactoglobulin induced by cationic amphiphiles: equilibrium studies. Biophys. J. 86:2392–2402. [DOI] [PMC free article] [PubMed] [Google Scholar]
- 17.Viseu, M. I., K. Edwards, C. S. Campos, and S. M. B. Costa. 2000. Spontaneous vesicles formed in aqueous mixtures of two cationic amphiphiles. Langmuir. 16:2105–2114. [Google Scholar]
- 18.Viseu, M. I., M. M. Velázquez, C. S. Campos, I. García-Mateos, and S. M. B. Costa. 2000. Structural transitions in a bicationic amphiphile system studied by light-scattering, conductivity, and surface tension measurements. Langmuir. 16:4882–4889. [Google Scholar]
- 19.Collini, M., L. D′Alfonso, and G. Baldini. 2000. New insight on β-lactoglobulin binding sites by 1-anilinonaphthalene-8-sulfonate fluorescence decay. Protein Sci. 9:1968–1974. [DOI] [PMC free article] [PubMed] [Google Scholar]
- 20.Sreerama, N., and R. W. Woody. 1993. A self-consistent method for the analysis of protein secondary structure from circular dichroism. Anal. Biochem. 209:32–44. [DOI] [PubMed] [Google Scholar]
- 21.Sreerama, N., S. Yu. Venyaminov, and R. W. Woody. 1999. Estimation of the number of α-helical and β-strand segments in proteins using circular dichroism spectroscopy. Protein Sci. 8:370–380. [DOI] [PMC free article] [PubMed] [Google Scholar]
- 22.Sreerama, N. 2003. http://lamar.colostate.edu. [Online.].
- 23.Horiba Jobin-Yvon. 2007. http://jobinyvon.com/SiteResources/Data/Templates/1divisional.asp?DocID=574&v1ID=&lang=1.
- 24.Macey, R. I., and G. F. Oster. 2006. Modeling and analysis of dynamic systems. http://berkeleymadonna.com. [Online.].
- 25.Drake, A. F. 2001. Circular dichoism. In Protein-Ligand Interactions: Structure and Spectroscopy. S. E. Harding and B. Z. Chowdhry, editors. Oxford University Press, Oxford, UK. 140–141.
- 26.Cho, Y., C. A. Batt, and L. Sawyer. 1994. Probing the retinol-binding site of bovine β-lactoglobulin. J. Biol. Chem. 269:11102–11107. [PubMed] [Google Scholar]
- 27.Lakowicz, J. R. 1999. Principles of Fluorescence Spectroscopy. 2nd Ed. Kluwer Academic/Plenum Publishers, NY.
- 28.Palazolo, G., F. Rodríguez, B. Farruggia, G. Picó, and N. Delorenzi. 2000. Heat treatment of β-lactoglobulin: structural changes studied by partitioning and fluorescence. J. Agric. Food Chem. 48:3817–3822. [DOI] [PubMed] [Google Scholar]
- 29.Renard, D., J. Lefebvre, M. C. A. Griffin, and W. G. Griffin. 1998. Effects of pH and salt environment on the association of β-lactoglobulin revealed by intrinsic fluorescence studies. Int. J. Biol. Macromol. 22:41–49. [DOI] [PubMed] [Google Scholar]
- 30.Lakshmikanth, G. S., and G. Krishnamoorthy. 1999. Solvent-exposed tryptophans probe the dynamics at protein surfaces. Biophys. J. 77:1100–1106. [DOI] [PMC free article] [PubMed] [Google Scholar]
- 31.Fersht, A. 1999. Structure and Mechanism in Protein Science. A Guide to Enzyme Catalysis and Protein Folding. Freeman and Co., NY.
- 32.Andrade, S. M., T. I. Carvalho, M. I. Viseu, and S. M. B. Costa. 2004. Conformational changes of β-lactoglobulin in sodium bis(2-ethylhexyl) sulfosuccinate reverse micelles: a fluorescence and CD study. Eur. J. Biochem. 271:734–744. [DOI] [PubMed] [Google Scholar]
- 33.Steinfeld, J. I., J. S. Francisco, and W. L. Hase. 1989. Chapters 2 and 3. In Chemical Kinetics and Dynamics. Prentice Hall, Englewood Cliffs, NJ. 27–28; 142–150.
- 34.Vadja, S., and H. Rabitz. 1988. Identifiability and distinguishability of first-order reaction systems. J. Phys. Chem. 92:701–707. [Google Scholar]
- 35.Otzen, D. E., and M. Oliveberg. 2002. Burst-phase expansion of native protein prior to global unfolding in SDS. J. Mol. Biol. 315:1231–1240. [DOI] [PubMed] [Google Scholar]
- 36.Otzen, D. E. 2002. Protein unfolding in detergents: effect of micelle structure, ionic strength, pH, and temperature. Biophys. J. 83:2219–2230. [DOI] [PMC free article] [PubMed] [Google Scholar]
- 37.Roelants, E., and F. C. De Schryver. 1987. Parameters affecting aqueous micelles of CTAC, TTAC, and DTAC probed by fluorescence quenching. Langmuir. 3:209–214. [Google Scholar]
- 38.Kuwata, K., R. Shastry, H. Cheng, M. Hoshino, C. A. Batt, Y. Goto, and H. Roder. 2001. Structural and kinetic characterization of early folding events in β-lactoglobulin. Nat. Struct. Biol. 8:151–155. [DOI] [PubMed] [Google Scholar]


