Abstract
O6-Methylguanine-DNA methyltransferase (MGMT), an enzyme that repairs adducts at O6 of guanine in DNA, is a major determinant of susceptibility to simple methylating carcinogens or of tumor response to anticancer chloroethylating drugs. To investigate the mechanisms underlying cellular expression of this DNA repair enzyme, we focused on the role of a 59-bp enhancer of the human MGMT gene in the regulation of its expression. By using chloramphenicol acetyltransferase reporter assays, we found that the enhancer activity, which was present in both MGMT-expressing (Mer+) and -deficient (Mer−) cells, correlated with the endogenous MGMT activity in Mer+ cell lines. Band-shift assays and deletion analysis of the 59-bp sequence defined a minimal 9-mer cis element (5′-CTGGGTCGC-3′) for specific trans factor binding. The MGMT enhancer binding protein (MEBP), 45 kDa by Southwestern blot analysis, was present in the nuclei of all Mer+ cells tested but was apparently restricted to the cytoplasm of Mer− cells. We conclude that the MEBP–enhancer interaction plays an important role in regulating constitutive MGMT expression in Mer+ cells and that MEBP exclusion from the nucleus may account for the down-regulation of MGMT in Mer− cells.
The DNA repair protein O6-methylguanine-DNA methyltransferase (MGMT) repairs cytotoxic and mutagenic alkylation damage produced by anticancer drugs, such as 1,3-bis(2-chloroethyl)-1-nitrosourea, and by carcinogenic agents, such as N-methyl-N-nitrosourea or 1-methyl-3-nitro-1-nitrosoguanidine (1). MGMT acts in a stoichiometric manner, transferring alkyl groups from the O6 position of guanine in DNA to a cysteine residue in its own sequence. This transfer inactivates MGMT and is irreversible; hence, a cell’s ability to withstand such damage is directly related to the number of MGMT molecules it contains and to the rate of de novo MGMT synthesis. The importance of MGMT levels in determining responses both to chemotherapy with chloroethylnitrosoureas and to carcinogenesis by methylating agents has been clearly demonstrated (2–4); however, how these levels are regulated in human cells is not yet understood. In rodents, MGMT can be induced, albeit at modest levels; yet, there is no clear evidence for such inducibility in human cells (5). Whereas all normal human tissues and cultured cell lines (Mer+ phenotype) constitutively express MGMT, a subset of tumor cell lines appears to be totally MGMT-deficient (Mer− phenotype) (6, 7). MGMT levels vary according to tissue or cell type (8), which indicates that mechanisms must exist to strictly regulate these levels in Mer+ cells and to suppress MGMT in Mer− cells. The MGMT gene is present in Mer− cells with no gross rearrangements or deletions; however, both the protein and mRNA are essentially undetectable (9–11). In Mer+ cells, MGMT mRNA levels generally correlate well with protein levels (9–11). Measurements of MGMT transcription rate by nuclear run-on assay have not proven feasible, because the mRNA is relatively stable and the transcription rate is correspondingly low. The mRNA stability is no greater in cells with high levels at MGMT than it is in cells with lower MGMT levels. This finding suggests that regulation occurs at the level of transcription (12).
Accordingly, to better understand the transcriptional regulation of MGMT, we identified and characterized a 1.2-kb maximal promoter sequence that contains the minimal promoter (88 bp) and a 59-bp enhancer (13, 14). In chloramphenicol acetyltransferase (CAT) reporter gene assays, the 1.2-kb fragment showed promoter activity in several Mer− cells as well as in Mer+ cell lines, leading us to conclude that the deficient cells do not lack any essential transactivating factors (15). Herein, we further these studies by focusing on the possible role of the MGMT enhancer in the regulation of constitutive MGMT expression in Mer+ cells. We show, with reporter gene assays, that the enhancer activity correlates with MGMT levels in a panel of Mer+ cell lines, and we define the minimum protein-binding sequence within the enhancer element. The MGMT enhancer-binding protein (MEBP) was present in both Mer+ and Mer− cells; however, it was excluded from the nucleus of Mer− cells. We discuss the implications of these data on the role of MEBP in MGMT regulation.
MATERIALS AND METHODS
Cell Lines and Culture Conditions.
CEM-CCRF cells were cultured in Eagle’s minimal essential medium (MEM) and Molt 4 cells were cultured in RPMI 1640 medium, each containing 10% newborn calf serum. Both cell lines were the gift of A. Fridland (St. Jude Hospital, Memphis, TN). HeLa-CCL2 and HeLa-S3 (CCL2.2), obtained from the American Type Culture Collection, were grown in Eagle’s MEM supplemented with 10% fetal calf serum (FCS). B lymphoblast cell lines Raji (American Type Culture Collection) and TK6 (the gift of M. Fox, Paterson Institute for Cancer Research, Manchester, England) were maintained in RPMI 1640 medium containing 10% FCS. Human colon adenocarcinoma cell lines HT-29 and BE (a gift from E. Dolan, University of Chicago, Chicago, IL) were cultured in McCoy 5A medium supplemented with 10% FCS. Human A204 cells (American Type Culture Collection) were grown in DMEM containing 10% FCS. Human liver tumor cells Hep G2 (a gift from J. Schuetz, St. Jude Hospital, Memphis, TN) were grown in MEM supplemented with 10% newborn calf serum. IMR90 normal human lung fibroblasts (American Type Culture Collection) and their retrovirus-transformed derivative IMR90–890 cells (a gift from R. Day, Cross Cancer Institute, Edmonton, Alberta) were cultured in MEM containing nonessential amino acids and 10% FCS. All cells were grown at 37°C in 95% air/5% CO2.
Preparation of Nuclear and Cytoplasmic Extracts.
Nuclear extracts were prepared essentially as described by Zerivitz and Akusjarvi (16). Logarithmically growing cells were harvested and washed twice with phosphate-buffered saline (PBS) at room temperature. After centrifugation at 1000 × g for 5 min at room temperature, 108 cells were resuspended in 1 ml of buffer A [0.25 M sucrose/20 mM Hepes, pH 7.9/10 mM KCl/1.5 mM MgCl2/0.5 mM dithiothreitol (DTT)/0.5 mM spermidine/0.15 mM spermine]. After incubation in buffer A for 5 min at room temperature, 40 μl of lysolecithin at 10 mg/ml was added, and the cells were gently swirled for 90 sec, before 2 vol of ice-cold buffer B (buffer A/3% bovine serum albumin) was added; all subsequent procedures were at 4°C. Nuclei were pelleted by centrifugation at 1000 × g for 30 sec and the pellets were washed twice in 2 ml of buffer B. After removing the supernatant, 2 ml per 109 cells of buffer C (20 mM Hepes, pH 7.9/25% glycerol/0.42 M NaCl/1.5 mM MgCl2/0.2 mM EDTA/0.5 mM DTT/0.5 mM phenylmethylsulfonyl fluoride) was added, and the nuclei were disrupted by passing the mixture through a 23-gauge needle 15–20 times. After gentle stirring on ice for 30 min, the mixture was centrifuged at 25,000 × g for 30 min. The supernatant was then removed and dialyzed overnight against buffer D (20 mM Hepes, pH 7.9/20% glycerol/0.1 M KCl/0.2 mM EDTA/0.5 mM DTT/0.5 mM phenylmethylsulfonyl fluoride). After further centrifugation at 25,000 × g for 20 min, the supernatant was divided into aliquots, stored in vials, quick-frozen, and stored at −70°C. Cytoplasmic extracts were prepared as described by Malter (17). Proliferating cells were removed from culture flasks, pelleted by centrifugation, and washed twice in PBS. Cell pellets were transferred to Eppendorf tubes, resuspended in 5 vol of 25 mM Tris⋅HCl, pH 7.8/0.5 mM EDTA, and lysed by four cycles of freezing and thawing as described (17). Lysates were then centrifuged at 15,000 × g at 4°C for 10 min, and the supernatants were removed, quick-frozen, and stored at −70°C. The protein concentration of each nuclear and cytosolic extract was determined by using the Bio-Rad protein assay kit.
DNA Oligonucleotides.
Complimentary strands of DNA oligonucleotides, containing the appropriate DNA sequence and desired 5′ or 3′ deletions were synthesized, in vitro by the Center for BioTechnology (St. Jude Hospital, Memphis, TN), suspended in water at 15 μg/ml, and stored at −20°C.
After annealing complimentary strands and confirming their size by electrophoresis, 15 ng of DNA oligonucleotide was 5′-end-labeled by the addition of 100 μCi of [γ-32P]ATP (Amersham; 1 Ci = 37 GBq), 10 units of T4 polynucleotide kinase (New England BioLabs), and kinase buffer (70 mM Tris⋅HCl, pH 7.6/10 mM MgCl2/5 mM DTT). After incubation at 37°C for 1 h, the mixture was heated at 65°C for 5 min to inactivate the enzyme. 32P-labeled DNA oligonucleotides were purified with a Bio-Spin chromatography column, and the radioactivity was determined by scintillation spectrophotometry.
Band-Shift Assay.
Band-shift assays were performed by incubating, at 16°C for 1 h, 30 μg of nuclear or cytoplasmic protein, with 2 × 10⁵ cpm of 32P-labeled DNA oligonucleotides (2.5 nM) in DNA-protein binding buffer (15 mM KCl/5 mM MgCl2/0.25 mM EDTA/0.25 mM DTT/12 mM Hepes, pH 7.9)/10% glycerol/heparin (5 mg/ml)/yeast tRNA (200 ng/μl), in a total volume of 10 μl (18). Binding was competed by preincubating the protein extract for 30 min with various amounts of unlabeled competitive oligonucleotides and then adding the radiolabeled enhancer DNA oligonucleotides. Competitor to probe ratios were all based on molar concentration of oligonucleotide. Protein–DNA complexes were electrophoretically separated in 6% native polyacrylamide gels with running buffer (44.5 mM Tris borate, pH 8.0/1 mM EDTA) in a Bio-Rad Protean II gel apparatus. After electrophoresis at 250 V for 1 h, gels were dried and exposed to Kodak X-Omat AR film at −70°C.
Southwestern Blot Analysis.
Nuclear protein was denatured, by boiling for 4 min, and loaded on to an SDS 12% polyacrylamide gel (19). After electrophoresis, the separated protein bands were transferred to poly(vinylidene difluoride) membranes (Immobilon-P, Millipore) by the method of Towbin et al. (20). The membrane was blocked for 30 min at room temperature with 5% nonfat dry milk in the DNA–protein binding buffer, before it was hybridized for 1 h at room temperature with the 32P-labeled 16-bp DNA oligonucleotide at 1 × 10⁶ cpm/ml. The membrane was then given three 10-min washes at room temperature with the binding buffer containing 0.1% Nonidet P-40, air-dried, and exposed to Kodak X-Omat AR film.
Western Blot Analysis.
Cell extracts were prepared essentially as described by von Wronski et al. (11). Proteins (40 μg) were separated by electrophoresis in 12% polyacrylamide gels in a Bio-Rad Mini Protean II system. Proteins were electroblotted to poly(vinylidene difluoride) membranes and probed with anti-MGMT monoclonal antibody MT5.1 and an anti-β-tubulin monoclonal antibody (ICN), as described (11).
CAT Reporter Gene Assay.
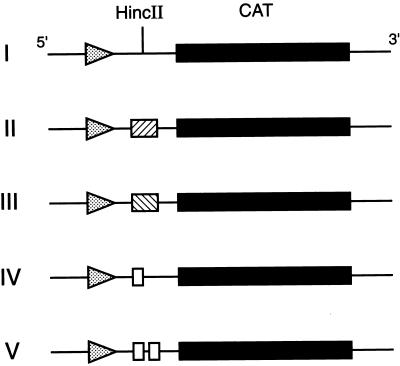
MGMT 5′ flanking gene sequences were inserted into vector pOCAT1 (a gift from D. D. Moore, Harvard Medical School) (21). This plasmid contains the bacterial CAT gene and polyadenylylation signals derived from herpes simplex virus and simian virus 40 (SV40) virus genes. The previously defined 88-bp minimum MGMT promoter sequence (14) was excised from a 1.2-kb maximal promoter fragment BamHI–SstI located at positions −954 to +203 with respect to the transcription start site within the MGMT genomic sequence (14). pCAT/MP (Fig. 1, construct I) was generated by cloning the 88-bp minimal promoter sequence into pOCAT1 at the XbaI site such that the sense-strand CAT sequence located downstream of the promoter could be transcribed (14). We then created a series of constructs based on pCAT/MP. pCAT/MP-E59 and pCAT/MP-E16 (Fig. 1, constructs II and IV) were made by inserting the 59-bp or a synthetic 16-bp MGMT enhancer fragment, respectively (see Fig. 3A), into a polylinker HincII site. pCAT/MP-E59inv (Fig. 1, construct III) was prepared by subcloning the 59-bp fragment into the HincII site in the inverse orientation; pCAT/MP-E16.16 (Fig. 1, construct V) was produced by inserting tandem copies of the 16-bp enhancer sequence into the polylinker site. Correct orientation and integrity of the inserted fragments were established by DNA sequencing.
Figure 1.
Schematic diagrams of MGMT–CAT cDNA constructs. Construct I (pCAT/MP) contains the full-length CAT cDNA and the 88-bp MGMT minimum promoter sequence subcloned into an XbaI site upstream of the HincII site in the polylinker of pOCAT1. Constructs II (pCAT/MP-E59), III (pCAT/MP-E59inv), IV (pCAT/MP-E16), and V (pCAT/MP-E16.16) were generated by insertion, respectively, of the MGMT 59-bp enhancer sequence, the inverse 59-bp sequence, 16-bp enhancer sequence, or tandem copies of the 16-bp sequence into the HincII site.
Figure 3.
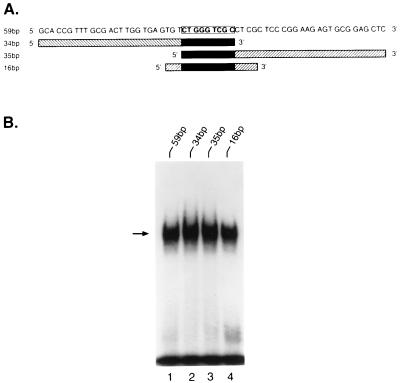
Nuclear protein binding to the 59-bp enhancer and its subfragments. (A) The 59-bp fragment represents the full-length MGMT enhancer sequence. To localize the minimal enhancer element(s) within this region, three subfragments, 3′ 34 bp, 5′ 35 bp, and middle 16 bp, were synthesized. A common 9-mer sequence is highlighted. (B) Band-shift assays were performed with CEM nuclear extract and 5′ 32P-labeled 59-bp fragment (lane 1) or subfragments (lanes 2–4). DNA–protein complexes are indicated by the arrow.
The constructs were electroporated into cells by using a Bio-Rad Gene Pulser apparatus at 960 μF and 220–240 V (22). pSV-β-Gal (5 μg) (Promega), a plasmid that expresses β-galactosidase under the control of the SV40 promoter, was cotransfected with each CAT–MGMT hybrid construct to control for transfection efficiency.
Enzyme Assays.
CAT and β-galactosidase activities were measured in crude cell extracts 48 h after transfection. CAT activity was measured by a two-phase liquid scintillation counting assay using [3H]acetylcoenzyme A (Amersham) as a substrate (23). β-Galactosidase activity was assessed spectrophotometrically with chlorophenol red β-d-galactopyranoside (Boehringer-Mannheim) as the substrate (24). CAT activity was calculated as cpm of [3H]acetylchloramphenicol per h per mg of protein, divided by the β-galactosidase activity (A570 per h per mg) to correct for differences in transfection efficiency. MGMT activity was measured as described (25) using a DNA substrate treated with [3H]methylnitrosourea (22 Ci/mmol). Western blot analysis of MGMT was performed by electrophoresis of cell extracts (50 μg) on a SDS/12% polyacrylamide gel (by using a Bio-Rad MiniProtean II system), followed by protein electroblotting to poly(vinylidene difluoride) membranes (Immobilon P; Millipore, Bedford, MA). Membranes were cut horizontally into two pieces. The section containing the higher molecular weight protein was probed with an anti-β-tubulin monoclonal antibody (Sigma), and the lower section was probed with the anti-MGMT monoclonal antibody MT3.1 (26). Gold-labeled secondary antibody was silver-enhanced with Auroprobe and IntenSE reagents (Amersham), according to the manufacturer’s instructions.
RESULTS
MGMT Enhancer-Mediated Up-Regulation of CAT Expression Correlates with Endogenous MGMT Levels.
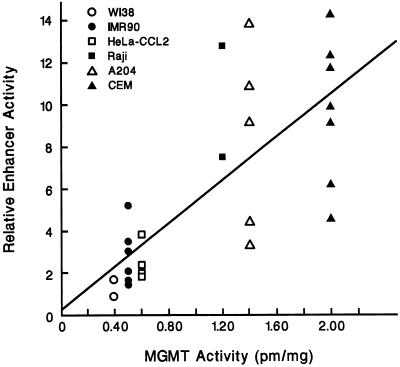
Previous experiments (14) in this laboratory identified a 59-bp DNA enhancer sequence located at the first exon–intron boundary of the human MGMT gene. We measured the CAT activity due to the enhancer in pCAT/MP-E59 (Fig. 1, construct II) relative to that of pCAT/MP containing only the minimal promoter (Fig. 1, construct I) and the MGMT activity in various human Mer+ cell lines. As demonstrated in Fig. 2, CAT expression was significantly higher in those cells (e.g., CEM) that contained high levels of MGMT compared with those cells (e.g., WI38) that had relatively low MGMT activity (R = 0.77; P < 0.000004). These observations may reflect differences in MGMT enhancer activity among the different cell lines.
Figure 2.
Correlation between enhancer activity and endogenous MGMT levels in Mer+ cell lines. Various human Mer+ cell lines, indicated by different symbols, were transiently transfected with the CAT reporter gene construct pCAT/MP-E59, which contains the minimal MGMT promoter and the 59-bp enhancer sequence. Each point represents a separate experiment. Values representing CAT activities relative to those obtained from each cell line transfected with pCAT/MP correlate with the endogenous MGMT levels in these cell lines (R = 0.77).
Minimal Enhancer Cis Element Required for Interaction with MEBP.
To define the cis element(s) within this enhancer sequence, the full-length fragment and its three related large subfragments (Fig. 3A) were synthesized, 5′-radiolabeled, and incubated with nuclear extract from CEM cells (a Mer+ cell line), before analysis of DNA–protein complexes in an electrophoretic band-shift assay. We found that the MEBP bound to all of the DNA fragments (Fig. 3B), indicating that all three subfragments contained the cis element.
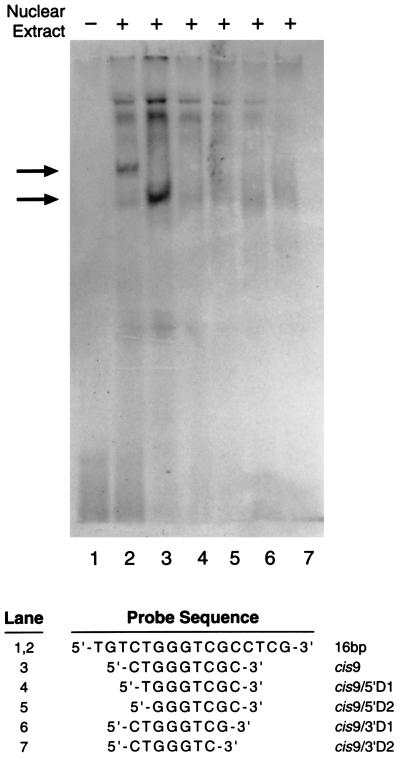
All subfragments contained the sequence 5′-CTGGGTCGC-3′ (Fig. 3A), which suggested that this nanomer is involved in protein binding. When this 9-bp sequence was tested, the band-shift assay showed that this fragment alone was sufficient for protein binding (Fig. 4, lane 3). Band-shift assays using the 9-bp oligonucleotide with either 1- or 2-bp deletions from its 5′ or 3′ ends demonstrated that none of these truncated oligonucleotides interacted with MEBP (Fig. 4, lanes 4–7). Therefore, the 9-bp sequence is the minimal MGMT DNA enhancer cis element required for efficient MEBP binding.
Figure 4.
Minimum enhancer cis element defined by deletion analysis. A 5′-end-labeled synthetic 9-mer (cis9; lane 3) or oligonucleotides (lanes 4–7) with deletions from either their 5′ or 3′ end (indicated at the bottom of the figure) were incubated with CEM nuclear extract before the band-shift assay. Only the 16-bp (lane 2) and cis9 (lane 3) fragment that contains the full 9-bp sequence show protein binding (arrows), suggesting that this 9-bp fragment is the minimal enhancer element. Lane 1 shows the 16-bp sequence without nuclear extract.
Characterization of MEBP-Enhancer Binding Interaction.
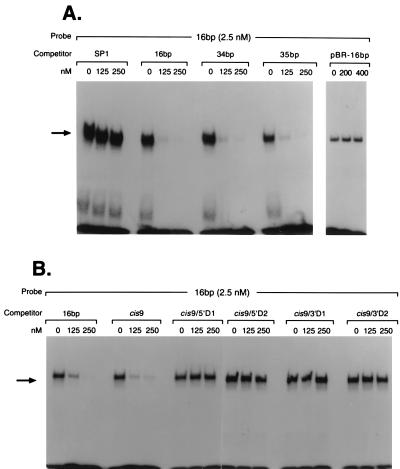
The specificity of MEBP–DNA binding was determined by using the band-shift assay. Unlabeled 16-, 34-, and 35-bp enhancer fragments, as shown in Fig. 3A, were tested for their ability to compete with the 32P-labeled 16-bp probe for MEBP binding. Incubation of CEM nuclear extract with 50- and 100-fold excess (125 and 250 nM) unlabeled specific competitors followed by addition of the radiolabeled 16-bp fragment resulted in a concentration-dependent reduction in complex formation (Fig. 5A). Addition of up to 100-fold excess of a nonspecific competitor (the 22-mer SP1 binding sequence 5′-ATTCGATCGGGGCGGGGCGAGC-3′) had no effect on complex formation (Fig. 5A). In addition, up to 160-fold excess of a synthetic 16-mer (pBR-16bp) with the same base composition but a different sequence (5′-CCGGGAGCACACAAGC-3′) failed to compete with the specific radiolabeled probe (Fig. 5A).
Figure 5.
Specificity of the enhancer–protein interactions. CEM nuclear extracts were pretreated with increasing concentrations of the indicated unlabeled competitor fragments before they were incubated with the radiolabeled 16-bp probe. (A) The band-shift assay shows that all of the fragments efficiently competed with the labeled probe, except the nonspecific sequences SP1 and pBR-16bp, which did not effectively compete. (B) Competition for the cis–trans interaction by an unlabeled minimal cis-element sequence and its deletion fragments. Deletion of 1 bp from either end of the 9-mer sequence abolished the competitive protein-binding activity. DNA–protein complexes are indicated by the arrow.
The specificity of the cis–trans interaction was examined further with the 9-bp and truncated sequences shown in Fig. 4. The results revealed that, with the exception of cis9 (the minimum enhancer cis element), all the oligonucleotides with 1- or 2-bp deletions were ineffective competitors (Fig. 5B).
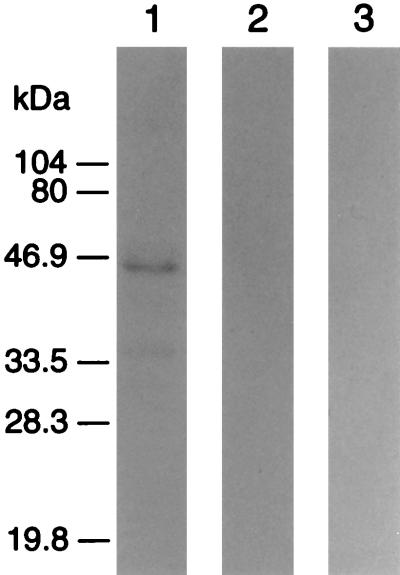
MEBP–DNA binding characteristics were further examined by pretreating the radiolabeled 16-bp probe with DNase I and pretreating the nuclear extract with either SDS or proteinase K. All three treatments abolished the band shifts, which indicates that the complex detected in this assay is indeed composed of DNA and protein (data not shown). Southwestern blot analysis of MEBP in CEM cells indicated a single band corresponding to a protein with a molecular mass of approximately 45 kDa (Fig. 6). This band was completely suppressed by competition with 150-fold of the unlabeled 16-bp oligonucleotide and was not evident when probed with the random sequence pBR-16bp (Fig. 6, lanes 2 and 3), indicating the specificity of the observed interaction in Fig. 6, lane 1.
Figure 6.
Southwestern blot analysis of enhancer binding protein. Nuclear extract from CEM cells, after SDS/PAGE and electroblotting to Immobilon-P membrane, was hybridized with the radiolabeled 16-bp enhancer (lane 1), was preincubated with 150-fold excess of the unlabeled 16-bp before hybridization with the radiolabeled 16-bp probe (lane 2), or was hybridized with the radiolabeled random sequence pBR-16bp (lane 3).
We also examined other Mer+ cell lines, including Molt 4, A204, HeLa CCL2 and Hep G2, for MEBP in their nuclei by band-shift assay. We found that MEBP was expressed in every line we examined (data not shown).
The Cis–Trans Interaction at the 16-bp Sequence Up-Regulates CAT Expression in Mer+ and Mer− Cells.
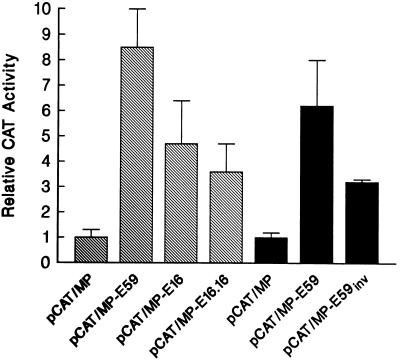
To investigate the function of the 16-bp cis element in gene expression in vivo, we transiently transfected A204 cells (a Mer+ cell line) with hybrid MGMT–CAT plasmid constructs (Fig. 1) that contained the 88-bp minimum MGMT promoter sequence plus different lengths of the enhancer fragment. Fig. 7 shows the CAT activity of these constructs relative to that of the enhancer-deficient construct, pCAT/MP (Fig. 1, construct I). Relative CAT activity was significantly increased in cells transfected with enhancer-containing constructs (Fig. 1, constructs II, IV, and V). The highest activity occurred in cells transfected with pCAT/MP-E59, which contains the full-length enhancer sequence (construct II). The construct pCAT/MP-E16 (construct IV), containing the 16-bp enhancer sequence, expressed less enhancer activity than the 59-bp enhancer-containing construct, pCAT/MP-E59 (construct II), suggesting that the sequences flanking the 16 bp are required for efficient MEBP binding and may contain additional protein-binding sites that result in high enhancer activity. Interestingly, two copies of the 16-bp enhancer sequence (construct V) produced no more CAT activity than one copy of the enhancer element (construct IV). This result indicates that a single copy of the cis element, as occurs in the natural sequence, is sufficient for enhancer activity.
Figure 7.
Effect of enhancer fragments on MGMT minimal promoter activity as determined by CAT reporter assays. A204 Mer+ cells (shaded columns) and TK6 Mer− cells (solid columns) were transiently transfected with the indicated CAT reporter gene constructs (described in Fig. 1). Promoter activities are expressed relative to that of pCAT/MP containing the minimal promoter without an enhancer. Values represent the mean ± SD from three or more experiments.
When we transfected the Mer− cell line TK6 with pCAT/MP-E59 (construct II), CAT activity was significantly increased, relative to that of the enhancerless construct pCAT/MP (construct I), consistent with the previous report by Harris et al. (15). pCAT/MP-E59inv, in which the 59-bp sequence is in the inverse orientation, also stimulated CAT expression, consistent with an enhancer function (Fig. 7). These results indicate that the cis–trans interaction up-regulates CAT expression in both Mer− and Mer+ cells.
Subcellular Localization of MEBP.
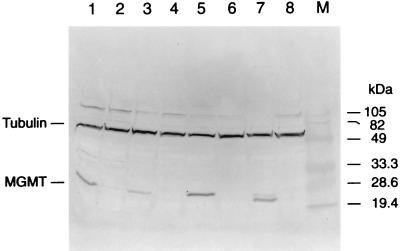
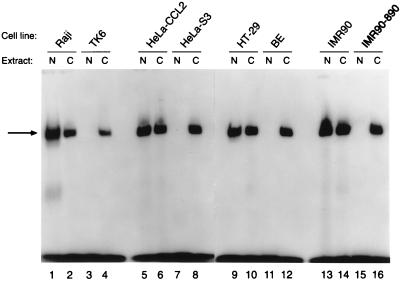
Because we found cis–trans MGMT enhancer activity in Mer− cells (Fig. 7), we expected to find MEBP in band-shift assays with Mer− cell nuclear extracts. However, we were surprised to find that this was not the case and that MEBP was absent from Mer− nuclei. Because CAT vectors must traverse the cytoplasm, we postulated that the MEBP might be present in the cytoplasm of Mer− cells. To test this hypothesis, four Mer−/Mer+ cell pairs were selected and their Mer phenotypes were confirmed by Western blot analysis (Fig. 8). As expected, Raji, HeLa-CCL2, HT29, and IMR90 cells were MGMT-positive (Mer+), and TK6, HeLa-S3, BE, and IMR90–890 were MGMT-deficient (Mer−). Band-shift assays with the 16-bp enhancer fragment and nuclear or cytoplasmic extracts from these cell lines showed that MEBP was present in the nuclear extracts of all Mer+ cells tested, but it was completely absent from the nuclear extracts of the Mer− cells (Fig. 9). As predicted, MEBP was present in the cytoplasm of all of the cell lines regardless of their Mer phenotype (Fig. 9).
Figure 8.
Western blot analysis of MGMT levels in a panel of Mer+/Mer− cell line pairs. Western blot of protein extracted from Mer+ cell lines (lanes 1, 3, 5, and 7) and Mer− cell lines (lanes 2, 4, 6, and 8). Lanes: 1, Raji; 2, TK6; 3, HeLa-CCL2; 4, HeLa-S3; 5, HT-29; 6, BE; 7, IMR90; 8, IMR90–890; M, molecular weight markers. The membrane was probed with MT5.1, a monoclonal antibody specific for MGMT (lower bands), or an anti-β-tubulin antibody (upper bands) to control for loading.
Figure 9.
Intracellular distribution of MEBP. Band-shift assays employed the radiolabeled 16-bp enhancer sequence as a probe and nuclear (N) or cytoplasmic (C) extracts from the indicated cell lines whose Mer phenotypes are indicated in Fig. 8. MEBP indicated by the arrow can be seen in the cytoplasmic extracts of all cell lines examined but in the nuclear extracts of only the Mer+ cell lines (Raji, HeLa-CCL2, HT-29, and IMR90).
DISCUSSION
To understand how MGMT levels are regulated, we must begin by identifying the critical regulatory elements in the MGMT gene and the proteins that bind to those elements. The high correlation between enhancer activity and MGMT levels in Mer+ cells as demonstrated by CAT reporter gene assay (Fig. 2) strongly suggests that the 59-bp sequence at the first exon–intron boundary of the MGMT gene plays a role in regulating MGMT expression in human cells in vivo. From binding experiments using electrophoretic band-shift analysis, we learned that the minimal cis element is the 9-mer 5′-CTGGGTCGC-3′ (sequence positions +169 to +178), and from Southwestern blot analysis, we learned that the nuclear protein that binds to this sequence is approximately 45 kDa.
A search of the known transcription factor binding motifs, using the program signal scan (27), identified a single sequence in an SV40 enhancer element that showed a 7-base homology with the MGMT 9-mer. No binding protein has yet been identified for the SV40 enhancer element (28). Although the minimal protein binding element for the MGMT gene is only a 9-mer, enhancer activity in CAT assays increased as we extended the length of the element (Fig. 7), suggesting that the 5′ and 3′ flanking sequences of this enhancer contribute to efficient transcriptional activity.
The most surprising aspect of these studies was the finding that the 59-bp enhancer functioned effectively in CAT assays in Mer− cells, yet the MEBP was absent from Mer− nuclei. This apparent contradiction was resolved with the finding that MEBP is in fact present in the cytoplasm of Mer− cells (Fig. 9). The 59-bp element is a very strong enhancer—its deletion from the maximal MGMT promoter results in greater than 95% loss of promoter activity in CAT assays (14). It is possible, therefore, that the exclusion of MEBP from the nucleus of Mer− cells accounts for the drastic down-regulation of MGMT in these cells.
Transcription of MGMT in Mer− cells has been undetectable (9–11, 29) in all but one study, which used extensive reverse transcription-coupled PCR (30). If the residual promoter activity observed in CAT assays in the absence of the 59-bp enhancer occurs in vivo, then additional mechanisms must be involved to account for the total suppression of the MGMT gene in Mer− cells.
Sequestration of a transcription factor in the cytoplasm is not without precedent as a mechanism for transcriptional suppression. Loss of p53 function has been attributed to its abnormal cytoplasmic sequestration with concomitant nuclear exclusion (31). There are numerous potential mechanisms for the nuclear exclusion of MEBP. Mutation in a putative nuclear targeting domain of MEBP is one possibility, which could be addressed by the isolation of the MEBP cDNA—a goal we are actively pursuing. Alternatively, Mer− cells may have alterations in their nuclear membranes that impede MEBP translocation; MEBP may be abnormally anchored to a cytoplasmic structure or protein, or the MEBP of Mer− cells may be unable to bind to a nuclear target. It is also possible that biochemical modification, such as phosphorylation, may be required for MEBP to translocate into the nucleus and that such modification is altered in Mer− cells.
To date, the only clear difference between Mer+ and Mer− cells, apart from MGMT suppresion, relates to cytosine methylation of the gene (32). Specifically, the CpG island at the 5′ flanking region of the gene, which includes the promoter and the 59-bp enhancer region, is highly methylated in Mer− cells, whereas it is totally methylation free in Mer+ cells (33, 34). The role of such methylation in gene suppresion is still a matter of controversy (35); both views, one that methylation directly affects transcription factor binding and the other that failure of transactivating proteins to bind permits methylation, may prevail. It seems unlikely that nuclear localization of the MEBP is due to its tight binding to the enhancer element and that its nuclear exclusion is a result of methylation at the enhancer site. It seems more likely that when MEBP is excluded from the nucleus and MGMT transcription is down-regulated, the associated conformational change in the cis-enhancer element could expose it to DNA methylase, leading to de novo CpG methylation and stabilization of the transcriptional status (35).
In summary, we have observed a difference between the intracellular distribution of MEBP in Mer+ and Mer− cells that suggests MEBP not only plays a role in the regulation of constitutive MGMT expression in Mer+ cells but may also account for MGMT down-regulation in Mer− cells. Isolation of the MEBP gene from both Mer+ and Mer− cells and characterization of the encoded protein should help define the mechanism for MEBP nuclear exclusion and provide further insights into MGMT regulation in both normal and malignant cells.
Acknowledgments
We thank Sue Vallance for editorial assistance. This work was supported by CA14799 and Cancer Center Support CORE Grant CA21765 from the National Institutes of Health, and by the American Lebanese Syrian Associated Charities.
ABBREVIATIONS
- MGMT
O6-methylguanine-DNA methyltransferase
- Mer
methyl repair phenotype
- CAT
chloramphenicol acetyltransferase
- MEBP
MGMT enhancer binding protein
- DTT
dithiothreitol
- FCS
fetal calf serum
- SV40
simian virus 40
References
- 1.Pegg A E, Byers T L. FASEB J. 1992;6:2302–2310. doi: 10.1096/fasebj.6.6.1544541. [DOI] [PubMed] [Google Scholar]
- 2.D’Incalci M, Citti L, Taverna P, Catapano C V. Cancer Treat Rev. 1988;15:279–292. doi: 10.1016/0305-7372(88)90026-6. [DOI] [PubMed] [Google Scholar]
- 3.Brent T P, Houghton P J, Houghton J A. Proc Natl Acad Sci USA. 1985;82:2985–2989. doi: 10.1073/pnas.82.9.2985. [DOI] [PMC free article] [PubMed] [Google Scholar]
- 4.Dumenco L L, Allay E, Norton K, Gerson S L. Science. 1993;259:219–222. doi: 10.1126/science.8421782. [DOI] [PubMed] [Google Scholar]
- 5.Wilson R E, Hoey B, Margison G P. Carcinogenesis. 1993;14:679–683. doi: 10.1093/carcin/14.4.679. [DOI] [PubMed] [Google Scholar]
- 6.Day R S, Ziolkowski C H J, Scudiero D A, Meyer S A, Lubiniecki A S, Girardi A J, Galloway S M, Bynum G D. Nature (London) 1980;288:724–727. doi: 10.1038/288724a0. [DOI] [PubMed] [Google Scholar]
- 7.Strauss B S. Adv Cancer Res. 1985;45:45–105. doi: 10.1016/s0065-230x(08)60266-3. [DOI] [PubMed] [Google Scholar]
- 8.Gerson S L, Trey J E, Miller K, Berger N A. Carcinogenesis. 1986;7:745–749. doi: 10.1093/carcin/7.5.745. [DOI] [PubMed] [Google Scholar]
- 9.Ostrowski L E, von Wronski M A, Bigner S H, Rasheed A, Schold C S, Brent T P, Mitra S, Bigner D D. Carcinogenesis. 1991;12:1734–1744. doi: 10.1093/carcin/12.9.1739. [DOI] [PubMed] [Google Scholar]
- 10.He X, Ostrowski L E, von Wronski M A, Friedman H S, Wikstrand C J, Bigner S H, Rasheed A, Batra S K, Mitra S, Brent T P, Bigner D D. Cancer Res. 1992;52:1144–1148. [PubMed] [Google Scholar]
- 11.von Wronski M A, Harris L C, Tano K, Mitra S, Bigner D D, Brent T P. Oncology Res. 1992;4:167–174. [PubMed] [Google Scholar]
- 12.Kroes R A, Erickson L C. Carcinogenesis. 1995;16:2255–2257. doi: 10.1093/carcin/16.9.2255. [DOI] [PubMed] [Google Scholar]
- 13.Harris L C, Potter P M, Tano K, Shiota S, Mitra S, Brent T P. Nucleic Acids Res. 1991;19:6163–6167. doi: 10.1093/nar/19.22.6163. [DOI] [PMC free article] [PubMed] [Google Scholar]
- 14.Harris L C, Remack J S, Brent T P. Nucleic Acids Res. 1994;22:4614–4619. doi: 10.1093/nar/22.22.4614. [DOI] [PMC free article] [PubMed] [Google Scholar]
- 15.Harris L C, Potter P M, Remack J S, Brent T P. Cancer Res. 1992;52:6404–6406. [PubMed] [Google Scholar]
- 16.Zerivitz K, Akusjarvi G. Gene Anal Tech. 1989;6:101–109. doi: 10.1016/0735-0651(89)90016-2. [DOI] [PubMed] [Google Scholar]
- 17.Malter J S. Science. 1989;246:664–666. doi: 10.1126/science.2814487. [DOI] [PubMed] [Google Scholar]
- 18.Chen F Y, Amara F M, Wright J A. EMBO J. 1993;12:3977–3986. doi: 10.1002/j.1460-2075.1993.tb06075.x. [DOI] [PMC free article] [PubMed] [Google Scholar]
- 19.Laemmli U K. Nature (London) 1970;227:680–685. doi: 10.1038/227680a0. [DOI] [PubMed] [Google Scholar]
- 20.Towbin H, Stachlin T, Gordon J. Proc Natl Acad Sci USA. 1979;76:4350–4354. doi: 10.1073/pnas.76.9.4350. [DOI] [PMC free article] [PubMed] [Google Scholar]
- 21.Prost E, Moore D D. Gene. 1986;45:107–111. doi: 10.1016/0378-1119(86)90138-1. [DOI] [PubMed] [Google Scholar]
- 22.Doffinger R, Pawlita M, Sczakiel G. Nucleic Acids Res. 1988;16:11840. doi: 10.1093/nar/16.24.11840. [DOI] [PMC free article] [PubMed] [Google Scholar]
- 23.Neumann J R, Morency C A, Russian K O A. BioTechniques. 1987;5:444–447. [Google Scholar]
- 24.Eustic D C, Feldman P A, Colberg-Poley A M, Buckney R M, Neubauer R H. BioTechniques. 1991;11:739–742. [PubMed] [Google Scholar]
- 25.Brent T P. Pharmacol Ther. 1985;31:121–140. doi: 10.1016/0163-7258(85)90040-3. [DOI] [PubMed] [Google Scholar]
- 26.Brent T P, von Wronski M A, Pegram C N, Bigner D D. Cancer Res. 1990;50:58–61. [PubMed] [Google Scholar]
- 27.Prestridge D S. Cabios. 1991;7:203–206. doi: 10.1093/bioinformatics/7.2.203. [DOI] [PubMed] [Google Scholar]
- 28.Davidson I, Fromental C, Augereau P, Wildeman A, Zenke M, Chambon P. Nature (London) 1986;323:544–548. doi: 10.1038/323544a0. [DOI] [PubMed] [Google Scholar]
- 29.Mitra S, Kaina B. Nucleic Acid Res Mol Biol. 1993;44:109–142. doi: 10.1016/s0079-6603(08)60218-4. [DOI] [PubMed] [Google Scholar]
- 30.Pieper R O, Futscher B W, Dong Q, Ellis T M, Erickson L C. Cancer Commun. 1990;2:13–20. doi: 10.3727/095535490820874812. [DOI] [PubMed] [Google Scholar]
- 31.Moll U M, Ostermeyer A G, Haladay R, Winkfield B, Frazier M, Zambetti G. Mol Cell Biol. 1996;16:1126–1137. doi: 10.1128/mcb.16.3.1126. [DOI] [PMC free article] [PubMed] [Google Scholar]
- 32.Qian X, von Wronski M A, Brent T P. Carcinogenesis. 1995;16:1385–1390. doi: 10.1093/carcin/16.6.1385. [DOI] [PubMed] [Google Scholar]
- 33.Qian X, Brent T P. Proc Am Assoc Cancer Res. 1996;37:536. (abstr.). [Google Scholar]
- 34.Graessmann M, Graessmann A. In: DNA Methylation: Molecular Biology and Biological Significance. Jost J P, Saluz H P, editors. Basel: Birkhäuser; 1993. pp. 404–424. [Google Scholar]
- 35.Pieper R O, Patel S, Ting S A, Futscher B W, Costello J F. Proc Am Assoc Cancer Res. 1996;37:536. (abstr.) [Google Scholar]


