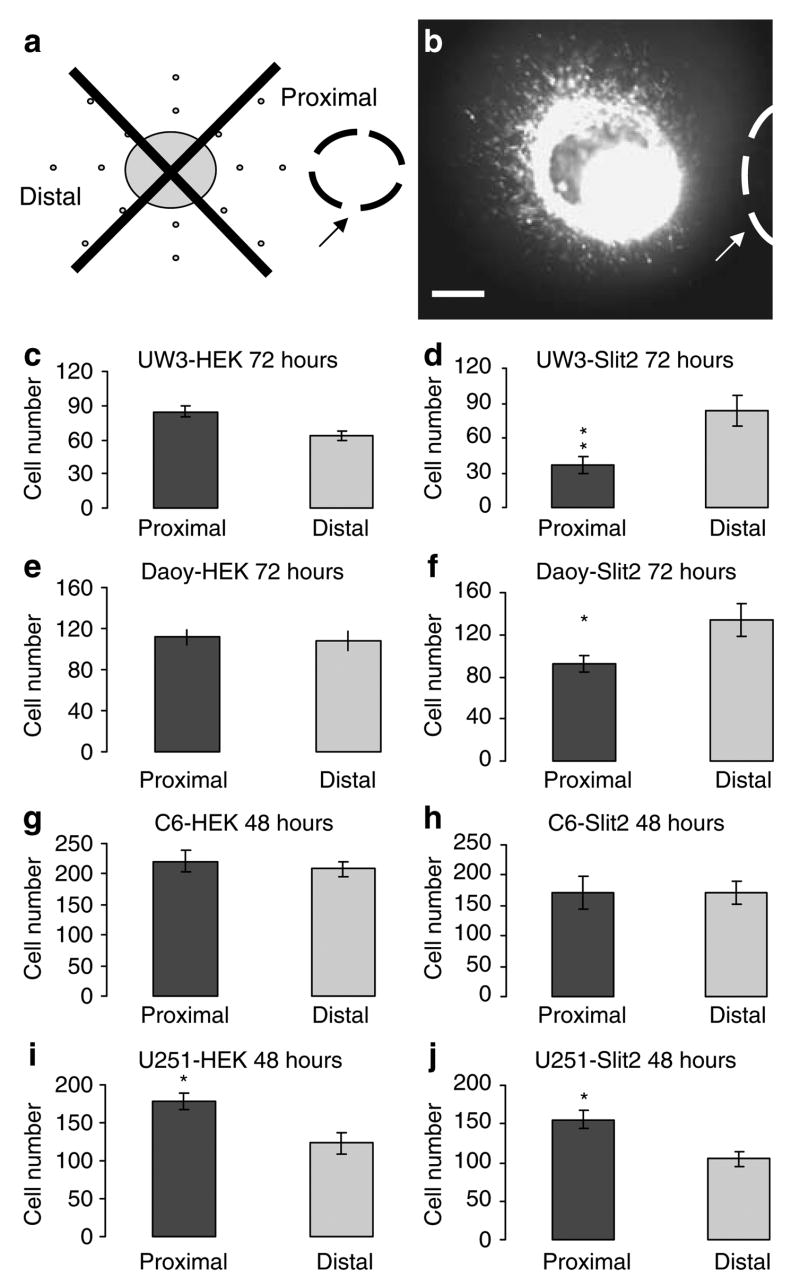
Figure 1.
Medulloblastoma spheroids respond to Slit2. (a) Model of the tumor spheroid cocultured with human embryonic kidney (HEK) or Slit2 aggregate in a collagen gel. Arrow denotes placement of HEK or Slit2 aggregate. (b) Still photograph of Cell Tracker labeled UW3 medulloblastoma spheroid implanted 550 μm from a Slit2 aggregate after 72 h. Arrow denotes placement of Slit2 aggregate. Scale bar = 250 μm. (c–j) Proximal and distal quadrant distribution of UW3 (c–d), Daoy (e–f) medulloblastoma cells and C6 (g–h), U251 (i–j) glioma cells cocultured with HEK control aggregates (c, e, g, i) or Slit2 aggregates (d, f, h, j) after 72 (UW3 and Daoy) and 48 h(C6 and U251). Error bars represent s.e.m. Asterisks denote significance at P < 0.05(*) and P < 0.01(**).

