

Abstract
Oxidation of the guanosine moiety in DNA has become a hallmark biomarker in assessing oxidative stress. The oxidation of guanosine in the nucleotide triphosphate pool has been overlooked due to the lack of a reliable methodology. This method describes a sample processing and high performance liquid chromatography with electrochemical detection protocol for the analysis of the cellular pool of guanosine triphosphates and oxidized guanosine triphosphates. Validation of this method is demonstrated along with evaluation of these analytes in control and oxidizing conditions in vitro and in HEK 293T cells. Oxidation of this triphosphate pool occurred independently of oxidation to DNA.
1. Introduction
Oxidative stress is defined as the deleterious impact in cell function as a consequence of the loss in homeostatic balance between reactive oxygen species (ROS) and antioxidants in the cellular milieu [1]. ROS are formed continuously as a result of normal cellular respiration, enzymatic metabolism, and exogenous insults [2]. Oxidative stress has been implicated in the onset and development of several pathological processes including cancer and age-related neurodegenerative diseases such as Parkinson’s Disease (PD) [3–6]. The interaction of ROS with DNA has the potential to generate a number of possible DNA lesions. Among the four DNA bases, guanine has the lowest oxidation potential and it is the most readily oxidized [7–9]. Two-electron oxidation of guanine results in the formation of 8-hydroxy-2′-deoxyguanosine (oxo8dG), which is the major oxidation product of guanine. This species is one of the most frequently studied oxidized DNA base products, and it has attracted considerable interest as a biomarker of oxidative stress associated with diseases ranging from cancer to neurological deficits [10–13]. It has been shown that oxo8dG is produced by hydroxyl radical (OH•) attack, the most oxidizing ROS to arise in biological systems, on the C8 position of 2′-deoxyguanosine (2-dG) in DNA [14,15]. Oxo8dG is promutagenic due to its tendency to preferentially pair with adenosine over cytosine during DNA replication, leading to G:C → T:A transversions [16]. Increases in oxo8dG levels in DNA can also occur after OH• radical attack to the cellular 2′-deoxyguanosine 5′-triphosphate (dGTP) pool producing oxidized 2-dG 5′-triphosphate (oxo8dGTP) [17]. Oxo8dGTP can then be incorporated into DNA during cellular replication or during DNA repair. The dGTP nucleotide pool is mainly located in the cytoplasm; therefore, it is more available for attack by ROS as compared to DNA, which is protected by histones and tightly packaged in the nucleus.
Guanosine 5′-triphosphate (GTP), required for RNA synthesis and several normal cellular functions, can also be modified by ROS. GTP concentrations in the cytoplasm are hundreds of times larger than dGTP [18]. This suggests that under conditions of high ROS levels, significantly more oxidized GTP (oxo8GTP) than oxo8dGTP could be produced in the cell. However, due to the lack of a reliable way to quantify these oxidation products, little is know of the degree of oxidation to dGTP or GTP pools after ROS attack and the possible impact of these oxidation products to cellular physiology. Recently it has been shown that the dGTP pool endures greater levels of oxidation after irradiation as compared to DNA [19]. Levels of oxo8dG in cells, tissue, and whole animal have been reported as an important biomarker for oxidative stress when evaluating disease pathologies ranging from cancer to diabetes [5,20]. However, most of this evidence has been accrued by assessment of oxo8dG via antibody technology. It is necessary to investigate the relative contributions of oxidized dGTP and GTP to this biomarker assessment as well as the particular susceptibility of these cellular pools to oxidative stress as compared to DNA.
The following study describes a sample processing and HPLC-EC methodology for the simultaneous determination of dGTP, GTP oxo8dGTP, and oxo8GTP in cells. Optimization of retention times was achieved by dephosphorylating the compounds to their respective guanosine nucleoside forms 2-deoxyguanosine (2dG), guanosine (G), and their oxidized corresponding forms oxo8dG and oxo8G, and detection selectivity was gained by detection at specific voltages by the coularray detector. Although hydrolysis of guanosine nucleotide triphosphates to their respective guanosine nucleosides by alkaline phosphatase (EC 3.1.3.1) has been reported as a preparative step for HPLC with UV detection, validation of this technique as a reliable assessment of dGTP and GTP concentrations in the cells concomitantly with assessment of their oxidized forms, oxo8dGTP and oxo8GTP, has not been established until now [21]. The method described here was used to quantify the basal levels of dGTP and GTP in human embryonic kidney (HEK 293T) and to assess the susceptibility of theses pools to ROS attack. Oxo8dG was quantified in nuclear DNA extracts of the HEK393T cells under oxidizing conditions that impacted the GTP pool, and shown to be equal to that of controls. Thus, these results suggest a novel way of assessing the oxidation of cellular guanosine triphosphates as a biomarker of oxidative stress that occurs independently from oxidation to DNA. The sample processing and chromatographic analysis presented permit us to demonstrate that under conditions in which ROS are produced, the GTP pool can be impacted without noticeable changes to the dGTP pool or the guanine base in DNA.
2. Experimental
2.1 Chemicals and Reagents
All reagents were purchased from Sigma-Aldrich (St. Louis, MO), unless otherwise indicated. 8-oxoguanosine-5′-triphosphate (oxo8GTP) and 8-oxo-2′-deoxyguanosine-5′-triphosphate (oxo8dGTP) were purchased from TriLink Biotechnologies (San Diego, CA). 8-hydroxy guanosine (oxo8G) was obtained from Cayman Chemical (Ann Arbor, MI). Ultrapure water was obtained from a Milli-Q UF-Plus apparatus (Millipore).
2.2 Cell culture
HEK 293T cells purchased from American Type Culture Collection (Menasses, VA) were grown in T75 cell culture flasks (Costar, Corning Inc., Corning, NY) at 37° C, 5% CO2. Cells were maintained in 1X Dulbecco’s Modification of Eagle’s Medium with 4.5 g/L glucose and L-glutamine, 10% fetal bovine serum, 1 mM sodium pyruvate, 1X non-essential amino acids, 1000 international units (IU) penicillin – 1 mg/mL streptomycin, and 50 μg/mL gentamicin sulfate. All media reagents were purchased from CellGro® technologies (Mediatec Inc., Herndon, VA, USA). All in vitro experiments were conducted with harvested cells that had reached confluency, approximately 3 × 10⁷ cells per flask. Mycophenolic Acid (MPA) was solubilized in ethanol and diluted in cell culture media for MPA experiments. A final concentration of 2 μM MPA was added in a subset of cell colonies and incubated for one hour at 37°C, a dose previously shown not to affect cell viability [22]. For oxidation experiments, control cell populations were incubated in 1mM L-ascorbic acid and oxidation colonies contained 1mM L-ascorbic acid and 10μM cupric sulfate. All reagents were prepared in media before addition to flasks and incubation at 37°C for four hours.
2.3 dGTP, GTP, oxo8dGTP, and oxo8GTP extraction
All the extraction steps were performed on ice. Immediately prior to processing, confluent flasks of HEK 293T cells were assessed for viability using the tryphan blue exclusion method and counted. After washing three times with ice-cold phosphate-buffered saline (PBS), cells were harvested with the addition of 3 mL of 1X trypsin-EDTA and pelleted by centrifugation at 2,000 × g, 4°C. Cell pellets were pooled from two flasks per sample in 6mL of PBS. Following centrifugation, protein was precipitated using 1.5mL of 6% Trichloroacetic Acid (TCA), vortex-mixed for 20s, ice-bathed for 10 minutes, and vortex-mixed again for 20s. Cell extracts were then centrifuged at 13,000 rpm for 10 minutes at 4°C. The resulting supernatant was neutralized to pH 6 with a solution containing 3M KOH and 3M KHCO3. Samples were stored at −80°C until undergoing the dephosphorylation process.
2.4 dGTP, GTP, oxo8dGTP, and oxo8GTP dephosphorylation
Neutralized cell extracts, standards, and in vitro reactions were treated similarly for dephosphorylation. On ice, 25 IUs of alkaline phosphatase (dissolved in Tris-HCl pH 8.0), 1.8 mM sodium acetate, and 100mM Tris-HCl, were added to 10μL of sample in total volume of 20 μL. After incubation at 37°C for 1 hour, the dephosphorylation reaction was stopped by placing on ice. This was followed by filtering through Ultrafree-MC (30-kD) tubes (Millipore Corp., Bedford, MA). Quantification of the generated nucleosides (2-dG, G, oxo8dG and oxo8G) was carried out by injecting 10μL of the filtrate into the HPLC-EC for in vitro reactions and 20μL of filtrate for cell extracts.
2.5 Instrument and Chromatographic Conditions
Guanosine nucleotide triphosphates, guanosine nucleosides, and oxidized derivatives were resolved by HPLC with a reverse phase YMCbasic column (4.6 × 150 mm; particle size 3-micron) (YMC Inc., Wilmington, NC) and quantified using a CoulArray electrochemical detection system (ESA, Inc., Chelmsford, MA). An isocratic mobile phase consisting of 100 mM sodium acetate, pH 5.2, 4% Methanol (HPLC Grade) diluted in water polished with C18 Sep-Pak cartridges (Waters Corp., Milford, MA) was utilized to elute the guanosine nucleotide triphosphates and guanosine nucleosides from the column. The mobile phase was filtered using 0.2 μm nylon filters and degassed by sonication before use with the HPLC. Potentials of the twelve coulometric analytical cells of the CoulArray system, placed in series, were as follows: 50, 125, 175, 200, 250, 380, 500, 700, 785, 850, 890, 900 mV. Data were recorded, analyzed, and stored using CoulArray for Windows data analysis software (ESA Inc., Chelmsford, MA).
2.6 Calibration standards
Stock solutions of each analyte were prepared by individually dissolving commercially available, pure guanosine and oxidized guanosine nucleosides as well as guanosine nucleotide triphosphates in mobile phase. For the nucleosides 2-dG and G, it was required the addition of 5 μL of 10M NaOH to 1mL of stock solution to achieve adequate solubility. Calibration curves were generated from standards of dGTP, GTP, 2-dG, and G ranging from 5 pmoles to 4 nmoles. Elution of the guanosine-containing analytes was monitored in the 700, 785, and 850 mV channels and their injected amounts were graphed relative to the sum of peak areas. Oxo8dGTP, oxo8GTP, oxo8dG, and oxo8G calibration curves were created from concentrations ranging from 5 to 50 pmoles. These oxidized guanosine analytes were monitored in the 250 mV channel and their injected amounts were graphed relative to peak area of the corresponding peak. Dephosphorylated calibration standards were treated similarly with the addition of the dephosphorylation steps outlined in 2.4.
2.7 Oxidation of GTP in vitro
All reagents for in vitro oxidations were reconstituted in PBS, pH = 7.4, and kept on ice. Control reactions included 1mM GTP and 1mM L-ascorbic acid and oxidation reactions contained 1 mM GTP, 1mM L-ascorbic acid, and 10μM cupric sulfate in a final volume of 100 μL. All samples were incubated for 4 hours at 37°C.
2.8 DNA isolation
DNA was extracted from confluent flasks of HEK 293T cells, with minor modifications, according to a method previously described [23]. Briefly, confluent flasks of control populations were treated with unmodified cell culture media described above (see 2.5). Oxidized populations were exposed to a final concentration of 10 μM cupric sulfate and 1 mM L-ascorbic acid prepared in cell culture media and incubated for 4 hours at 37°C. After washing three times with ice-cold phosphate-buffered saline (PBS), cells were harvested with the addition of 3 mL of 1X trypsin-EDTA and pelleted by centrifugation at 2,000 × g, 4°C. Pellets were resuspended in 1mL of DNA extraction buffer containing 0.1 M Trizma-base, 0.1 M NaCl, and 20 mM EDTA, and lysed by sonication using a Vir Sonic Ultrasonic Cell Disruptor 100 (Virtis Company, Gardiner, NY). Following sonication, 300 μL of DNA extraction buffer containing 33 U of DNase free RNase T1 (EC 3.1.27.3) and 200 μg of RNase A (EC 3.1.27.5) and incubated at 37°C for 1 hour. After mixing and brief centrifugation at 1,500 × g for 5 minutes, 300 μL of DNA extraction buffer containing 300 μg of Proteinase K (EC 3.4.21.64) and 1% SDS was added to each sample. Following incubation at 37 °C for 1 hour, the protein fraction was separated from the DNA by three consecutive organic extractions as follows: 700 μL of phenol (stored at −20 °C saturated in buffer) was added to the mixture and after homogenization and centrifugation the aqueous phase was transferred to 1.5 ml microcentrifuge tubes containing Light Phase Lock Gel (Brinkmann Instruments, Inc., Westbury, NY). The samples were then extracted with phenol:chloroform:isoamyl alcohol (25:24:1), and chloroform:isoamyl alcohol (24:1). The DNA was precipitated from the aqueous phase with two volumes of ice-cold ethanol (with respect to aqueous volume) and stored overnight at −20 °C.
Extracted DNA was prepared for the HPLC analysis by resolving it into deoxynucleoside components. The DNA was denatured by digestion at 90 °C for 2 minutes in 100 μL of 20 mM sodium acetate (pH 5.0) then incubating at 37 °C for 1 hr with 10 U of nuclease P1 (EC 3.1.30.1) (dissolved in 20 mM sodium acetate). Each sample was then treated with 10 U of alkaline phosphatase (dissolved in Tris-HCl pH 8.0) and incubated at 37 °C for 1 hour. The reaction was stopped by addition of 20 μL of 3 M sodium acetate (pH 5.0), then filtered using Ultrafree-MC (30-kD) tubes and lyophilized. Samples were stored at −80°C and reconstituted in 50 μL of mobile phase before HPLC-EC analysis. Injection volumes for HPLC-EC analysis contained 10 μL of sample.
2.9 Statistical Analysis
All data were analyzed using Prism GraphPad 4.0 software (Graph pad Software Inc., San Diego, CA). Calibration curve parameters for each of the analytes were obtained by linear regression analysis. An unpaired t-test was performed on data from MPA and oxidation experiments; values denoted with an asterisk are significantly different from their corresponding controls (P < 0.05).
3. Results
3.1 Detection of guanosine and oxidized guanosine moieties
Our chromatographic conditions allowed for the separation of guanosine (dGTP, GTP, 2-dG, and G) and oxidized guanosine moieties (oxo8dGTP, oxo8dG, oxo8GTP, and oxo8G) of interest. Figure 1A and 1B were obtained by injection of a single standard containing the six guanosine compounds shown (GTP, dGTP, G, 2-dG, Oxo8G, Oxo8dG). Figure 1C was obtained by injection of standards containing known quantities of oxo8dGTP and oxo8GTP. Although the retention times for oxo8dGTP and oxo8GTP overlap with those of dGTP and GTP, selectivity for their analysis is gained by detection at different oxidation potentials. Both compounds, especially oxo8dGTP, do not seem to coelute with any other. Elution of the guanosine triphosphates is monitored in the 700, 785, and 850 mV channels (Figure 1A), while elution of the oxidized forms is monitored and maximum in the 250 mV channel (Figure 1C). However, when using extracts from biological samples for HPLC-EC analysis, the difference in chemical composition between the mobile phase and biological milieu generates a broad solvent front in the first four minutes of the analysis. This solvent front peak overlaps the elution of peaks generated from the guanosine triphosphates and impossibilities their analysis. Given the good resolution for the analysis of 2-dG and G (Figure 1A) and for oxo8dG and oxo8G (Figure 1B) combined with their low levels in biological systems, we opted to analyze the triphosphates after an additional sample preparation step to dephosphorylate these analytes before injecting them into the HPLC-EC.
Figure 1.
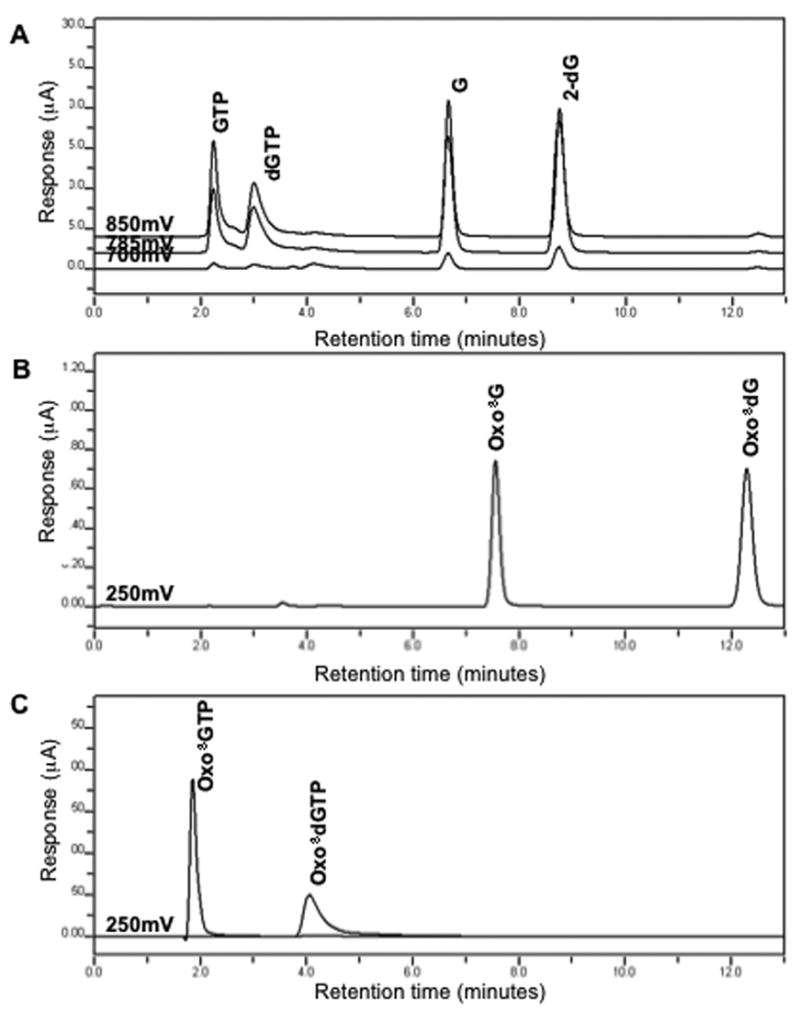
Chromatographic profiles for a standard containing GTP, dGTP, G, and 2-dG (A) detected in channels set at 700, 785, and 850 mV, a standard containing oxo8G and oxo8dG detected with a channel set at 250 mV (B), and standards of oxo8GTP and oxo8dGTP detected at 250 mV (C).
3.2 Validation of preparative sample dephosphorylation
To test whether the dephosphorylation step would interfere with the electrochemical analysis of the analytes, we built calibration curves for each of the triphosphates moieties after dephosphorylation and compared their response to injections of equivalent amounts of standards of their respective guanosine nucleoside (Figure 2). Figure 2A compares the response to 2-dG generated from dephosphorylation of dGTP to the response of a prepared 2-dG standard. Figures 2B, 2C, and 2D were constructed similarly to allow for the same comparison for G, oxo8dG, and oxo8G respectively. The calibration curves for the dephosphorylated oxidized guanosine triphosphates and oxidized guanosine nucleosides were built based on a picomolar scale and those for the unmodified guanosine compounds were built based on a nanomolar scale. This is due to the observation that the concentration of oxidized guanosine nucleotide triphosphates (oxo8GTP and oxo8dGTP) and oxidized guanosine nucleosides (oxo8G and oxo8dG) might be several orders of magnitude smaller than their corresponding unmodified guanosine compounds (dGTP, GTP, G, 2-dG) in biologically relevant systems.
Figure 2.

Solid lines are calibration curves built with known amounts of 2-dG(A), G (B), oxo8dG (C), and oxo8G (D). Dashed lines are calibration curves built with equivalent amounts of standards containing dGTP (A), GTP (B), oxo8dGTP (C), and oxo8GTP (D) after alkaline phosphatase treatment. (n = 2).
Table 1 outlines the specific calibration components of each of the dephosphorylated guanosine triphosphates as well as the guanosine nucleoside standards. Each of the calibration curves yielded a coefficient of determination (r2) greater than 0.9 and an average percent recovery of 95% or greater. The values for the slope and intercept for the dephosphorylated guanosine nucleotide triphosphates as compared their corresponding standard guanosine nucleoside were not significantly different.
Table 1.
Comparison of calibration curve components of guanosine nucleosides and deposhorylated guanosine nucleotides
| Dephosphorylated
|
||||||||
|---|---|---|---|---|---|---|---|---|
| Component | G | Oxo8G | 2-dG | Oxo8dG | GTP | Oxo8GTP | dGTP | Oxo8dGTP |
| Slope | 0.3281 | 0.08951 | 0.2224 | 0.07660 | 0.2987 | 0.08418 | 0.1185 | 0.07047 |
| Y-intercept | 0.02874 | −0.01398 | −0.06004 | 0.2302 | 0.03513 | 0.2534 | −0.04541 | 0.1106 |
| r2 | 0.9998 | 0.9997 | 0.9912 | 0.9978 | 1.000 | 0.9729 | 0.9922 | 0.9996 |
| Average % Recovery | 99.49 | 100.05 | 103.68 | 97.17 | 100.04 | 89.63 | 103.72 | 99.57 |
It can be therefore concluded that the dephosphorylation of the guanosine and oxidized guanosine triphosphates is complete under these reaction conditions, and that the levels of the resulting nucleoside are equivalent to the levels of the parent nucleotide triphosphate. The limit of detection (LOD) for each nucleoside was determined as the amount giving a signal-to-noise (S/N) ratio of 3:1. The LOD for each compound were 126.83 (G), 167.91 (dG), 40.24 (oxo8G), and 47.11 (oxo8dG) fmole, respectively. The limit of quantification (LOQ) for each nucleoside was determined as the amount giving a S/N ratio of 10:1. The LOQ for each compound were 422.80 (G), 559.70 (dG), 134.10 (oxo8G), and 157.0 (oxo8dG) fmole, respectively. These detection limits are one to two orders of magnitude lower than the levels of G, dG, oxo8G, and oxo8dG measured in biological samples using this methodology (see Sections 3.3 and 3.4).
3.3 Detection of guanosine and oxidized guanosine moieties in HEK 293T cells
To test whether the same dephosphorylation process could be applied to the analysis of nucleotide triphosphates in biological samples, we used HEK 293T cells with and without the addition of mycophenolic acid (MPA). MPA is a non-nucleoside, non-competitive, reversible inhibitor of inosine monophosphate dehydrogenase (IMPDH) (EC 1.1.1.205) [24]. IMPDH is responsible for catalyzing the rate-limiting step in the de novo biosynthesis of guanosine monophosphate (GMP) which is further converted into guanosine diphosphate (GDP) and GTP. Previous studies have shown that concentrations of MPA ranging from 0.2 to 2 μM reduce the levels of GTP in vitro as much as eighty percent without affecting cell viability [22,25]. Figure 3A and 3B are representative chromatograms of dephosphorylated cytosolic extracts from control and MPA-treated HEK 293T cells. Addition of 2 μM MPA for one hour significantly reduced GTP levels by 70% (Fig. 3A and 3C) without affecting the concentration of dGTP (Fig. 3D) or cell viability. Oxo8GTP was also significantly reduced by 70% in these same MPA-exposed colonies (Fig. 3E). Oxo8dGTP was undetectable in control and MPA-exposed samples.
Figure 3.
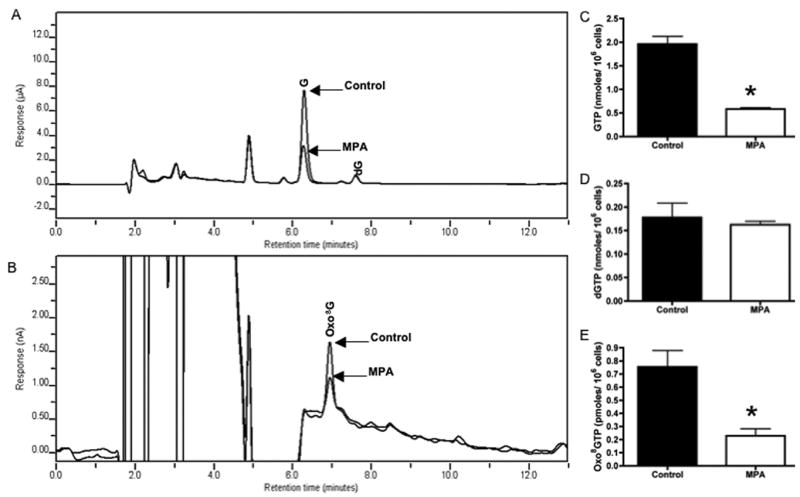
Typical chromatograhic profiles of cytosolic cellular extracts, after treatment with alkaline phosphatase, obtained from HEK 293T cells in control or MPA-exposed populations (2μM, 1 hour). Typical retention times for G and 2-dG generated are presented in 3A, and that for oxo8G in 3Bm (chromatograms reflect a 3D shift for display purposes). Although channels 700, 785, and 850 mV were used for quantitation of GTP and dGTP, only channel 785 mV shown in figure. Bar graphs show cellular levels of GTP (C), dGTP (D), and oxo8GTP (E) in control (black bar) and MPA treated (white bar) cells. Values expressed as nanomoles (dGTP and GTP) or picomoles (oxo8GTP) per 106 cells. Data expressed as the mean ± SEM (n =3–4, * p < 0.05).
Basal levels of 2-dG, G, oxo8dG, and oxo8G were undetectable in control cell populations that did not undergo the preparative dephosphorylation step (data not shown). Therefore, endogenous concentrations of these free guanosine (2-dG and G) and oxidized guanosine nucleosides (oxo8dG and oxo8G) in the cellular pool do not confound direct detection and analysis of the dephosphorylated guanosine triphosphate. Thus, we conclude that determination of these nucleosides is a valid approach to determine levels of the original nucleotide triphosphate.
3.4 Oxidation of guanosine triphosphates in vitro and in HEK 293T cells
To assess the impact of oxidative damage in the guanosine triphosphates cellular pools, initially we exposed GTP to a known ROS producing system (1mM L-ascorbic acid and 10 μM cupric sulfate). Figure 4A and 4B are representative chromatograms of the analysis of GTP, after alkaline phosphatase treatment, under control and oxidizing conditions. Production of OH• in mixtures of Cu2+ and ascorbate has been previously demonstrated, and therefore OH• is likely the ROS responsible for producing oxo8GTP via the same attack mechanism that produces oxo8dG in DNA [26]. The average percent recovery of GTP incubated in PBS for 4 hours was 101% using this sample processing and HPLC-EC method which shows that no GTP is lost due to decomposition or due to the reaction conditions. Under oxidizing conditions, approximately four times more oxo8GTP was formed as compared to control reactions that were incubated with L-ascorbic acid alone (Fig. 4D). Pre-treatment of reagents with the Chelex 100 resin (sodium form) to remove any trace metals did not affect oxo8GTP levels under control conditions. Oxo8GTP was undetectable in untreated GTP reactions (data not shown). GTP also showed a small, although significant decrease in concentration after incubation under oxidizing conditions due to its direct oxidation (Fig. 4C).
Figure 4.

Chromatograhic profiles of dephosphorylated GTP (A) and oxo8GTP (B) after GTP exposure to control (1mM L-ascorbic acid) or oxidizing conditions (1mM L-ascorbic acid and 10μM cupric sulfate). Bar graph shows nanomoles of GTP (C) and picomoles oxo8GTP (D) in GTP samples exposed to control (black bar) or oxidizing conditions (white bar). Data expressed as the mean ± SEM (n =6–9, * p < 0.05).
To determine if the same oxidation conditions can induce oxo8GTP in a cell culture system, we exposed HEK 293T cells to similar conditions as the ones described above (1 mM L-ascorbic acid, 10 μM cupric sulfate). Figure 5A and 5B are representative chromatograms of alkaline treated cytosolic extracts from HEK 293T cells under control and oxidizing conditions. Oxo8GTP extracted from HEK 293T cells exposed to L-ascorbic acid and cupric sulfate were six times higher than control populations exposed to L-ascorbic acid alone (Fig. 5E). Exposure to L-ascorbic acid alone (control) decreased oxo8GTP levels as compared to untreated cells (data not shown). GTP concentrations in oxidized populations were apparently decreased from controls although the difference was not significant (Fig. 5C). This is likely due to the normal increase in the variability of data obtained from cell cultures as compared to purified reagents. dGTP levels were unaffected in all groups (Fig. 5D) and oxo8dGTP was undetectable in all groups.
Figure 5.
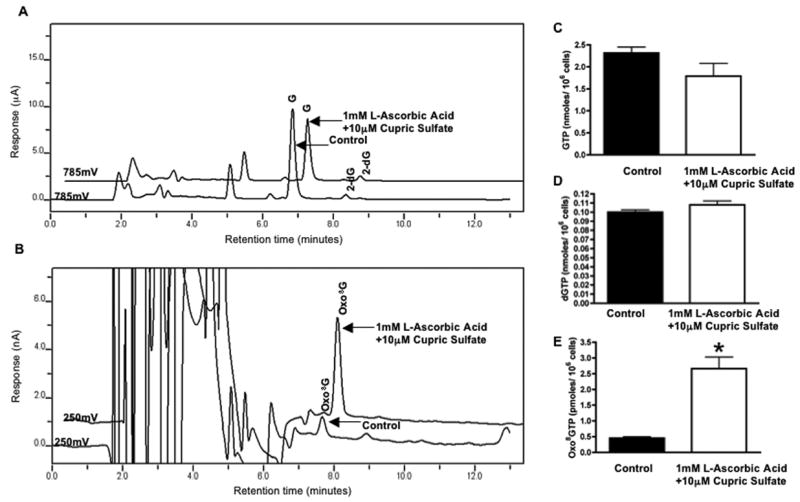
Chromatograhic profiles of alkaline phosphatase treated cytosolic cellular extracts obtained from HEK 293T cells in control (1mM L-ascorbic acid) or oxidizing (1mM L-ascorbic acid, 10 μM cupric sulfate) conditions. Typical elution profiles for the generated G and 2-dG (A) and typical elution profile for the oxo8G generated (B). Bar graphs represent cellular levels of GTP (C), dGTP (D), and oxo8GTP (E) in control (black bar and treated cell populations (white bar). Data expressed as levels per 106 cells. Data expressed as the mean ± SEM (n =3, * p < 0.05).
3.5 Oxidation to guanosine moiety in nuclear DNA of HEK 293T cells
To test whether similar free radical conditions had an effect in the levels of oxidized guanosine in DNA, we measured oxo8dG level in DNA from HEK 293T cells that were exposed to L-ascorbic acid and cupric sulfate. Figure 6 demonstrates that nuclear DNA extracted from HEK 293T cells treated under the same oxidation conditions did not show an increase in oxidation to the guanosine moiety. This suggests the nucleotide pool, specifically GTP, is the primary target for oxidation after exposure to mild oxidizing conditions.
Figure 6.
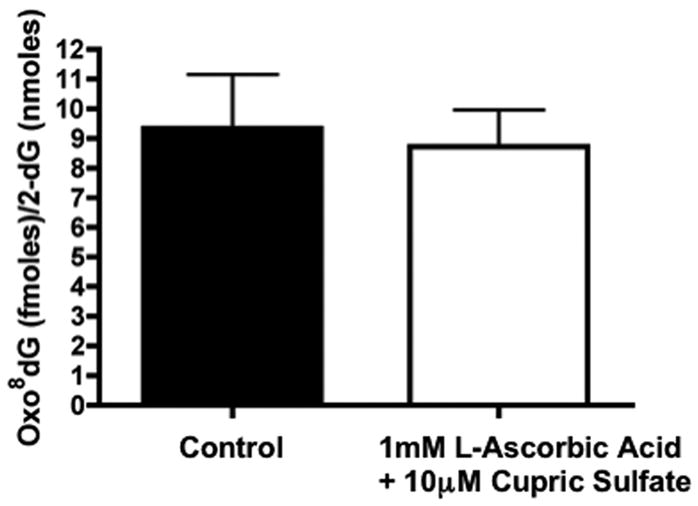
Levels of oxo8dG, as compared to the levels of 2-dG, in DNA isolated from HEK 293T cells exposed to 1mM L-ascorbic acid (control, black bar) or 1mM L-ascorbic acid, 10 μM cupric sulfate (oxidizing conditions, white bar). Data expressed femtomoles of oxo8dG per nanomoles of 2-dG in DNA. Bars represent mean ± SEM (n =4).
4. Discussion
The GTP pool has not been adequately investigated as a target and therefore as a biomarker of oxidative stress. Until now, this paucity of information is in part due to the lack of a reliable methodology to assess oxidized guanosine moieties in the nucleotide pool. The present method for simultaneous detection of dGTP, GTP, oxo8dGTP, and oxo8GTP is the first report of a sensitive, reliable methodology for the direct determination of these guanosine triphosphates in cells. In addition, this method allows for the detection of the impact of ROS to cellular guanosine under conditions that do not evidence oxidation to DNA. Reports of oxidative damage to DNA in disease and after toxicological challenge have relied on assessments using antibodies against oxo8dG [27–30]. However, these antibodies are notorious for showing cross-reactivity with oxo8G, G, and 2-dG [27,30]. Immunohistochemical studies using antibodies for oxo8dG have also displayed high background reactivity in both the nucleus and cytosol in various cell types. This demonstrates unreliable discrimination between oxidized moieties in DNA and in the free guanosine nucleoside or guanosine nucleotide triphosphate forms [29,31].
Determination of nucleotide concentrations has been investigated by several methodologies including gas chromatography (GC), bioluminescence, nuclear magnetic resonance spectroscopy (NMR), and high-performance liquid chromatography (HPLC) [32]. It has been generally established that the quantification of nucleoside and deoxynucleoside triphosphates is most reliably assessed via ion-pair HPLC with UV detection [33]. However, HPLC with electrochemical detection (EC) is the most sensitive and reliable way of quantifying oxo8dG [23]. The chemical properties of guanosine and oxidized guanosine in their triphosphate forms make reverse-phase HPLC- EC incapable of accurately detecting these analytes from biological samples. Incorporation of a preparative dephosphorylation step to overcome difficulties in detecting analytes eluting in solvent front phase of the chromatogram ensured the ability to measure dGTP, GTP, oxo8dGTP, and oxo8GTP in cell extracts in a single run. Although basal oxo8dGTP concentrations in biological samples were below the detection limit, sensitivity to this analyte was shown in Figure 1C. Free 2-dG, G, oxo8dG, or oxo8G were undetected in cell extracts that did not undergo the preparative dephosphorylation step, thus they do not interfere with measurements of their triphosphate forms via alkaline phosphatase dephosphorylation. Alkaline phosphatase cleaves the 5′ phosphates in ribo and deoxyribonucleotide triphosphates with no activity on nucleotide diphosphates and little activity on nucleotide monophosphates [34]. Given the substrate specificity of alkaline phosphatase for nucleotide triphophates and the inability of HPLC methods with similar extraction techniques to detect GDP or GMP, inflation of G levels using the presented method by interference of GDP or GMP is unlikely [35]. The reduction of GTP and oxo8GTP by MPA, a specific inhibitor of de novo GTP synthesis in vivo, provided further validation of the sample preparation and HPLC-EC conditions presented.
The concentration of GTP in HEK 293T cells was found to be approximately tenfold higher than the concentration of dGTP. These results corroborate earlier studies in various normal and tumor cell lines (see Fig. 3) [33]. The GTP pool also proved to exhibit higher basal levels of oxidation as compared to the dGTP pool which was undetectable under normal growth media conditions (see Fig. 3). The higher basal levels of oxo8GTP, as compared to oxo8dGTP, can be explained by the presence of a specific cellular repair mechanism for the removal of oxo8dGTP from the deoxynucleotide pool. The MTH1 (EC 3.1.6.-) protein is responsible for hydrolyzing oxo8dGTP to oxo8dGMP and thus preventing its incorporation into DNA [36]. Although MTH1 also acts on oxo8GTP, it has been shown that the rate of cleavage of oxo8GTP by MTH1 is 50 times lower than that of oxo8dGTP [37]. No specific repair or removal mechanism for oxo8GTP has been identified to compensate for this inefficiency of MTH1. This fact also can help explain why the levels of oxo8GTP in HEK 293T cells exposed to oxidizing conditions represented an approximately 6-fold increase from control with no observable increase in oxo8dGTP (see Fig. 5). Interestingly, this increase in oxo8GTP levels is approximately twice the magnitude of increase seen in oxo8GTP from direct oxidation of GTP (see Fig. 4). Previous studies investigating 1mM ascorbate as a free radical scavenger in solutions of purified 2-dG and calf thymus DNA exposed to radiation have also demonstrated discrepancies in the degree of oxidation to the guanosine moiety [38]. Although these particular experiments suggested free 2-dG was more susceptible to oxidation as compared to 2-dG incorporated into DNA, they support the fact that oxidation of the guanine base is highly dependent on the moiety it is contained within the cell (free nucleoside, DNA, nucleotide triphosphate, etc.).
Oxidation of the guanosine moiety in DNA is one of the most widely reported biomarkers of oxidative stress due to its implications in mutagenesis as well as ease and reliability of assessment methods. However, the percent of oxidized guanosine relative to unmodified guanosine in DNA in tissues from pathologies such as Alzheimer’s Disease and Parkinson’s Disease ranges between 0.002 and 1%. The percent of oxo8GTP relative to GTP in HEK 293T cells exposed to mild oxidizing conditions used in this study was 0.15%. This is at the upper end of this range for oxo8dG/2-dG seen in neurodegenerative diseases and an order of magnitude higher than the average percent of oxo8dG relative to 2-dG found in the DNA isolated from the blood of patients with diabetes mellitus [20]. Oxo8dG measured in naked DNA under similar copper and ascorbate oxidation conditions, 500 μM and 50 μM respectively, reflects only a 0.1% oxidation of the total 2-dG [39]. Our in vitro oxidations of GTP demonstrated that 6.6% of the guanosine moiety in its nucleotide triphosphate form was oxidized to oxo8GTP. This is over 60 times more oxidation to the GTP pool as compared to DNA treated under more severe oxidative conditions [39]. The magnitude of oxidation we observe both in vitro and in cell culture in the GTP pool under mild oxidative conditions that do not produce any measurable increase in oxidation to guanosine in DNA evidences the importance of evaluating this guanosine pool as an previously overlooked, important marker of oxidative stress.
In conclusion, dephosphorylation of dGTP and GTP and their oxidized counterparts via alkaline phosphatase coupled to HPLC-EC analysis has proven to be a valid method for the detection and analysis of oxidative modification to the guanosine triphosphate pool. This methodology can extended to studies evaluating biomarkers of oxidative stress and their pathophysiological role in cancer, neurological disease, and toxicological insult.
Acknowledgments
This work was supported by NIA grant 1R15AG023604-01 to FCP, A.F.P.E. fellowship to CB and by NIH P20 RR15583-07 and NIH P20RRP20RR017670-04.
Footnotes
Publisher's Disclaimer: This is a PDF file of an unedited manuscript that has been accepted for publication. As a service to our customers we are providing this early version of the manuscript. The manuscript will undergo copyediting, typesetting, and review of the resulting proof before it is published in its final citable form. Please note that during the production process errors may be discovered which could affect the content, and all legal disclaimers that apply to the journal pertain.
References
- 1.Sies H. Klin Wochenschr. 1991;69:965. doi: 10.1007/BF01645140. [DOI] [PMC free article] [PubMed] [Google Scholar]
- 2.Halliwell B, Gutteridge JM. Arch Biochem Biophys. 1986;246:501. doi: 10.1016/0003-9861(86)90305-x. [DOI] [PubMed] [Google Scholar]
- 3.Alam ZI, Jenner A, Daniel SE, Lees AJ, Cairns N, Marsden CD, Jenner P, Halliwell B. J Neurochem. 1997;69:1196. doi: 10.1046/j.1471-4159.1997.69031196.x. [DOI] [PubMed] [Google Scholar]
- 4.Sanchez-Ramos J, Eva Overvik, B Ames. Neurodegeneration. 1994;3:197. [Google Scholar]
- 5.Hollstein M, Sidransky D, Vogelstein B, Harris CC. Science. 1991;253:49. doi: 10.1126/science.1905840. [DOI] [PubMed] [Google Scholar]
- 6.Beal MF. Ann N Y Acad Sci. 2003;991:120. doi: 10.1111/j.1749-6632.2003.tb07470.x. [DOI] [PubMed] [Google Scholar]
- 7.Devasagayam TP, Steenken S, Obendorf MS, Schulz WA, Sies H. Biochemistry. 1991;30:6283. doi: 10.1021/bi00239a029. [DOI] [PubMed] [Google Scholar]
- 8.Milligan JR, Aguilera JA, Nguyen JV, Ward JF. Int J Radiat Biol. 2001;77:281. doi: 10.1080/09553000010013436. [DOI] [PubMed] [Google Scholar]
- 9.Steenken S. Biol Chem. 1997;378:1293. [PubMed] [Google Scholar]
- 10.Chiou CC, Chang PY, Chan EC, Wu TL, Tsao KC, Wu JT. Clin Chim Acta. 2003;334:87. doi: 10.1016/s0009-8981(03)00191-8. [DOI] [PubMed] [Google Scholar]
- 11.Dizdaroglu M, Jaruga P, Birincioglu M, Rodriguez H. Free Radic Biol Med. 2002;32:1102. doi: 10.1016/s0891-5849(02)00826-2. [DOI] [PubMed] [Google Scholar]
- 12.Proteggente AR, England TG, Rehman A, Rice-Evans CA, Halliwell B. Free Radic Res. 2002;36:157. doi: 10.1080/10715760290006475. [DOI] [PubMed] [Google Scholar]
- 13.Wang J, Xiong S, Xie C, Markesbery WR, Lovell MA. J Neurochem. 2005;93:953. doi: 10.1111/j.1471-4159.2005.03053.x. [DOI] [PubMed] [Google Scholar]
- 14.Kasai H, Nishimura S. Nucleic Acids Symp Ser. 1983:165. [PubMed] [Google Scholar]
- 15.Buettner GR. Arch Biochem Biophys. 1993;300:535. doi: 10.1006/abbi.1993.1074. [DOI] [PubMed] [Google Scholar]
- 16.Cheng KC, Cahill DS, Kasai H, Nishimura S, Loeb LA. J Biol Chem. 1992;267:166. [PubMed] [Google Scholar]
- 17.Hayakawa H, Taketomi A, Sakumi K, Kuwano M, Sekiguchi M. Biochemistry. 1995;34:89. doi: 10.1021/bi00001a011. [DOI] [PubMed] [Google Scholar]
- 18.Kornberg A, Baker TA. DNA replication. W.H. Freeman and Co; New York: 1992. [Google Scholar]
- 19.Haghdoost S, Czene S, Naslund I, Skog S, Harms-Ringdahl M. Free Radic Res. 2005;39:153. doi: 10.1080/10715760500043132. [DOI] [PubMed] [Google Scholar]
- 20.Dandona P, Thusu K, Cook S, Snyder B, Makowski J, Armstrong D, Nicotera T. Lancet. 1996;347:444. doi: 10.1016/s0140-6736(96)90013-6. [DOI] [PubMed] [Google Scholar]
- 21.Cohen MB, Maybaum J, Sadee W. J Biol Chem. 1981;256:8713. [PubMed] [Google Scholar]
- 22.Gu JJ, Gathy K, Santiago L, Chen E, Huang M, Graves LM, Mitchell BS. Blood. 2003;101:4958. doi: 10.1182/blood-2002-08-2547. [DOI] [PubMed] [Google Scholar]
- 23.Bolin C, Stedeford T, Cardozo-Pelaez F. J Neurosci Methods. 2004;136:69. doi: 10.1016/j.jneumeth.2003.12.025. [DOI] [PubMed] [Google Scholar]
- 24.Allison AC, Eugui EM. Immunopharmacology. 2000;47:85. doi: 10.1016/s0162-3109(00)00188-0. [DOI] [PubMed] [Google Scholar]
- 25.Daxecker H, Raab M, Cichna M, Markl P, Muller MM. Clin Chim Acta. 2001;310:81. doi: 10.1016/s0009-8981(01)00526-5. [DOI] [PubMed] [Google Scholar]
- 26.Biaglow JE, Held KD, Manevich Y, Tuttle S, Kachur A, Uckun F. Radiat Res. 1996;145:554. [PubMed] [Google Scholar]
- 27.Degan P, Shigenaga MK, Park EM, Alperin PE, Ames BN. Carcinogenesis. 1991;12:865. doi: 10.1093/carcin/12.5.865. [DOI] [PubMed] [Google Scholar]
- 28.Kikuchi A, Takeda A, Onodera H, Kimpara T, Hisanaga K, Sato N, Nunomura A, Castellani RJ, Perry G, Smith MA, Itoyama Y. Neurobiol Dis. 2002;9:244. doi: 10.1006/nbdi.2002.0466. [DOI] [PubMed] [Google Scholar]
- 29.Toyokuni S, Tanaka T, Hattori Y, Nishiyama Y, Yoshida A, Uchida K, Hiai H, Ochi H, Osawa T. Lab Invest. 1997;76:365. [PubMed] [Google Scholar]
- 30.Yin B, Whyatt RM, Perera FP, Randall MC, Cooper TB, Santella RM. Free Radic Biol Med. 1995;18:1023. doi: 10.1016/0891-5849(95)00003-g. [DOI] [PubMed] [Google Scholar]
- 31.Kikuchi H, Furuta A, Nishioka K, Suzuki SO, Nakabeppu Y, Iwaki T. Acta Neuropathol (Berl) 2002;103:408. doi: 10.1007/s00401-001-0480-x. [DOI] [PubMed] [Google Scholar]
- 32.Werner A. J Chromatogr. 1993;618:3. doi: 10.1016/0378-4347(93)80024-x. [DOI] [PubMed] [Google Scholar]
- 33.Huang D, Zhang Y, Chen X. J Chromatogr B Analyt Technol Biomed Life Sci. 2003;784:101. doi: 10.1016/s1570-0232(02)00780-8. [DOI] [PubMed] [Google Scholar]
- 34.Humphreys MH, Kaysen GA, Chou LY, Watson JB. Am J Physiol. 1980;238:G3. doi: 10.1152/ajpgi.1980.238.1.G3. [DOI] [PubMed] [Google Scholar]
- 35.Metz SA, Rabaglia ME, Pintar TJ. J Biol Chem. 1992;267:12517. [PubMed] [Google Scholar]
- 36.Mo JY, Maki H, Sekiguchi M. Proc Natl Acad Sci U S A. 1992;89:11021. doi: 10.1073/pnas.89.22.11021. [DOI] [PMC free article] [PubMed] [Google Scholar]
- 37.Hayakawa H, Hofer A, Thelander L, Kitajima S, Cai Y, Oshiro S, Yakushiji H, Nakabeppu Y, Kuwano M, Sekiguchi M. Biochemistry. 1999;38:3610. doi: 10.1021/bi982361l. [DOI] [PubMed] [Google Scholar]
- 38.Svoboda P, Harms-Ringdahl M. Radiat Res. 1999;151:605. [PubMed] [Google Scholar]
- 39.Spear N, Aust SD. Arch Biochem Biophys. 1995;317:142. doi: 10.1006/abbi.1995.1146. [DOI] [PubMed] [Google Scholar]