Abstract
To elucidate the organization of the serotoninergic innervation within the orbitofrontal cortex (OFC), serotonin transporter (SERT) density was quantified by autoradiography using [3H]cyanoimipramine binding. In six adult vervet monkeys, 15 architectonic areas were delineated according to cytoarchitectonic (Nissl), myeloarchitectonic (Gallyas) and chemoarchitectonic (Acetylcholinesterase) criteria to assess SERT distribution at two levels of organization: cortical area and cortical type. For cortical type, the 15 areas were evenly divided into three different categories primarily based upon the degree of granularization of layer IV: agranular, dysgranular, and granular. Within agranular and dysgranular, but not granular cortical types, SERT density was area-specific and progressively decreased in a medial to lateral gradient. Across cortical types, SERT density decreased in a caudal to rostral gradient: agranular > dysgranular > granular. A similar caudal to rostral gradient was seen when serotonin content was measured (using HPLC) in areas representative of each cortical type. Collectively, these results suggest that the serotoninergic innervation is organized according to both cortical type and area, and is thus structured to differentially modulate information processing within the OFC.
Keywords: Anatomy, Cytoarchitecture, Serotonergic, Ventromedial Prefrontal Cortex
INTRODUCTION
The orbitofrontal cortex (OFC) forms the ventral surface of the prefrontal cortex (PFC) and extends from the frontal pole to the insula. This architecturally heterogeneous expanse of cortex is functionally involved in several types of processes including olfaction, emotion regulation, social propriety, and stimulus-reinforcer learning (Zald and Kim, 1996, Kringelbach and Rolls, 2004). Clinically, functional and structural alterations of the orbital surface have been identified in several psychiatric states including obsessive-compulsive disorder (Whiteside et al., 2004, Friedlander and Desrocher, 2006) and disorders of impulse control (Brower and Price, 2001, Raine and Yang, 2006).
Among the many neurochemical influences impacting OFC function, recent studies have highlighted a significant modulatory role for the serotonin system. For example, in human FDG-PET imaging studies, the OFC is the principal region associated with therapeutic response to serotonin transporter inhibition in both obsessive-compulsive and impulsive-aggressive disorders (Saxena et al., 1999, New et al., 2004). In the monkey, serotonin also influences orbitofrontal processing, as lesioning of the OFC serotoninergic innervation impaired performance on OFC-dependent cognitive tasks (Clarke et al., 2006).
These regionally selective functional effects of serotonin may be related to the anatomical distribution of the serotoninergic innervation. Yet, prior work has not clearly established the organization of this innervation. Generally, the OFC is considered to have a uniform density of innervation (Lewis et al., 1986, Fuster, 1997, Cavada et al., 2000, Robbins, 2000) based upon non-human primate studies using either autoradiographic assessment of SERT binding (Lidow et al., 1989) or serotonin immunohistochemistry (Lewis, 1990). However, with serotonin content as the innervation marker, Costa and Aprison (1958) showed relatively higher levels in the caudal than the rostral OFC, which suggests regionally-specific innervation density. These apparently inconsistent conclusions underscore the need for a comprehensive examination of serotoninergic innervation markers throughout the entirety of the OFC.
Accordingly, for this study the density of SERT, a marker of serotoninergic innervation, was quantified throughout the vervet monkey OFC using the SERT selective ligand [3H]cyanoimipramine ([3H]CNI; (Hyttel and Larsen, 1985, Kovachich et al., 1988, Soucy et al., 1994, Beique et al., 1998). Additionally, to account for attenuation of tritium emissions by myelin (i.e. “tritium quench” (Herkenham and Sokoloff, 1984)), the calculated [3H]CNI concentrations in analyzed areas were corrected for the effects of lipid content.
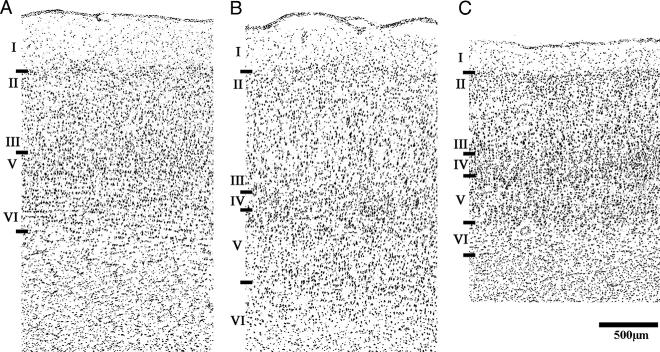
To identify the distribution of the SERT, the OFC was parcellated according to two anatomical frameworks: cortical type and cortical area. These delineations are derived from the heterogeneous architectural features of the OFC. Principal among these are differences in the magnitude of the internal granule cell layer (layer IV), which divides the OFC into three cortical types: agranular, dysgranular, and granular (Figure 1). In the caudal OFC, the absence of a granule layer defines this cortex as agranular, which is often termed periallocortex or limbic cortex (Morecraft et al., 1992). Advancing rostrally along the orbital surface, there is a progressive increase in granularity within layer IV, yielding a dysgranular zone with an incipient internal granule cell layer, and finally, a rostral granular zone with a well-developed internal granule cell layer (Figure 2). This tripartite division of the OFC is widely recognized by anatomists and was hypothesized as an organizational framework upon which to characterize regional differences in SERT density.
Figure 1.
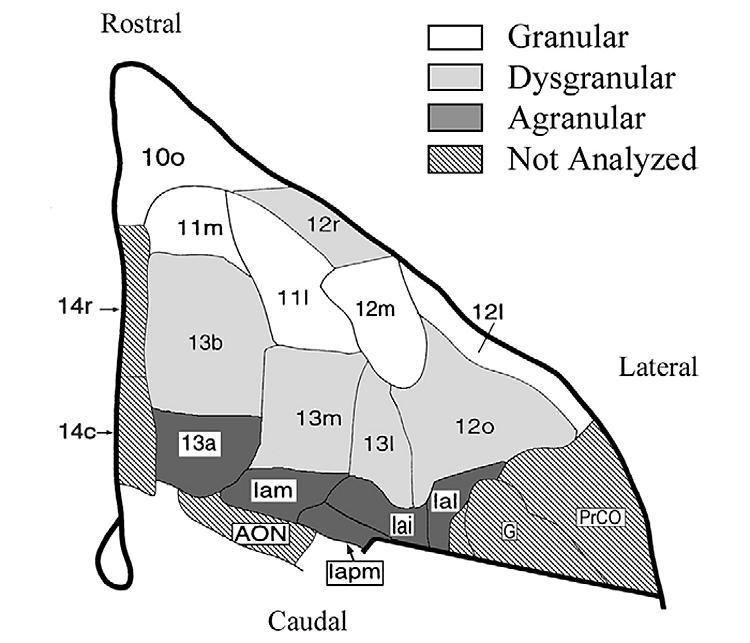
Schematic map of the monkey orbitofrontal cortex with the 15 architectonic areas analyzed in this study (Price et al., 1996), permission pending from Elsevier Science). Shading denotes the cortical type of each area. Iapm, agranular insula posteromedian; Iam, agranular insula medial; Iai, agranular insula intermediate; Ial, agranular insula lateral; AON, anterior olfactory nucleus; PrCO, precentral operculum; G, gustatory cortex.
Figure 2.
Nissl stained sections from cortical areas of the vervet monkey demonstrating structural differences between cortical types: agranular (A), dysgranular (B), and granular (C). From A to C, there is an increase in laminar differentiation as well as a progressive increase in the density of granule cells particularly in layer IV, but also in layer II. In addition to these structural features used to delineate cortical type, each area is also distinguished by unique cytoarchitectural features. The agranular area Iam (A) is characterized by indistinct lamination, particularly with respect to the boundaries between layers III and V as well as V and VI. The dysgranular area 13l (B) has large, darkly staining pyramidal cells in the deep portion of layer III. Additionally, layer V is sublaminated into cell-dense inner and outer laminae that bracket a cell-sparse middle lamina. In the granular area 10o (C), layer V is thinner and the sublamina are less distinct.
Each cortical type can be further subdivided into cortical areas according to additional cytoarchitectonic, myeloarchitectonic and chemoarchitectonic criteria established in anatomical studies of the macaque monkey OFC (Walker, 1940, Barbas and Pandya, 1989, Preuss and Goldman-Rakic, 1991, Morecraft et al., 1992, Carmichael and Price, 1994, Petrides and Pandya, 2002). For this study, the parcellation framework of Carmichael and Price (1994) was adopted because it contained the most anatomically restrictive areal divisions, and thus provides the most stringent criteria for determining potential areal differences in SERT density. Based on the high degree of anatomical similarity between the macaque and vervet monkey brain (Figure 3), it was hypothesized that the macaque map could be applied to the vervet for the determination of these areal differences in SERT density.
Figure 3.
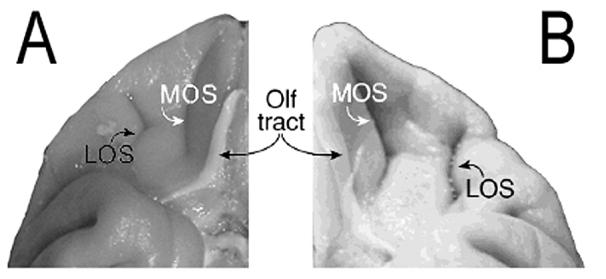
Comparison of ventral surfaces of the orbitofrontal cortex in A) Vervet monkey (Chlorocebus aethiops) and B) Rhesus monkey (Macaca mulatta; (Chiavaras and Petrides, 2000), permission pending from Academic Press). MOS, medial orbital sulcus; LOS, lateral orbital sulcus; Olf tract, olfactory tract.
Since cortical type and cortical area are delineations associated with differential cerebral connectivity, organization of the SERT distribution, and by inference the serotoninergic innervation, according to either of these divisions would suggest a potential density-dependent mechanism for regulating OFC activity.
Experimental Procedures
Subjects
Subjects in this study were 12 drug-naive adult male vervet monkeys (Chlorocebus aethiops) that were housed in outdoor group enclosures at the UCLA/VA Vervet Research Colony, Sepulveda CA. All procedures in this study were approved by the UCLA Animal Research Committee, and were conducted according to the NIH Guide for the Care and Use of Laboratory Animals.
Chemicals
The radioligands, [3H]cyanoimipramine ([3H]CNI) (American Radiolabeled Chemicals, St Louis, MO) and [3H]succinimidyl propionate ([3H]SP) (Moravek Biochemicals, Brea, CA), were obtained from commercial sources. Citalopram was a generous gift from H. Lundbeck A/S (Copenhagen, DK).
Tissue Preparation
Assessment of serotonin transporter distribution was conducted on the right hemisphere of one cohort of six monkeys (age: 9.5 ± 1.5 yrs), while serotonin content was measured in the left hemisphere of a different cohort of six monkeys (age: 13.5 ± 1 yrs). The contralateral hemispheres were used for other studies. Animals were initially anesthetized with 10 mg/kg ketamine, i.m., followed by euthanasia with pentobarbital, 100 mg/kg, i.v. The brains were rapidly removed and placed in ice-cold saline for 5 min. Subsequently, the brain was coronally sectioned into 0.5 cm blocks (Harvey et al., 2000), followed by bisection of each block. Blocks from the right hemisphere were immersed in M-1 embedding matrix (ThermoShandon, Pittsburgh, PA) and frozen by immersion in 2-methylbutane cooled to −35°C. Frozen blocks were stored at −80°C until cryosectioning.
Tissues from the left frontal cortex were dissected on an ice-cold metal plate and assayed for serotonin content. Using the medial and lateral orbital sulci as reference boundaries, gray matter regions of interest between these landmarks were removed from the three 0.5 cm thick blocks beginning 0.5, 1, and 1.5 cm caudal to the frontal pole, which contained areas 11, 13, and the agranular insula, respectively. As the most caudal section is posterior to the termination of the medial orbital sulcus, the gray matter 0.5 cm medial to the lateral orbital sulcus was removed, thereby avoiding the medially positioned olfactory nuclei which have high 5-HT content. Tissue samples were immediately frozen in liquid nitrogen and stored at -80°C until the time of HPLC analysis.
For autoradiography, fresh-frozen sections (20 μm) were cut on a Leica CM 3050 cryostat at −14°C and thaw-mounted onto acid-washed, gelatin-subbed slides. After drying on a slide warmer at 30°C for 20 min, the slides were vacuum-desiccated for 20 hrs at 4°C and then stored at −80°C until the time of assay.
Histological Staining Procedures
Coronal sections collected at 180 μm intervals in a rostro-caudal direction were stained with one of the three histological stains used for anatomical reference. Thus, two consecutive sections stained by each type of stain were separated by 540μm. For the cell-body (Nissl) and myelin (Gallyas) stains, sections were fixed at room temperature in a 4% paraformaldehyde 0.1M phosphate buffered saline solution with 0.25% glutaraldehyde for 24 hrs (Nissl) or 3 hrs (Gallyas). For the acetylcholinesterase procedure, fixation was for 30 min at 4°C using the same parformaldehyde solution as above, but with 1% glutaraldehyde.
For Nissl staining, sections were dehydrated in alcohol, delipidated in a chloroform:ether:alcohol solution (8:1:1 v/v), and then rehydrated through a series of graded alcohols and distilled water, followed by incubation in 0.05% thionin for 3 min. The stain was differentiated in a 0.2% acetic acid/0.67% formalin solution for 3 min, rinsed in distilled water and dehydrated in the graded alcohols before delipidation in Citrisolv (Fisher Scientific, Pittsburgh, PA) and coverslipping.
Myelin staining was performed according to the protocol of Gallyas (Gallyas, 1979) with several modifications (Carmichael and Price, 1994). After fixation, sections were incubated in pyridine:acetic acid (2:1) for 2 hrs and rinsed in water (3 × 5 min). Next, sections were impregnated with silver using a 30 min incubation in an ammoniacal silver nitrate solution (0.1%; pH 7.5). Following rinses in 0.5% acetic acid (3 × 3 min), the staining was developed in a 2.5% sodium carbonate solution that included 0.95% ammonium nitrate, 0.1% silver nitrate, 0.5% tungsto-silicic acid, and 0.025% formalin. After 3-5 min in developer, sections were rinsed with acetic acid and water (1 min each) and then bleached for 5 min in Kodak E-6 solution:water (1:12, v/v). Finally, sections were rinsed in water (2 × 4 min) and then fixed in Kodak Ectaflo for 2 min before a final water rinse, dehydration with the graded alcohols, delipidation in Citrisolv, and coverslipping.
For acetylcholinesterase histochemistry, the 3,3'diaminobenzidine (DAB) procedure of Vincent (Vincent, 1992) was followed. Briefly, sections were rinsed (3 × 5 min) in 0.1 M maleic acid buffer, pH 6.0, and then incubated in fresh maleic acid buffer that included 5 μM potassium ferricyanide, 4μM copper sulfate, and 10 μM sodium citrate. Sections were then transferred into this same buffer supplemented with enzyme substrate, 35 μM acetylthiocholine iodide, for 6 hrs. The reaction was terminated by rinsing the sections (2 × 1 min) in 50 mM Tris buffer, pH 7.4, and then transferring them into 50 mM Tris buffer containing 1% nickel ammonium sulfate and 0.05% DAB. After a 5 min incubation, 0.001% hydrogen peroxide was added to initiate the DAB oxidation. This reaction was terminated by rinsing in Tris Buffer (3 × 5 min) before dehydration in graded alcohols, delipidation in Citrisolv, and coverslipping.
Architectonic Mapping
The Nissl, Gallyas, and acetylcholinesterase stains were used to identify 15 areas along the orbitofrontal surface according to the map of Carmichael and Price (1994). Typically, 7 coronal planes were required to sample all 15 areas in each animal. These areas were evenly divided amongst the three cortical types, agranular: Iapm, Iam, Iai, Ial, 13a; dysgranular:13b, 13m, 13l, 12o, 12r; and granular:12m, 12l, 11m, 11l, 10o (Figure 1). The ventromedial PFC (area 14) was not quantified in this study because the use of an intensifying screen prevented adequate resolution of [3H]CNI binding in the superficial layers of area 14 from binding in the lateral olfactory tract and anterior olfactory nucleus.
[3H]Cyanoimipramine Binding Protocol
[3H]CNI was used to quantify the distribution of serotonin transporter binding sites (Kovachich et al., 1988, Arango et al., 1995). Radiochemical purity of the [3H]CNI radioligand was ascertained to be greater than 95%, as determined by thin layer chromatography using a methanol:2N ammonium hydroxide (9:1, v/v) solution. Assay reliability was validated in preliminary binding studies (n = 4), using duplicate occipital cortex sections that were subsequently swiped (Whatman GF/B glass microfibre filters) and counted by liquid scintillation spectroscopy (Packard 2300 Tr, Meriden, CT). For a saturation binding study, six [3H]CNI concentrations ranging from 0.05 nM to 2nM were used. For equilibrium assessment, duplicate frontal cortex sections from 2 animals were incubated in 0.5nM [3H]CNI for 7 different time periods ranging from 5 to 40 hrs; apparent binding equilibrium was reached by 20 hrs.
For the autoradiography studies, quadruplicate sections of each area were selected from each animal to determine total [3H]CNI binding, while contiguous sections, in duplicate, were used for non-specific binding. All steps were conducted at 4°C with 50mM Tris buffer, pH 7.4, that included 130mM NaCl and 5 mM KCl. After removal from storage at −80°C and vacuum desiccation for 45 min, tissue sections were incubated for 30 min in buffer to ensure dissociation of endogenous 5-HT from uptake sites. Subsequently, tissues were incubated in 0.5nM [3H]CNI (5× the Kd) for 24 hrs; 1 μM citalopram was added to the incubation buffer to define non-specific binding. The sections were then washed in fresh buffer (2 × 30 min) and then water (30 s) to remove buffer salts. Finally, the sections were dried on a slide warmer at 30°C for 20 min, desiccated overnight, and apposed to film (Kodak Biomax MS with an LE intensifying screen) for 28 days at −80°C. Film was developed in a Kodak X-OMAT 2000A automatic film processor.
Determination of Area-specific Tritium Quenching
To determine potential areal differences in tritium quenching, a previously reported procedure was followed (Lidow et al., 1988). From 6 animals, 2 sections from each coronal plane of analysis were incubated, with stirring, for 2 hrs in 0.1M sodium phosphate buffer, pH 8.5, with 3nM [3H]succinimidyl propionate ([3H]SP) at 4°C. The sections were then rinsed in fresh phosphate buffer (4 × 1 min), followed by a 1 min rinse in distilled water (4°C) and air dried overnight. The slides were then vapor-fixed in a sealed desiccator with 30g paraformaldehyde powder, heated to 80°C for 2 hrs. After fixation, the slides were removed from the desiccator and placed in a fume hood at 25°C for 2 hrs to allow the paraformaldehyde vapors to clear. Subsequently, 1 section from each coronal plane was delipidated by dehydration in ascending graded percent alcohols (70, 90, 95, 100; for 10 min each), followed by a 1 hr incubation in Citrisolv (Fisher Scientific, Pittsburgh PA). Finally, the sections were run through a reverse progression of the graded alcohols (5 min each) before a 1 min distilled water rinse, air dried, and desiccated overnight. All sections were exposed to Kodak MR film for 2-4 weeks.
Quantitation of Autoadiograms
For quantitative densitometry of the autoradiograms, films were digitized with a Microtek i900 scanner (Carson, CA) and the images were analyzed using MCID Image Analysis 7.0 Software (St. Catherines, Ontario, Canada). Optical density readings from the co-exposed methylmethacrylate tritium standards (Amersham Pharmacia Biotech, Buckinghamshire, UK) were used to convert optical density into microcuries radioactivity per tissue wet weight with a standard curve fit using a third-order polynomial equation. The specific activity of [3H]CNI or [3H]SP was then used to calculate the concentration of bound ligand in the tissue.
Regions of interest (ROI) for each cortical area were 1mm wide and extended across all lamina in order to provide comparable resolution with PET and pharmacological fMRI studies. The areal borders were identified with the aid of the Nissl, myelin, and acetylcholinesterase stains and demarcated on the digitized Nissl, which was used for the drawing of ROIs. Generally, the ROI was placed equidistant between areal borders, as measured binding variability within an area was low (the mean standard error of measurement expressed as a coefficient of variation was 2.2%; Hopkins, 2000). If the cortical area extended into a sulcus, the ROI was placed on the gyrus to avoid the compression of the superficial stratum. To obtain [3H]CNI binding values, the ROI was transferred from the Nissl image to each corresponding total binding and non-specific binding autoradiography image. Specific binding for each area was calculated as mean total binding minus mean non-specific binding for each animal.
The ROI used for the quantitation of [3H]CNI binding was then transferred to the corresponding delipidated and non-delipidated sections labeled with [3H]SP. For each of the 15 orbitofrontal architectonic areas of interest as well as the corpus callosum and each layer of Brodmann's area 4, the percent increase in tritium concentration following delipidation was calculated as: ((delipidated [3H]SP binding value / nondelipidated [3H]SP binding value) – 1) × 100. To quench correct [3H]CNI binding, the binding value for each area was adjusted according to the following formula: [3H]CNI binding value × (delipidated [3H]SP binding value /non-delipidated [3H]SP binding value). Thus, all reported [3H]CNI binding values were quench corrected.
High performance liquid chromatography (HPLC)
Tissues were ultrasonicated for 5 s in 0.5 ml ice-cold 0.2M HClO4 containing 0.15% (w/v) Na2S2O5 and 0.05% (w/v) Na2EDTA, and centrifuged at 14,000 rpm for 15 min at 4°C; the supernatant was filtered through a 0.2μm PTFE filter prior to injection (Melega et al., 1999). The HPLC system consisted of a reverse-phase Adsorbosphere HS C18 column (100 ×4 .6 mm, particle size 3μm, (Alltech, Deerfield, IL) with a guard column (7.5 × 4.6 mm, particle size 5μm) and a Coulochem II electrochemical detector (ESA, Chelmsford, MA). The analytical cell was operated at +350mV and 500 nA. A flow rate of 0.8 ml/min was used with a mobile phase consisting of 6.5:93.5 (v/v) acetonitrile:75 mM sodium phosphate monobasic buffer containing 1.8 mM 1-octanesulfonic acid and 12 μM EDTA (pH 3.0). External reference standards were used for quantification of the unknowns according to peak area with Dynamax MacIntegrator (version 1.4) software.
Statistical Analysis
Data were analyzed using repeated measures ANOVAs with planned contrasts between levels of the within subject factor (cortical area or type). The Kd value of [3H]CNI was derived from nonlinear regression analysis (y = (Bmax*x)/(Kd +x) using Prism 4.0 (Graphpad Software, San Diego, CA). The significance level was set at p < 0.05 for all analyses; error bars represent standard error of the mean (SEM) on all graphs.
Results
Mapping the Orbitofrontal Cortex
Using Nissl, Myelin, and Acetylcholinesterase (AChE) stains, 15 areas were identified in the vervet monkey OFC according to the criteria established by Carmichael and Price (1994) in the macaque monkey. Because Carmichael and Price (1994) describe the structural features of each area in detail, here we only provide a brief description of the principal identifying structural features of each area. Although we only describe each area using a single stain here, the other histological stains were used to corroborate areal boundaries.
Areas within the agranular insula were most readily delineated using the AChE stain (Figure 4A). Iapm has the most distinct staining pattern of the agranular insula areas with two broad bands of AChE staining (layers I-III and layer V) separated by a fiber sparse band. In Iam, the band of staining in the superficial layers is less pronounced. At the boundary between Iam and Iai, the band of AChE staining in layer V narrows and then decreases to form the boundary between Iai and Ial. The more rostrally positioned 13a is demarcated by a prominent single band of dense staining in layer V that extends from the more darkly staining band in area 14c. Medially to 13a, 13m has a more bilaminate AChE staining pattern in the infragranular layers than 13a. Area 13a also has a distinct appearance in the Nissl stain with dense clusters of darkly staining cells in layer V.
Figure 4.
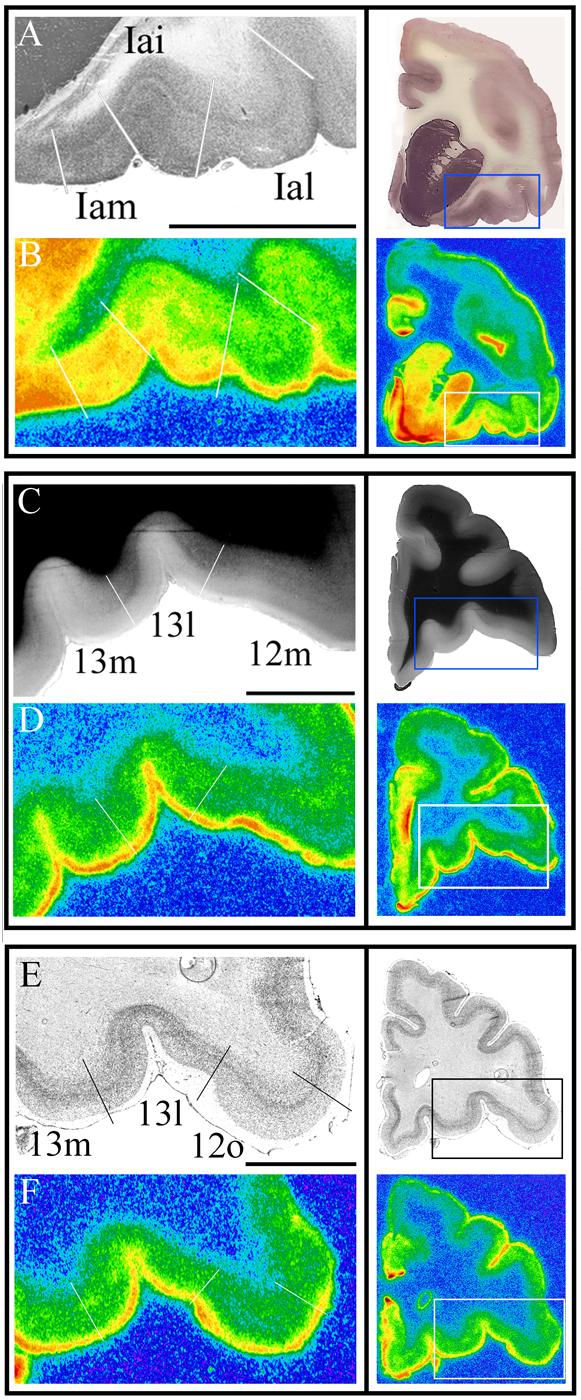
Left column: representative histological sections (A,C,E) used in the delineation of architectonic areas and corresponding autoradiographs of [3H]cyanoimipramine binding (B,D,F). White lines denote architectonic boundaries. Right column: low magnification images of the coronal sections pictured in the left column, box denotes high magnification portion. Scale bar for all images is 5 mm.
A). Acetylcholinesterase stain, Iam and Iai are distinguished by the narrower band of densely stained fibers in layer V of Iai, which is distinguished from Ial primarily by the decrease in staining density in Ial. B). [3H]Cyanoimipramine binding is area specific in this plane of the agranular insula. Across all animals (n =6), binding in Iam was 1.3 fold greater than in Iai and 1.8 fold greater than in Ial. C). Myelin (Gallyas) stain, 13m and 13l are distinguished by the more darkly stained outer band of Baillarger in 13l; 12m and 13l can be delineated by the less dense outer band of Baillarger in 12m as well as the presence of a prominent internal band of Baillarger. D). [3H]Cyanoimipramine binding in areas 13m, 13l, and 12m. In the full sample, binding in 13m and 13l was ∼1.35 fold greater than binding in 12m. E). Nissl stain, 13L and 12o are distinguished primarily by the lack of a sublaminated layer V in area 12o. F). [3H]Cyanoimipramine binding in areas 13m, 13l, and 12o. In the full sample, binding in 13m and 13l was ∼1.25 fold greater than binding in 12o.
With respect to myelin staining, area 13l had the most dense outer band of Baillarger of any orbitofrontal area, as was the case in the macaque (Carmichael and Price, 1994). This band softens considerably to form the boundary with 13m, medially, and 12m, laterally (Figure 4B). The outer band of Baillarger is absent from area 12o, while in area 12l it is accompanied by prominent fiber bundles extending into layer III.
Areas 13b, 12r, 11m, 11l, and 10o were most clearly delineated in the Nissl stain, primarily by the characteristics of layer V. In area 13b, layers III-V are arranged in a waffle-like manner with vertical and horizontal striations. More rostrally, 12r does not have a sublaminated layer V, while 11m and 11l have a prominent trilaminate layer V. In area 11l, the outer and inner bands form a more continuous stripe than in 11m. The sublamination of layer V in area 10o is less pronounced and layer IV is less distinct from layers III and V, as the granule cells spread across the boundary between these layers.
Tritium Quench
Autoradiographs of tissue sections labeled with [3H]SP exhibited higher optical densities in the cortical gray matter than in the white matter (Figure 5). Delipidation resulted in uniform optical density throughout the autoradiograph, thus eliminating the apparent tritium quench in the white matter. [3H]SP assay reliability was validated by comparing our results with published non-human primate data (Lidow et al., 1988) for the corpus collosum and each layer of Brodmann's area 4 (Brodmann, 1909, Garey, 1994). The mean increase in tritium concentration after delipidation for the corpus callosum was 123.2 ± 8.9%, which was comparable to the reported rhesus monkey value of 119.3% (Lidow et al., 1988). In area 4, the mean increase for layer II was 25.9 ± 3.7%, while for layers III (deep), V, and VI the increase was 48.9 ± 3.7 %, 55.0 ± 4.3%, 72.1 ± 4.8%, respectively. These laminar differences in tritium quench were comparable to those reported for the rhesus monkey in which the increase in layer II was 27.0% and in layers III, V, and VI the increase was 61.2%, 63.2% and 64.4%, respectively (Lidow et al., 1988).
Figure 5.
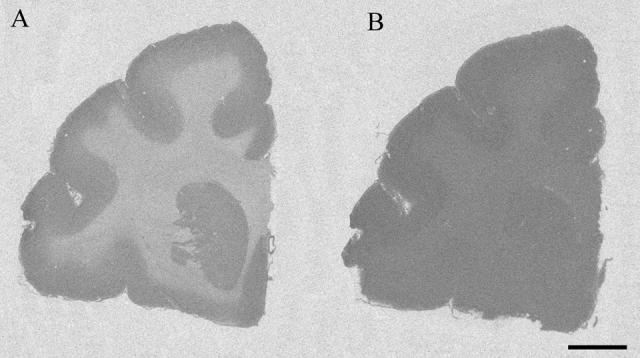
[3H]Succinimidyl propionate binding in coronal sections before (A), and after (B) delipidation. Scale bar = 5 mm.
Across all of the 15 orbitofrontal areas analyzed, the mean percent increase in calculated tritium concentration following delipidation was 32.0 ± 3.3%. A one-way repeated measures ANOVA of all 15 areas showed significant changes resulting from the delipidation (F(14,70) = 3.27; p < 0.0005) with the increase in signal being greatest in area 12l and lowest in area 10o (Table 1). To assess tritium quench as a function of cortical type, the 15 orbital areas were evenly divided into three categories: granular, dysgranular, and agranular. A one-way ANOVA of these three categories revealed no statistically significant differences in tritium quench (F(2, 58) = 0.377; p > 0.05).
Table 1.
Percent increase in tritium concentration after delipidation.
| Granular | Dysgranular | Agranular | |||
|---|---|---|---|---|---|
| 10o | 24.6 ± 6.1a,b | 13b | 29.1 ± 8.3a,b,c | Iapm | 29.7 ± 6.0 |
| 1lm | 31.2 ± 5.6a,b | 13m | 30.7 ± 8.5a,b,c | Iam | 33.8 ± 6.3 |
| 11l | 30.8 ± 6.6b | 13l | 33.1 ± 7.0a | 13a | 31.3 ± 6.4a,b |
| 12m | 33.8 ± 7.7a | 12o | 33.4 ± 9.5 | Iai | 32.2 ± 8.1 |
| 12l | 39.3 ± 9.0 | 12r | 30.8 ± 6.7a,b | Ial | 36.1 ± 5.6 |
| Mean | 31.9 ± 8.2 | Mean | 31.4 ± 7.7 | Mean | 32.6 ± 6.4 |
Values represent mean and standard deviations of six animals for all fifteen areas. Areas are arranged in columns according to cortical type. One-way repeated measures ANOVA for all 15 areas F(14,70) = 3.27, p = .0005. According to planned contrasts, area 10o had significantly less increase than all other areas, except Iapm.
= areas with significantly less increase than area 12l.
= areas with significantly less increase than area Ial.
= areas with significantly less increase than 13l.
[3H]CNI Binding Parameters
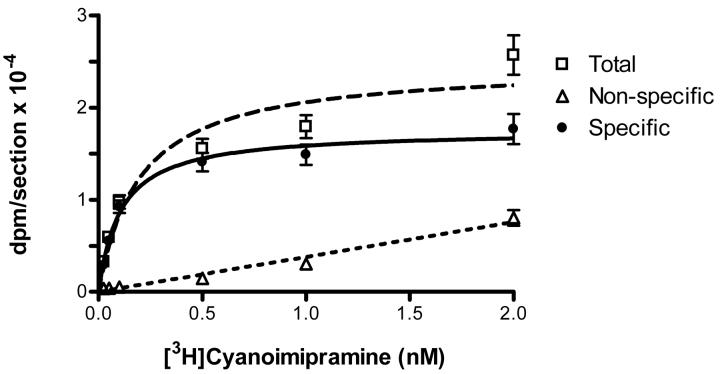
The Kd value (0.11±0.02 nM) obtained with visual cortex sections (Figure 6) was very similar to the Kd values reported for the rat frontal cortex (0.12 nM; (Kovachich et al., 1988) and the human putamen (0.32 nM; (Gurevich and Joyce, 1996).
Figure 6.
Saturation binding of [3H]cyanoimipramine (Kd = 0.11 ± 0.02 nM) determined in cortical sections.
In the autoradiography study, [3H]CNI binding was detected throughout the entire OFC, localized primarily in the gray matter (Figure 7). Non-specific binding ranged from 7.4 ± 4.0% of total binding in the area of highest binding (Iapm) to 21.3 ± 3.6% of total binding in the area of lowest binding (12l).
Figure 7.
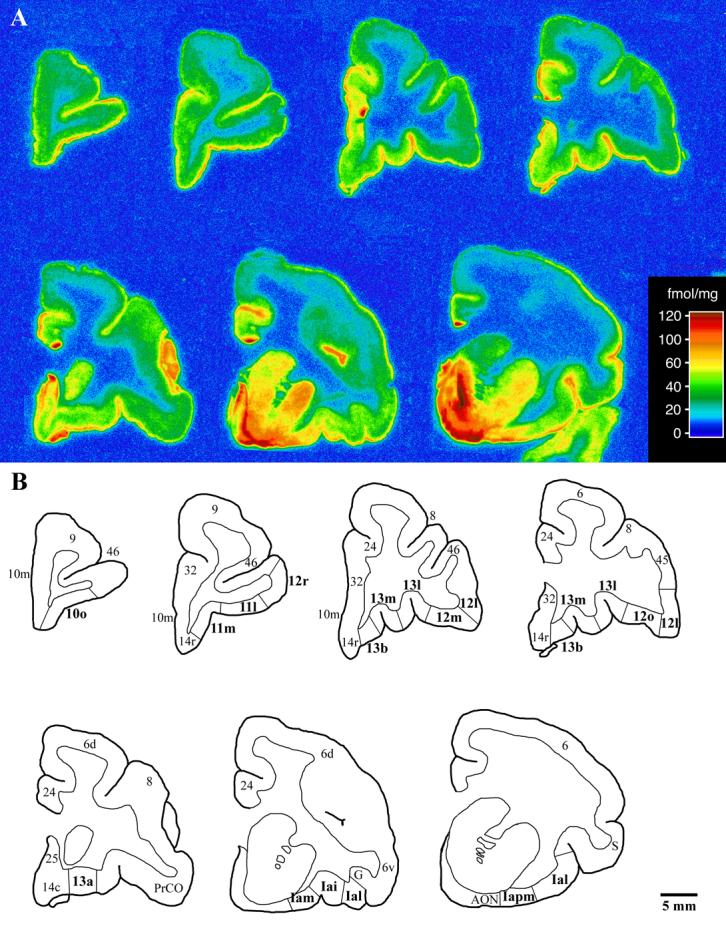
A) Coronal autoradiograms of [3H]cyanoimipramine binding in the prefrontal cortex of the vervet monkey. Sections are arranged in a rostral to caudal manner with the most rostral section located in the upper left corner and the most caudal section located in the lower right corner. Sections are not spaced at regular intervals. The scale bar denotes density of binding (fmol [3H]cyanoimipramine/mg protein). B) Sketches of the autoradiograms shown in A. The 15 orbitofrontal areas for which [3H]cyanoimipramine binding was quantified are shown in bold with architectonic boundaries delineated. Scale bar = 5mm.
Autoradiography: [3H]CNI Binding According to Cortical Type
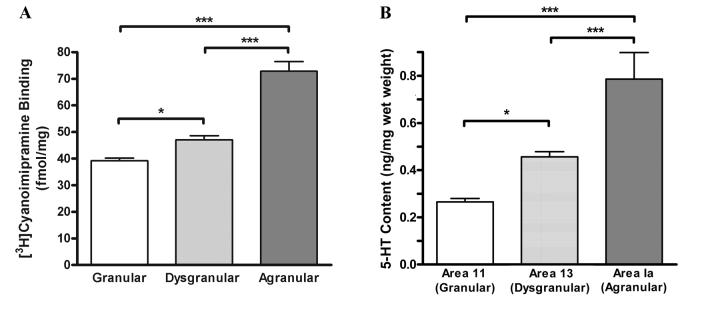
When the 15 areas were grouped according to cortical type (five areas per type; Figure 8A), there was a significant difference in [3H]CNI binding (F(2, 58) = 65.31; p < 0.0001). The mean binding in the agranular OFC was 54.8% and 85.7% greater than that in the dysgranular and granular OFC, respectively. Each group was significantly different from the others (agranular vs dysgranular: F(1,29) = 53.7, p < 0.001; dysgranular vs granular, F(1,29) = 25.4, p < 0.001).
Figure 8A.
[3H]Cyanoimipramine binding (mean, SEM) in the orbitofrontal cortex as a function of cortical type. Significance of planned contrasts denoted by *** p < 0.001. Each cortical type category consisted of five areas: granular (10o, 11m, 11l, 12l, 12m), dysgranular (13b, 13m, 13l, 12o, 12r), and agranular (13b, Iapm, Iam, Iai, Ial). (See Figure 2 for a map of these areas). 8B. Serotonin Content in orbitofrontal cortical areas as a function of cortical type; *** p < .001, ** p < 0.01, * p < 0.05.
HPLC: Serotonin Content According to Cortical Type
Serotonin content was differentially distributed across the three areas representing each cortical type (F(2,10) = 19.97; p < 0.0005; Figure 8B). As was observed for the SERT, there was a gradient of serotonin content which was highest in the putative agranular insula area, and 36% and 197% greater than that in putative area 13 (dysgranular) and area 11 (granular), respectively (agranular vs dysgranular: F(1,5) = 122.3, p < 0.001; dysgranular vs granular: F(1,5) = 12.0, p < 0.05).
Autoradiography: [3H]CNI binding within Cortical Type
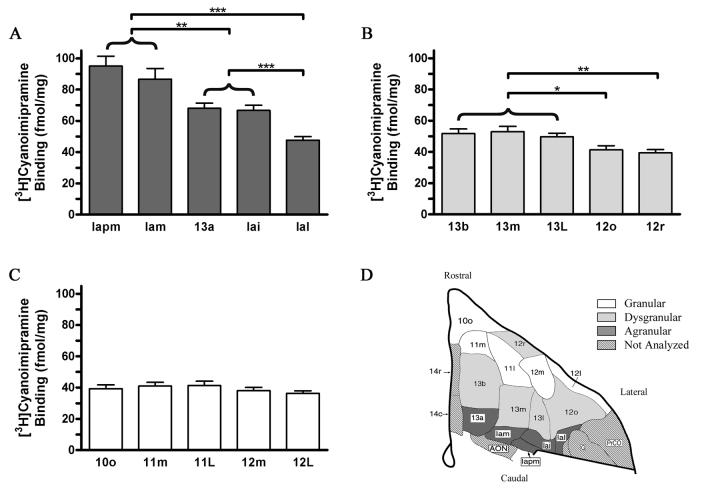
The greatest differences in binding densities were observed between areas within the agranular OFC (F(4, 20) = 27.6; p < 0.0001). According to planned contrasts, all agranular areas were significantly different from each other (Figure 9), with the exception of Iam vs Iapm (F(1,5) = 3.12, p > .05) and 13a vs Iai (F(1,5) = .09, p > .05). For areas occurring in the same coronal plane, [3H]CNI binding showed a medial to lateral gradient of decreases in density.
Figure 9.
[3H]Cyanoimpramine binding (mean, SEM) within cortical type. A) Agranular areas; B) Dysgranular areas; C) Granular areas; D) Architectonic map with shading corresponding to the respective graphs; *** p < 0.001, ** p < 0.01.
Within the dysgranular cortical type, there were also significant areal differences in [3H]CNI binding that also showed a medial to lateral gradient of decreases in density (F(4,20) = 8.79; p < 0.001). There were no significant differences in [3H]CNI binding between the subdivisions of either area 13 or of area 12. Thus, with respect to [3H]CNI binding in the dysgranular portions of areas 12 and 13, it was unnecessary to subdivide Walker's (1940) areas. However, each subdivision of area 12 (12o, 12r) had significantly less [3H]CNI binding than each of the three subdivisions of area 13 (12o vs 13b, F(1,5)= 8.3, p < 0.05; 12o vs 13m, F(1,5)= 7.4, p < 0.05; 12o vs 13l, F(1,5)= 6.3, p = 0.05; 12r vs 13b, F(1,5)= 22.0, p < 0.01; 12r vs 13m, F(1,5)= 16.7, p<0.01; 12r vs 13l, F(1,5)= 15.8, p = 0.01).
Within the granular OFC, there were no significant differences in [3H]CNI binding (F(4, 20) = 2.1; p > .05) according to a one-way repeated measures ANOVA. Similarly, comparison of all four subdivisions of Walker's area 12, which included dysgranular areas 12r and 12o as well granular areas 12l and 12m, revealed no significant differences in [3H]CNI binding. Thus, [3H]CNI binding was homogenously distributed across the four subdivisions of Walker's area 12, as delineated by Carmichael and Price (1994). Although cortical type did not distinguish between these lateral, rostral OFC areas with respect to [3H]CNI binding, it did distinguish between each of the subdivisions of area 12 and the lateral agranular area Ial (F(4,20)= 9.15, p < . 001; Ial vs 12l: F(1,5)= 32.3, p < .01; Ial vs 12m: F(1,5)= 16.0, p < .01; Ial vs 12o: F(1,5)=5.5, p = .07; and Ial vs 12r: F(1,5)= 29.5, p < .01).
DISCUSSION
The principal finding of this study was that the SERT distribution within the vervet monkey OFC was organized according to cortical type and cortical area. In general, two gradients in SERT density were observed. One consisted of decreases from the caudal to rostral OFC, paralleling changes in cortical type. The other was a medial to lateral gradient within the agranular and dysgranular OFC. Thus, density was highest in the caudomedial area Iapm and lowest in the rostral and lateral granular areas (Figure 10). Before further elaborating upon these SERT distribution patterns, we discuss three methodological issues related to interpretation of [3H]CNI binding and architectonic mapping of the vervet OFC.
Figure 10.
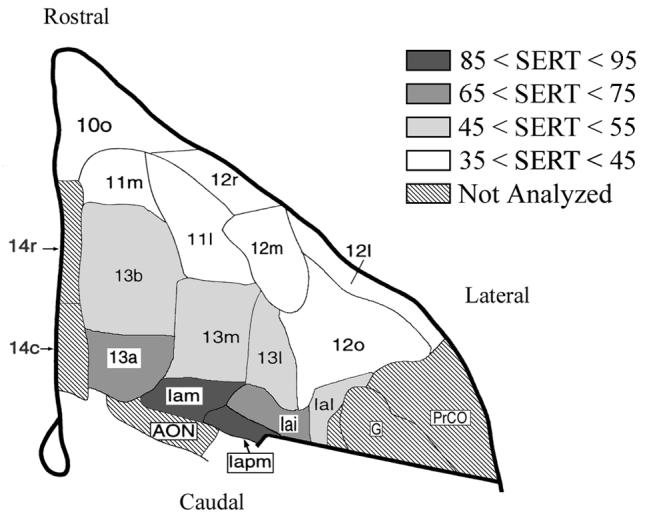
Summary map of [3H]cyanoimpramine binding density in the orbitofrontal cortex as a function of architectonic area.
Methodological Considerations
Tritium Quench
As myelin can reduce the detection of tritium signal by autoradiography (Alexander et al., 1981), traditionally referred to as “tritium quench” (Kuhar et al., 1985), each area's SERT binding value was corrected for lipid content using the [3H]SP technique. For the same brain areas (the corpus callosum as well as the different lamina of Brodmann's area 4), there was a high degree of correspondence between our results and those obtained in the rhesus monkey (Lidow et al., 1988). This technical validation provided confidence that quench-corrected SERT binding corresponded to SERT densities.
With respect to cortical area (Table 1), the higher myelin density in areas 12l, 13l, and Ial is consistent with prior qualitative observations of these areas (Preuss and Goldman-Rakic, 1991, Carmichael and Price, 1994). However, noted qualitative differences in myeloarchitecture between cortical types (Barbas and Pandya, 1989) were not reflected in significant differences in attenuation of the tritium signal. Because the [3H]SP technique was sensitive enough to detect small differences in myelin density, the lack of significant differences between cortical types may be a result of quantifying myelin density across all lamina for each measurement.
SERT Density as a Marker of Serotonin Innervation
Over the years, various analytical methods have been used to quantify serotonin axon density, each with strengths and weaknesses. The classical approach has been the measurement of serotonin content, but the value of this approach is diminished by the inability to apply histological criteria to the delineation of cortical areas. Further complicating the dissection is the extensive variability of morphological landmarks such as sulci along the orbitofrontal surface in individual subjects (Chiavaras and Petrides, 2000). A greater degree of anatomical precision can be obtained with immunohistochemistry using antibodies to serotonin-protein conjugates (Steinbusch et al., 1978), but this approach has been less amenable to quantification and may not identify all fibers because of post-mortem artifacts (e.g. loss of serotonin due to oxidation by monoamine oxidase; (Nielsen et al., 2006). Immunohistochemistry and autoradiography for the SERT have also been used, but the caveat with both techniques is that the SERT protein is the object of direct measurement rather than serotonin fibers. Thus, the use of SERT density as a marker of the serotonin innervation is dependent upon the assumption that the density of the transporter is proportional to the density of fiber innervation within the same area. Although exceptions to this assumption have been noted (Brown and Molliver, 2000) (Pickel and Chan, 1999), they are presumed to account for only minor differences in the measured SERT density (Soucy et al., 1994).
Thus, in the absence of a single “gold standard” for quantifying serotonin axonal density, we used two complementary markers of the serotoninergic innervation: serotonin content and SERT ligand-binding. That both methods yielded similar relative distributions is consistent with results from both the human (Laruelle et al., 1988) and the rodent (Dewar et al., 1992, Duncan et al., 1992). Therefore, we interpret the density of [3H]CNI binding to be proportional to the density of serotoninergic innervation in normal adult nonhuman primate subjects.
Mapping of the Orbitofrontal Cortex
The OFC of Chlorocebus (also referred to as Cercopithecus) has not been parcellated since Brodmann (Brodmann, 1909, Garey, 1994), whose analysis was not sufficiently detailed for the aims of this study. Hence, a more precise architectonic parcellation scheme that was developed in the macaque (Carmichael and Price, 1994) was applied to the vervet in this study. This approach was successful in that each area delineated in the macaque OFC was reliably identified in the vervet OFC. These similarities suggest that cortical organization exhibits a high degree of homology between these two Old World nonhuman primate species (Figure 3).
As this map provides a useful means to interpret the SERT distribution within the OFC, the following discussion is divided into two parts: first, the distribution of the SERT when OFC areas are grouped according to their cortical type; and, second, the distribution within cortical type.
SERT Density and Cortical Type
A key finding of this study was the consistent relationship between SERT density and cortical type (Figure 8A). SERT density was highest in the agranular OFC, intermediate in the dysgranular OFC, and lowest in the granular OFC. Hence, cortical type predicted the SERT density of adjacent areas with differing types, except for the subdivisions of area 12. Further, these relative decreases in SERT density were paralleled by similar decreases in serotonin content (Figure 8B). Thus, the similar distribution of these two serotoninergic markers provides evidence that the density of orbitofrontal serotoninergic innervation is highest in limbic areas and lowest in isocortical areas.
This gradient of serotoninergic innervation as a function of cortical type parallels that of the cholinergic innervation (Mesulam et al., 1984, Mesulam et al., 1986) and further corroborates cortical type as a fundamental organizing unit in cortex (Barbas, 2004).
SERT Density and Cortical Area
In shifting the anatomical level of analysis from cortical type to the more refined parcellation by cortical area, a heterogeneous pattern of SERT density was also observed (Figure 9). When cortical areas within a cortical type were compared, a medial to lateral gradient of decreases in SERT density, particularly in non-isocortical areas, was observed. Thus, within the agranular OFC, SERT density was highest in medial areas and decreased laterally (Iapm and Iam > Iai > Ial). Likewise in the dysgranular OFC, SERT density was higher in medial than lateral areas (area 13 > area 12). However, within the granular OFC significant differences in SERT density between the five granular OFC areas were not observed. Thus, SERT density was homogeneous throughout the granular OFC while heterogeneously distributed across both the agranular and dysgranular OFC.
Thus, heterogeneity of SERT density in the OFC can be identified at the level of either cortical area or cortical type. This heterogeneity of innervation contrasts with prior characterizations of the prefrontal cortex as possessing an apparent homogeneous serotoninergic innervation, with little differences in density between orbitofrontal areas (Lewis and Morrison, 1989, Lidow et al., 1989, Lewis, 1990). However, in those studies, it appears that only the rostral portion of the OFC was analyzed. Our results in this region likewise showed a relatively uniform SERT density but contrasted with the pronounced heterogeneity of SERT density identified in the more caudal portions of the OFC, namely the agranular and dysgranular OFC.
Heretofore, the persistent notion of a uniform anatomical distribution of serotonin afferents within the OFC has dovetailed with the view of the serotonin system as a diffuse, non-specific modulator of cerebral function (White, 1989). However, at the anatomical level, that characterization of serotoninergic innervation as homogeneous has been gradually dispelled for other regions of the cerebral cortex (Parnavelas and Papadopoulos, 1989, Wilson and Molliver, 1991), while persisting for the prefrontal cortex (Fuster, 1997, Cavada et al., 2000). Our data, derived from the orbital portion of the PFC, provides evidence for the OFC to be grouped with other cortical regions, as possessing heterogeneous patterns of SERT density, and by inference, innervation density. Additionally, rather than exhibiting gradual, graded shifts in density within and across areal boundaries, as is seen with the dopaminergic innervation (Williams and Goldman-Rakic, 1993), the apparent distinctive changes in serotoninergic innervation were observed predominantly at borders between architectonic areas (Figure 4). As each of these areas has a unique cellular architecture and pattern of connectivity (Carmichael and Price, 1994), this differential targeting by serotoninergic afferents suggests that serotoninergic projections are structured for compartmentalized modulation of information processing within the OFC. Testing of this hypothesis will require future studies that selectively lesion the serotoninergic projections to specific subdivisions of the OFC.
Relevance to Studies of the Human Frontal Cortex
Architectonic homologues of each of the 15 orbitofrontal areas mapped in this study have been identified in the human (Ongur et al., 2003). These areas can also be grouped by cortical type, though due to the expansion of the granular OFC the agranular and dysgranular OFC of the human is proportionally smaller (Semendeferi et al., 1998, Semendeferi et al., 2001). Nonetheless, the same architectonic features are present with similar topographical relationships in the monkey and human.
In light of these architectural similarities, the human serotoninergic OFC innervation is likely to be organized according to similar organizational principles as identified in the monkey. Although an exhaustive characterization of the orbitofrontal serotoninergic innervation in the human has not been performed, the extant data are consistent with these organizational principles. The strongest evidence is for cortical type, where the serotoninergic innervation has been noted to preferentially project to limbic rather than isocortical areas (Costa and Aprison, 1958, Hensler et al., 1991, Varnas et al., 2004). With respect to cortical area, there is suggestive evidence of area-specific SERT binding within the OFC (Arango et al., 1995, Arango et al., 2002, Rosel et al., 2002).
Functional Implications
The observed conformity of the OFC serotoninergic innervation to these two organizational principles may be of aid in the further development of recent theories concerning how information is processed within the OFC. For example, a caudal to rostral functional processing hierarchy has been proposed for the representation of stimulus value, which is an operation critical for affect regulation and impulse control (Kringelbach and Rolls, 2004, Bechara and Damasio, 2005). This functional hierarchy parallels the caudal to rostral gradient of serotoninergic innervation density we have characterized, suggesting a graded serotoninergic influence within the hierarchy. This hypothesized relationship between innervation density and function awaits testing with studies combining neuroimaging with pharmacological manipulation of the serotonin system. Such studies may be of relevance for understanding not only the treatment of psychiatric disorders but also their etiology.
ACKNOWLEDGEMENTS
This research was supported in part by a contract from the National Institutes of Health (grant number: DA 11237 and MH 15750) and the Harry Frank Guggenheim Foundation. The authors wish to thank the anonymous reviewers for their thoughtful and constructive comments on the manuscript.
List of Abbreviations
- [3H]CNI
[3H]Cyanoimipramine
- FDG-PET
Fluorodeoxyglucose Positron Emission Tomography
- HPLC
High performance liquid chromatography
- OFC
Orbitofrontal Cortex
- PFC
Prefrontal Cortex
- ROI
Region of Interest
- SERT
Serotonin Transporter
- [3H]SP
[3H]Succinimidyl propionate
Footnotes
Neuroanatomy Section Editor: Dr. Charles R. Gerfen
Publisher's Disclaimer: This is a PDF file of an unedited manuscript that has been accepted for publication. As a service to our customers we are providing this early version of the manuscript. The manuscript will undergo copyediting, typesetting, and review of the resulting proof before it is published in its final citable form. Please note that during the production process errors may be discovered which could affect the content, and all legal disclaimers that apply to the journal pertain.
References
- Alexander GM, Schwartzman RJ, Bell RD, Yu J, Renthal A. Quantitative measurement of local cerebral metabolic rate for glucose utilizing tritiated 2-deoxyglucose. Brain Res. 1981;223:59–67. doi: 10.1016/0006-8993(81)90806-4. [DOI] [PubMed] [Google Scholar]
- Arango V, Underwood MD, Gubbi AV, Mann JJ. Localized alterations in pre- and postsynaptic serotonin binding sites in the ventrolateral prefrontal cortex of suicide victims. Brain Res. 1995;688:121–133. doi: 10.1016/0006-8993(95)00523-s. [DOI] [PubMed] [Google Scholar]
- Arango V, Underwood MD, Mann JJ. Serotonin brain circuits involved in major depression and suicide. Progress in Brain Research. 2002;136:443–453. doi: 10.1016/s0079-6123(02)36037-0. [DOI] [PubMed] [Google Scholar]
- Barbas H. Dead tissue, living ideas: facts and theory from neuroanatomy. Cortex. 2004;40:205–206. doi: 10.1016/s0010-9452(08)70951-1. [DOI] [PubMed] [Google Scholar]
- Barbas H, Pandya DN. Architecture and intrinsic connections of the prefrontal cortex in the rhesus monkey. J Comp Neurol. 1989;286:353–375. doi: 10.1002/cne.902860306. [DOI] [PubMed] [Google Scholar]
- Bechara A, Damasio AR. The somatic marker hypothesis: A neural theory of economic decision. Games and Economic Behavior. 2005;52:336–372. [Google Scholar]
- Beique JC, Lavoie N, de Montigny C, Debonnel G. Affinities of venlafaxine and various reuptake inhibitors for the serotonin and norepinephrine transporters. Eur J Pharmacol. 1998;349:129–132. doi: 10.1016/s0014-2999(98)00241-6. [DOI] [PubMed] [Google Scholar]
- Brodmann K. Vergleichende Lokalisationslehre der Grosshirnrinde in ihren Prinzipien dargestellt auf Grund des Zellenbaues. J.A. Barth; Leipzig: 1909. [Google Scholar]
- Brower MC, Price BH. Neuropsychiatry of frontal lobe dysfunction in violent and criminal behaviour: a critical review. J Neurol Neurosurg Psychiatry. 2001;71:720–726. doi: 10.1136/jnnp.71.6.720. [DOI] [PMC free article] [PubMed] [Google Scholar]
- Brown P, Molliver ME. Dual serotonin (5-HT) projections to the nucleus accumbens core and shell: relation of the 5-HT transporter to amphetamine-induced neurotoxicity. J Neurosci. 2000;20:1952–1963. doi: 10.1523/JNEUROSCI.20-05-01952.2000. [DOI] [PMC free article] [PubMed] [Google Scholar]
- Carmichael ST, Price JL. Architectonic subdivision of the orbital and medial prefrontal cortex in the macaque monkey. J Comp Neurol. 1994;346:366–402. doi: 10.1002/cne.903460305. [DOI] [PubMed] [Google Scholar]
- Cavada C, Company T, Tejedor J, Cruz-Rizzolo RJ, Reinoso-Suarez F. The anatomical connections of the macaque monkey orbitofrontal cortex. A review. Cereb Cortex. 2000;10:220–242. doi: 10.1093/cercor/10.3.220. [DOI] [PubMed] [Google Scholar]
- Chiavaras MM, Petrides M. Orbitofrontal sulci of the human and macaque monkey brain. J Comp Neurol. 2000;422:35–54. [PubMed] [Google Scholar]
- Clarke HF, Walker SC, Dalley JW, Robbins TW, Roberts AC. Cognitive Inflexibility after Prefrontal Serotonin Depletion Is Behaviorally and Neurochemically Specific. Cereb Cortex. 2006 doi: 10.1093/cercor/bhj120. [DOI] [PubMed] [Google Scholar]
- Costa E, Aprison MH. Studies on the 5-hydroxytryptamine (serotonin) content in human brain. Journal of Nervous and Mental Disease. 1958;126 doi: 10.1097/00005053-195803000-00008. [DOI] [PubMed] [Google Scholar]
- Dewar KM, Grondin L, Carli M, Lima L, Reader TA. [3H]Paroxetine Binding and serotonin content of rat cortical areas, hippocampus, neostriatum, ventral meencephalic tegmentum, and midbrain raphe nuclei region following p-chlorophenylalanine and p-chloroamphetamine treatment. Journal of Neurochemistry. 1992;58:250–257. doi: 10.1111/j.1471-4159.1992.tb09303.x. [DOI] [PubMed] [Google Scholar]
- Duncan GE, Little KY, Kirkman JA, Kaldas RS, Stumpf WE, Breese GR. Autoradiographic characterization of [3H]imipramine and [3H]citalopram binding in rat and human brain: species differences and relationships to serotonin innervation patterns. Brain Research. 1992;591:181–197. doi: 10.1016/0006-8993(92)91699-f. [DOI] [PubMed] [Google Scholar]
- Friedlander L, Desrocher M. Neuroimaging studies of obsessive-compulsive disorder in adults and children. Clin Psychol Rev. 2006;26:32–49. doi: 10.1016/j.cpr.2005.06.010. [DOI] [PubMed] [Google Scholar]
- Fuster JM. The prefrontal cortex: anatomy, physiology and neuropsychology of the frontal lobe. Lippincott-Raven; Philadelphia: 1997. [Google Scholar]
- Gallyas F. Silver staining of myelin by means of physical development. Neurol Res. 1979;1:203–209. doi: 10.1080/01616412.1979.11739553. [DOI] [PubMed] [Google Scholar]
- Garey LJ. Brodmann's ’Localisation in the cerebral cortex’. Smith-Gordon and Co.; London: 1994. [Google Scholar]
- Gurevich EV, Joyce JN. Comparison of [3H]paroxetine and [3H]cyanoimipramine for quantitative measurement of serotonin transporter sites in human brain. Neuropsychopharmacology. 1996;14:309–323. doi: 10.1016/0893-133X(95)00139-5. [DOI] [PubMed] [Google Scholar]
- Harvey DC, Lacan G, Tanious SP, Melega WP. Recovery from methamphetamine induced long-term nigrostriatal dopaminergic deficits without substantia nigra cell loss. Brain Res. 2000;871:259–270. doi: 10.1016/s0006-8993(00)02439-2. [DOI] [PubMed] [Google Scholar]
- Hensler JG, Kovachich GB, Frazer A. A quantitative autoradiographic study of serotonin1A receptor regulation. Effect of 5,7-dihydroxytryptamine and antidepressant treatments. Neuropsychopharmacology. 1991;4:131–144. [PubMed] [Google Scholar]
- Herkenham M, Sokoloff L. Quantitative receptor autoradiography: tissue defatting eliminates differential self-absorption of tritium radiation in gray and white matter of brain. Brain Res. 1984;321:363–368. doi: 10.1016/0006-8993(84)90194-x. [DOI] [PubMed] [Google Scholar]
- Hyttel J, Larsen JJ. Serotonin-selective antidepressants. Acta Pharmacol Toxicol (Copenh) 1985;56(Suppl 1):146–153. doi: 10.1111/j.1600-0773.1985.tb02506.x. [DOI] [PubMed] [Google Scholar]
- Kovachich GB, Aronson CE, Brunswick DJ, Frazer A. Quantitative autoradiography of serotonin uptake sites in rat brain using [3H]cyanoimipramine. Brain Res. 1988;454:78–88. doi: 10.1016/0006-8993(88)90805-0. [DOI] [PubMed] [Google Scholar]
- Kringelbach ML, Rolls ET. The functional neuroanatomy of the human orbitofrontal cortex: evidence from neuroimaging and neuropsychology. Prog Neurobiol. 2004;72:341–372. doi: 10.1016/j.pneurobio.2004.03.006. [DOI] [PubMed] [Google Scholar]
- Kuhar MJ, Unnerstall JR, De Souza EB. Receptor mapping in neuropharmacology by autoradiography: some technical problems. NIDA Res Monogr. 1985;62:1–12. [PubMed] [Google Scholar]
- Laruelle M, Vanisberg MA, Maloteaux JM. Regional and subcellular localization in human brain of [3H]paroxetine binding, a marker of serotonin uptake sites. Biol Psychiatry. 1988;24:299–309. doi: 10.1016/0006-3223(88)90198-9. [DOI] [PubMed] [Google Scholar]
- Lewis DA. The organization of chemically-identified neural systems in monkey prefrontal cortex: afferent systems. Prog Neuropsychopharmacol Biol Psychiatry. 1990;14:371–377. doi: 10.1016/0278-5846(90)90025-c. [DOI] [PubMed] [Google Scholar]
- Lewis DA, Campbell MJ, Foote SL, Morrison JL. The monoaminergic innervation of primate neocortex. Human Neurobiology. 1986;5:181–188. [PubMed] [Google Scholar]
- Lewis DA, Morrison JH. Noradrenergic innervation of monkey prefrontal cortex: a dopamine-beta-hydroxylase immunohistochemical study. J Comp Neurol. 1989;282:317–330. doi: 10.1002/cne.902820302. [DOI] [PubMed] [Google Scholar]
- Lidow MS, Goldman-Rakic PS, Gallager DW, Rakic P. Quantitative autoradiographic mapping of serotonin 5-HT1 and 5-HT2 receptors and uptake sites in the neocortex of the rhesus monkey. J Comp Neurol. 1989;280:27–42. doi: 10.1002/cne.902800104. [DOI] [PubMed] [Google Scholar]
- Lidow MS, Goldman-Rakic PS, Rakic P, Gallager DW. Differential quenching and limits of resolution in autoradiograms of brain tissue labeled with 3H-, 125I- and 14C-compounds. Brain Res. 1988;459:105–119. doi: 10.1016/0006-8993(88)90290-9. [DOI] [PubMed] [Google Scholar]
- Melega WP, Cho AK, Schmitz D, Kuczenski R, Segal DS. l-methamphetamine pharmacokinetics and pharmacodynamics for assessment of in vivo deprenyl-derived l-methamphetamine. J Pharmacol Exp Ther. 1999;288:752–758. [PubMed] [Google Scholar]
- Mesulam MM, Rosen AD, Mufson EJ. Regional variations in cortical cholinergic innervation: chemoarchitectonics of acetylcholinesterase-containing fibers in the macaque brain. Brain Res. 1984;311:245–258. doi: 10.1016/0006-8993(84)90087-8. [DOI] [PubMed] [Google Scholar]
- Mesulam MM, Volicer L, Marquis JK, Mufson EJ, Green RC. Systematic regional differences in the cholinergic innervation of the primate cerebral cortex: distribution of enzyme activities and some behavioral implications. Ann Neurol. 1986;19:144–151. doi: 10.1002/ana.410190206. [DOI] [PubMed] [Google Scholar]
- Morecraft RJ, Geula C, Mesulam MM. Cytoarchitecture and neural afferents of orbitofrontal cortex in the brain of the monkey. J Comp Neurol. 1992;323:341–358. doi: 10.1002/cne.903230304. [DOI] [PubMed] [Google Scholar]
- New AS, Buchsbaum MS, Hazlett EA, Goodman M, Koenigsberg HW, Lo J, Iskander L, Newmark R, Brand J, O'Flynn K, Siever LJ. Fluoxetine increases relative metabolic rate in prefrontal cortex in impulsive aggression. Psychopharmacology (Berl) 2004;176:451–458. doi: 10.1007/s00213-004-1913-8. [DOI] [PubMed] [Google Scholar]
- Nielsen K, Brask D, Knudsen GM, Aznar S. Immunodetection of the serotonin transporter protein is a more valid marker for serotonergic fibers than serotonin. Synapse. 2006;59:270–276. doi: 10.1002/syn.20240. [DOI] [PubMed] [Google Scholar]
- Ongur D, Ferry AT, Price JL. Architectonic subdivision of the human orbital and medial prefrontal cortex. J Comp Neurol. 2003;460:425–449. doi: 10.1002/cne.10609. [DOI] [PubMed] [Google Scholar]
- Parnavelas JG, Papadopoulos GC. The monoaminergic innervation of the cerebral cortex is not diffuse and nonspecific. Trends Neurosci. 1989;12:315–319. doi: 10.1016/0166-2236(89)90037-4. [DOI] [PubMed] [Google Scholar]
- Petrides M, Pandya DN. Comparative cytoarchitectonic analysis of the human and the macaque ventrolateral prefrontal cortex and corticocortical connection patterns in the monkey. Eur J Neurosci. 2002;16:291–310. doi: 10.1046/j.1460-9568.2001.02090.x. [DOI] [PubMed] [Google Scholar]
- Pickel VM, Chan J. Ultrastructural localization of the serotonin transporter in limbic and motor compartments of the nucleus accumbens. J Neurosci. 1999;19:7356–7366. doi: 10.1523/JNEUROSCI.19-17-07356.1999. [DOI] [PMC free article] [PubMed] [Google Scholar]
- Preuss TM, Goldman-Rakic PS. Myelo- and cytoarchitecture of the granular frontal cortex and surrounding regions in the strepsirhine primate Galago and the anthropoid primate Macaca. J Comp Neurol. 1991;310:429–474. doi: 10.1002/cne.903100402. [DOI] [PubMed] [Google Scholar]
- Price JL, Carmichael ST, Drevets WC. Networks related to the orbital and medial prefrontal cortex; a substrate for emotional behavior? Progress in Brain Research. 1996;107:523–536. doi: 10.1016/s0079-6123(08)61885-3. [DOI] [PubMed] [Google Scholar]
- Raine A, Yang Y. Neural foundations to moral reasoning and antisocial behavior. Social Cognitive and Affective Neuroscience. 2006;1:203–213. doi: 10.1093/scan/nsl033. [DOI] [PMC free article] [PubMed] [Google Scholar]
- Robbins TW. Chemical neuromodulation of frontal-executive functions in humans and other animals. Exp Brain Res. 2000;133:130–138. doi: 10.1007/s002210000407. [DOI] [PubMed] [Google Scholar]
- Rosel P, Arranz B, Urretavizcaya M, Oros M, San L, Vallejo J, Navarro MA. Different distributions of the 5-HT reuptake complex and the postsynaptic 5-HT(2A) receptors in Brodmann areas and brain hemispheres. Psychiatry Res. 2002;111:105–115. doi: 10.1016/s0165-1781(02)00146-4. [DOI] [PubMed] [Google Scholar]
- Saxena S, Brody AL, Maidment KM, Dunkin JJ, Colgan M, Alborzian S, Phelps ME, Baxter LR., Jr. Localized orbitofrontal and subcortical metabolic changes and predictors of response to paroxetine treatment in obsessive-compulsive disorder. Neuropsychopharmacology. 1999;21:683–693. doi: 10.1016/S0893-133X(99)00082-2. [DOI] [PubMed] [Google Scholar]
- Semendeferi K, Armstrong E, Schleicher A, Zilles K, Van Hoesen GW. Limbic frontal cortex in hominoids: a comparative study of area 13. Am J Phys Anthropol. 1998;106:129–155. doi: 10.1002/(SICI)1096-8644(199806)106:2<129::AID-AJPA3>3.0.CO;2-L. [DOI] [PubMed] [Google Scholar]
- Semendeferi K, Armstrong E, Schleicher A, Zilles K, Van Hoesen GW. Prefrontal cortex in humans and apes: a comparative study of area 10. Am J Phys Anthropol. 2001;114:224–241. doi: 10.1002/1096-8644(200103)114:3<224::AID-AJPA1022>3.0.CO;2-I. [DOI] [PubMed] [Google Scholar]
- Soucy JP, Lafaille F, Lemoine P, Mrini A, Descarries L. Validation of the transporter ligand cyanoimipramine as a marker of serotonin innervation density in brain. J Nucl Med. 1994;35:1822–1830. [PubMed] [Google Scholar]
- Steinbusch HW, Verhofstad AA, Joosten HW. Localization of serotonin in the central nervous system by immunohistochemistry: description of a specific and sensitive technique and some applications. Neuroscience. 1978;3:811–819. doi: 10.1016/0306-4522(78)90033-7. [DOI] [PubMed] [Google Scholar]
- Varnas K, Halldin C, Hall H. Autoradiographic distribution of serotonin transporters and receptor subtypes in human brain. Hum Brain Mapp. 2004;22:246–260. doi: 10.1002/hbm.20035. [DOI] [PMC free article] [PubMed] [Google Scholar]
- Vincent SR. Histochemistry of endogenous eznymes. In: Bolam JP, editor. Experimental neuroanatomy: a practical approach. Oxford University Press; New York: 1992. pp. 153–172. [Google Scholar]
- Walker AE. A cytoarchitectural study of the prefrontal area of the macaque monkey. Journal of Comparative Neurology. 1940;73:59–86. [Google Scholar]
- White EL. Cortical circuits : synaptic organization of the cerebral cortex--structure, function, and theory. Birkhäuser; Boston: 1989. [Google Scholar]
- Whiteside SP, Port JD, Abramowitz JS. A meta-analysis of functional neuroimaging in obsessive-compulsive disorder. Psychiatry Res. 2004;132:69–79. doi: 10.1016/j.pscychresns.2004.07.001. [DOI] [PubMed] [Google Scholar]
- Williams SM, Goldman-Rakic PS. Characterization of the dopaminergic innervation of the primate frontal cortex using a dopamine-specific antibody. Cereb Cortex. 1993;3:199–222. doi: 10.1093/cercor/3.3.199. [DOI] [PubMed] [Google Scholar]
- Wilson MA, Molliver ME. The organization of serotonin projections to cerebral cortex in primates: regional distribution of axon terminals. Neuroscience. 1991;44:537–553. doi: 10.1016/0306-4522(91)90076-z. [DOI] [PubMed] [Google Scholar]
- Zald DH, Kim SW. Anatomy and function of the orbital frontal cortex, II: Function and relevance to obsessive-compulsive disorder. J Neuropsychiatry Clin Neurosci. 1996;8:249–261. doi: 10.1176/jnp.8.3.249. [DOI] [PubMed] [Google Scholar]


