

Introduction
Albinism represents a group of conditions linked to mutations in one or more of the genes associated with the synthesis of melanin, resulting in a reduction or absence in melanin in the hair, skin and/or eyes (McHam and Fulton, 1992). While the prevalence of albinism is relatively low in humans, affecting approximately 1 in 10–20,000, albinism has significant visual ramifications (McHam and Fulton, 1992; Jeffery, 1997), including high refractive errors (both myopia and hyperopia), nystagmus and reduced vision (Wildsoet et al., 2002). Our specific interest in albinism is in the nature of the link between the ocular melanin deficiency and observed refractive error abnormalities. We used the chick as an animal model to explore this question.
In albino eyes, the lack of intraocular melanin renders normally pigmented structures (iris, ciliary body, choroid and retinal pigment epithelium (RPE)) translucent. Light also can pass through the scleral wall to reach the photoreceptors, bypassing the optical image-forming components of the eye. The increase in intraocular light scatter contributes to retinal image degradation and thus visual impairment in albino humans (Wildsoet et al., 2000; Shen et al., 2001). Because these conditions prevail from birth, disruption of emmetropization and myopia are likely outcomes based on animal form deprivation studies (Smith, 1999; Wildsoet et al., 2002; Tran et al., 2005). That a retinal functional deficit might contribute to the refractive error abnormalities in albinism also would be consistent with the recognized role for the retina in ocular growth regulation and thus emmetropization (Troilo et al., 1987; Wildsoet and Pettigrew, 1988), and the reports of abnormalities in the number, development and connections of retinal cells in several albino animal species (cats, ferrets, wallabies and rabbits) (Guillery et al., 1984; Putting et al., 1994; Jeffery, 1998; Rachel et al., 2002). For example, rod photoreceptor deficits have been described (Jeffery et al., 1994; Grant et al., 2001), as well as abnormalities in the cone-dominated foveal region of some albino species, including humans (Guillery et al., 1984; Jeffery and Kinsella, 1992). Electroretinography (ERG) studies also point to altered function of both the inner retina as well as RPE in the mammalian albino retina (Abadi and Pascal, 1991; Oetting and King, 1994; Oetting and King, 1994; Oetting et al., 1994; Putting et al., 1994; Vingrys and Bui, 2001; Wu et al., 2004). However, in humans, interpretation of visual function deficits found in albinos is confounded by the presence of nystagmus (Abadi and Pascal, 1991; Oetting et al., 1994).
Of the many studies involving albino animals, none has addressed refractive development. Our choice of the chick is consistent with its wide-spread use in studies of refractive development and myopia in which it has proven to be a good predictor of primate behavior. Differences in refractive error, ocular dimensions and visual function between albino and normally pigmented chicks are described. To allow interpretation of these data, we applied a variety of techniques to characterize the ocular structure and function of the albino chick.
Methods
Animals
Albino and normally pigmented (“normal”) White-Leghorn chicks were hatched at the University of California, Berkeley, from fertilized eggs (supplied by WP, Michigan State University). The albino line originated in the early 1980’s as a spontaneous mutation in ADOL line 15I5, a White-Leghorn line developed and maintained at the United States Department of Agriculture Avian Disease and Oncology Laboratory in East Lansing, MI. 15I5 albino birds were crossed with ADOL line 0. Birds with no endogenous avian retroviral genes were selected from the F2 generation. Breeding data indicate that this albino trait is autosomal recessive, the mutation involving a large deletion in, if not the complete absence of, exon 1 in the tyrosinase gene. The albino line is called autosomal albino, or aa. Normal chicks were from ADOL Line 0. Experiments investigating the mutation in this aa line are reported in this paper.
Albino and normal hatchlings were reared together under a 12 hr light/12 hr dark cycle in a temperature- and humidity-controlled environment, with food and water provided ad libitum. Because the albino hatchlings were temperature-sensitive, cages were fitted with heating blankets; because they also were photophobic, black mesh covers were used to lower the light levels (reducing light levels from ~250 lux to ~95 lux). Their apparently poor vision also required them to be hand-fed initially. The chicks underwent a battery of tests, many of them repeated at different ages, although always at the same time of day (typically in the afternoon), to obtain developmental profiles. All experiments were in compliance with the ARVO Statement for the Use of Animals in Ophthalmic and Visual Research.
Refractive error & ocular biometry measurements
Refractive errors were measured to the nearest 0.25 D in anesthetized chicks (1.5 – 2% isofluorane in oxygen), using streak retinoscopy. Measurements were made 6, 13–14, 20–21 and 27–28 days after hatching. Reported data represent the averages of results for the two principal meridians for each eye.
High frequency A-scan ultrasonography (30 mHz transducer, Panametrics, Waltham, MA; resolution 10 μm; (Schmid et al., 1996)) was used to measure axial ocular dimensions. Here also chicks were anesthetized with isofluorane. Measurements were always made on the left eye first. Chicks were usually measured every two or three days between days 4 – 27 days after hatching. Recorded parameters included the principal ocular components, i.e. anterior chamber, crystalline lens and vitreous chamber, as well as the thicknesses of the retinal, choroidal and scleral components of the posterior wall of the eye. Two axial length parameters were derived, an external axial length representing the sum of all components, and an optical axial length (OAL) representing the sum of anterior chamber depth, lens thickness and vitreous chamber depth.
Intraocular pressures (IOP) were measured using a Tonopen (Mentor) after first anesthetizing the cornea (1 drop of 0.5% proparacaine ophthalmic solution, Akorn) (Schmid et al., 2000). Three to five readings were taken for each eye and averaged, with right eyes always measured first, and the order of measurement of normal and albino chicks randomized.
Visual function tests
Optokinetic nystagmus (OKN) responses were assessed as an indicator of spatial resolution (visual acuity) (Schmid and Wildsoet, 1998). Chicks were positioned at the center of a 51 cm diameter drum rotating at 5 revolutions per minute, with the direction of rotation alternating between clockwise and counterclockwise directions (~every 180 degrees) to prevent adaptation. The OKN stimuli comprised 6 vertical, black and white stripe patterns that were used to line the drum; the spatial frequencies of the test patterns were 0.08 (widest stripe), 0.22, 0.44, 0.74, 1.86, and 2.48 cycles per degree (narrowest stripe). Tracking head turns (three to four correct responses), were taken as evidence of resolution of the presented pattern.
The effects of both age and light intensity on OKN responses were investigated. Binocular conditions were used for the age study; chicks were assessed at 13–15, 20–22, and 27–29 days after hatching. We also tested a small number of chicks under monocular conditions (2 normal and 2 albino chicks, all 29 days of age). The eye for testing (right or left) was randomly selected, with its fellow covered during testing with a detachable (Velcro-mounted) opaque white diffuser. To assess the influence of light intensity and scatter, two further groups of chicks (3 albinos and 4 normals) were tested at 14 and 24 days of age with each of 4 ND filters (in order: ND 2.0, ND 1.0, ND 0.5 and ND 0.1: 1, 10, 32 & 80% transmission respectively) covering the tested eye, and a black opaque occluder over the fellow eye to prevent light reaching the tested eye via the former. Chicks were initially dark adapted for 2–3 hr.
Electroretinography was included because of reports of altered ERG recordings in other albino species (Putting et al., 1994; Vingrys and Bui, 2001; Wu et al., 2004). ERGs were recorded between 21–23 days after hatching (between 11:30 am and 5 pm; n = 7 normal and 6 albino). Because chicks are reported to have a rod-cone switch that would preclude recording from rods during the day (Schaeffel et al., 1991), additional nighttime recordings (between 10 pm and 12:30 am; n = 3 normal and 3 albino), were obtained from a batch of chicks of the same age as well as a slightly older batch (29 days of age; n = 2 normal and 1 albino).
ERG recordings made use of an Espion small animal unit (Diagnosys LLC, Massachusetts). Stimuli comprised 4 ms long light flashes, separated by 20 s dark intervals; a uniform field of white light was presented to each eye via 2 small Ganzfeld stimulators (50 mm internal diameter, Diagnosys ColorBurst), positioned 5 cm in front of each eye. Stimulus intensity was incremented in half-log steps, up to a maximum of 31.62 cd m−2. For these recordings, chicks were anesthetized (i.m. injection of ketamine/xylazine mixture: 40 mg kg−1 & 8 mg kg−1, normals; 40–53.3 & 5.3–8 mg kg−1, albinos) and had their pupils dilated (0.5% proparacaine ophthalmic solution, 1 drop, followed by vercuronium bromide, 5 mg ml−1 in 1% methylcellulose solution, 1 drop every 2 minutes over 10 minutes). Their heads were stabilized in a custom-designed holder with lid retractors in place to hold their eyes open, and Ag–AgCl2 recording loop electrodes in contact with their corneas; a reference electrode was placed under the skin at the back of the head. A heating blanket maintained body temperature at ~39 °C. After the completion of the set-up, 10 minutes of dark adaptation was allowed before the start of daytime recordings.
ERG responses represent the averages of five trials. The amplitudes and implicit times for the a- and b-wave components are reported. A-wave amplitude was taken as the absolute voltage change corresponding to the first negative deflection and a-wave implicit time was measured as the time between the onset of the light stimulus and the peak a-wave voltage. The first positively deflected voltage peak following the a-wave represents the b-wave. B-wave amplitude was taken as the absolute value of the voltage difference between the a- and b-wave peaks and b-wave implicit time was measured as the time between stimulus onset and the peak b-wave voltage.
Electron microscopy
Retinal tissue samples from 30 day-old chicks were examined using electron microscopy. Tissue was fixed in 2.5% glutaraldehyde in Hank’s Modified Salt Solution, pH 7.4, (≥24 hrs, 4 °C), rinsed in 0.1 M cacodylate buffer (pH 7.4, RT). Tissue was then post-fixed in 1% osmium tetroxide in cacodylate buffer (pH 7.4, 4 °C), before being dehydrated in a series of ethanol solutions, then infilitrated and embedded in araldite resin. Ultrathin sections were stained with lead citrate and imaged using a FEI Tecnai 12 transmission electron microscope (120KV).
Gene microarray PCR, and tyrosinase assays
Gene expression profiles in RPE tissue isolated from the eyes of three albino and three normal young adult chickens (~3 months) were analyzed using Affymetrix prefabricated chicken genome microarray chips. Total RNA was extracted using a Trizol method (Invitrogen; (Baelde et al., 2001), with quality confirmation. Then cDNA was synthesized (Superscript II Reverse Transcriptase, Invitrogen) and used as a template in preparing biotin-labeled cRNA. Finally, fragmented cRNA was hybridized onto microarray chips, which were then scanned (technical support from UC Berkeley Functional Genomics Laboratory), and analyzed statistically (Gene Sifter Software, VixX Labs).
Based on the report of a 6 bp nucleotide deletion on exon 1 of the tyrosinase gene for an autosomal albino chicken line derived from the same ADOL line (Tobita-Teramoto et al., 2000), a comparative PCR experiment was conducted. Specfically, RPE tissue was isolated from the eyes of 2 albino and 2 normal chickens (~3 months) and DNA extracted using a DNeasy kit (Qiagen). A pair of primers, CAGTCCCAGTAGGGGATG and CCCCAGCAAGGACTATGTAA, was designed to produce a product spanning the 6 bp deletion, shown in bold (GenBank, NM_204160, see Figure 3). PCR involved 40 cycles of a three-step process (denaturation at 94 ºC, annealing at 50 ºC, and extension at 72 ºC, for one minute each).
Tyrosinase activity also was examined using the bulbs of tail feathers from 3 albino and 3 normal chickens (~3 months). The assay method was a modification of that of Ando et al. (Ando et al., 1999). Briefly, 5 mm segments were put into 1.5 ml centrifuge tubes on dry ice. Immediately, 100 μl of 0.1 M phosphate buffer (pH 6.8) containing protease inhibitors was added into each tube and the fluid in the bulb squeezed out in a manual homogenization step involving 10 strokes and disposable plastic pestles. The tubes containing the homogenate were then briefly centrifuged at 10000 rpm for one minute and the supernatant collected for subsequent enzymatic reactions. The assay was performed at 25°C in a Biorad SmartSpec 3000 spectrophotometer. Twenty μl of the supernatant was added to 980 μl of 0.1% L-DOPA (Sigma) in 0.1 M phosphate buffer and the amount of product, DOPAchrome and total protein analyzed spectrophotometrically, at 475 and 280 nm respectively. Purified mushroom tyrosinase (Sigma) was used to obtain a standard calibration curve (R2 = 0.99), the optical density reading of each reacted sample being compared against the standard curve. Differences between baseline readings and repeated measurements at the end of a reaction time of 10 minutes are presented. Results are expressed in μU/mg of total protein.
Statistical Analysis
All data are reported as mean (± SD) unless otherwise specified. Where there was a discrepancy of a day between the timing of measurements for individual birds, these data were binned for analysis, and where the same bird was measured on two consecutive days, the average of these data was used. Statistical analyses used Statview (Abacus Concepts). Data from albino and normal chicks were compared using repeated measures analysis of variance (ANOVA), unless otherwise indicated. A p-value of less than 0.05 is considered statistically significant unless otherwise indicated.
Results
Our albino chicks showed all the gross morphological features of complete albinism. Both their skin and feathers, as well as their eyes, lacked melanin pigment. Thus their irides were salmon pink in color and their eyes transilluminated (Fig. 1A). Light was able to pass from one eye to the other (Fig. 1B), reflecting both their lateral placement and close spacing, being separated by only a thin cartilaginous plate comprising the medial orbital wall. Choroidal blood vessels, which are only faintly visible in normally pigmented eyes, were clearly visible in albino eyes (Fig. 1C), reflecting the lack of melanin in the retinal pigment epithelium and choroid. For the same reason, the enucleated albino eyes have a pink color (Fig. 1D), compared to the bluish grey color of normal eyes.
Figure 1.
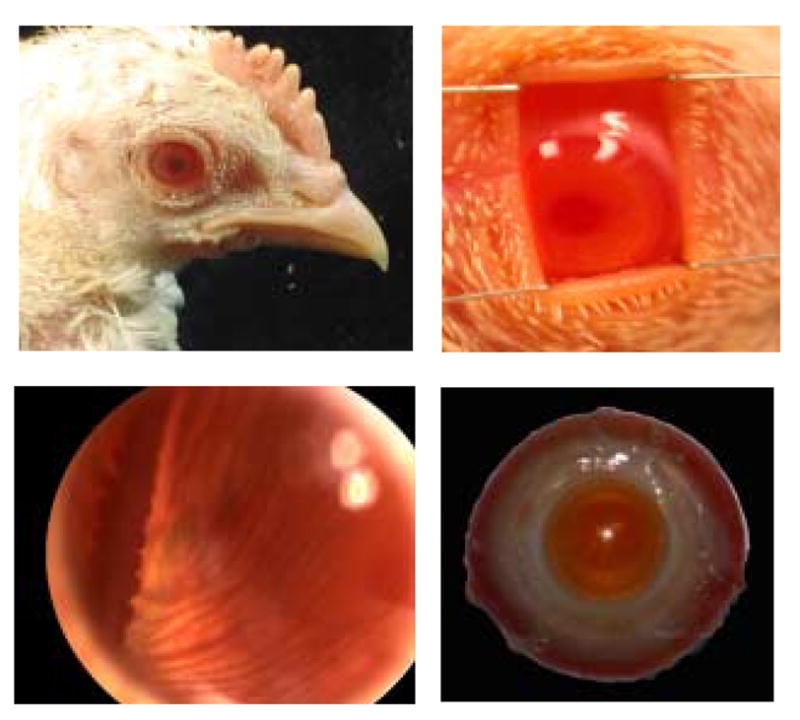
The albino chick eye contains no melanin. This is reflected in their iris color, which is salmon pink instead of the usual green to brown (top left), interocular transillumination as evidenced by the light exiting the pupil of the nonstimulated eye (penlight used to flood the pupil of the other eye) (top right), the increased transparency of their retina, which allows the underlying choroidal vessels to be seen, and the color of their pecten, which is dark red instead of black (bottom left), and pink coloration of the enucleated eye (bottom right).
Like albino humans, the albino chicks were very photophobic and the hatchlings tended to close their eyes under normal room light levels. The latter behavior decreased with age, suggesting a decrease in photophobia, although the underlying mechanism is not known. The behavior of the albino chicks also implied poor vision; specifically, the albino hatchlings tended to bump into objects in their cage more than their pigmented counterpart and they made numerous pecking errors, both in a lateral direction and in depth. However, the albino chicks did not exhibit nystagmus, a consistent feature of human albinism. (Abadi and Pascal, 1991; Oetting et al., 1994).
Electron microscopy
Electron micrographs show numerous melanosomes in the RPE of normal chicks (Fig. 2, left). In contrast, melanosomes were not noticeable in the RPE of albino chicks (Fig. 2, right).
Figure 2.
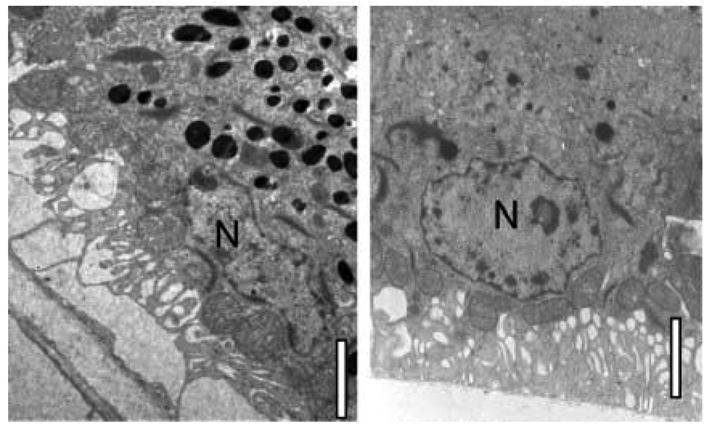
Electron micrographs of RPE layer from normally pigmented (left) and albino (right) chicks, sacrificed 30 days after hatching. Note the numerous melanosomes in the normally-pigmented RPE cell. Scale bars are 2.3 μM (left) and 2 μM (right); N= nucleus.
PCR, gene microarray and tyrosinase assays
The agarose gel prepared from our PCR experiment (Fig. 3A), shows a strong band corresponding to 281 bp covered by the primers for the normal chicks; this band was not present for the albino chicks. Our Affymetrix microarray experiment revealed a 9.7-fold difference in tyrosinase expression between normal and albino RPE, being negligible in the latter tissue (Fig. 3C). Finally, the feather bulbs showed a 3.5-fold difference in tyrosinase activity, implying that the defect was not limited to the eyes as in human ocular albinism.
Figure 3.

A. A pair of primers (forward: CCCAGCAAGGACTATGTAA, reverse: CAGTCCCAGTAGGGGATG) for a product spanning across a 6 bp nucleotides deletion within the 819 bp exon 1 of tyrosinase gene. The nucleotide numbers described in the diagram are based on the nucleotide sequence of GenBank gene accession number NM204160. B. 1.2% agarose gel resolving PCR products from two albino and two normally pigmented chicken eyes. Samples from albino chicks (lanes 2 & 3) lack the 281 bp band seen in normal chicks (lanes 4 & 5), due to the 6 bp nucleotide deletion prevents annealing primer onto the template strand. C. Results of a gene microarray assay (Affymetrix) of RPE tissue from three albino and three normal chicks. A strong expression of the tyrosinase gene in the normal RPE contrasts with the negligible expression in the albino RPE (9.7 fold difference). D. A tyrosinase assay using the bulbs of tail feathers indicates very low tyrosinase activity in the albino compared to normal chicks (3.5 fold difference).
Eye growth & refractive error
During early development, chicks, like other young animals, typically show rapid ocular enlargement and a parallel decrease in refractive errors. We were interested in whether the latter emmetropization process was altered in the albino chicks and whether the hatchlings showed any eye shape abnormalities that would imply direct genetic (i.e. non-visual) influences.
With respect to axial ocular dimensions, both normal and albino chicks showed axial increases over time in all 3 of the main ocular components – anterior chamber, crystalline lens and vitreous chamber. However, the anterior chambers of albino chicks were consistently shallower than those of normal chicks, while their vitreous chambers were longer. The effect of this differential growth on ocular shape is illustrated in two different ways in Figure 4, in which both anterior chamber (AC) and vitreous chamber (VC) depth parameters are expressed as ratios of optical axial length (OAL) and plotted as functions of age. The former ratio (AC/OAL) is significantly smaller for albino compared to normal eyes, and the latter (VC/OAL), significantly larger, at all ages. Both left and right eyes showed similar trends although ANOVA revealed isolated yet statistically significant interocular differences for both normal and albino chicks, presumably a measurement order effect (left eyes always measured first). Thus data for right and left eyes were not pooled for statistical analyses. Sample data for left eyes of albino and normal chicks and three time points during the monitoring period are given in Table 1. Differences between the left eyes of the two groups attained statistical significance 6–7, 8–9, 10–11, 15–16 and 17–18 days after hatching for anterior chamber depth and 4–5, 6–7, and 8–9 days after hatching for vitreous chamber depth. No statistical significant differences in lens thickness and OAL were observed.
Figure 4.

Anterior and vitreous chamber depths expressed as ratios of optical axial length (AC/OAL (A) and VC/OAL (B), respectively) for left and right eyes of albino and normal chicks.
* indicates ages for which there is a significant difference between albino and normal animals (ANOVA, p<0.05).
Table 1.
Representative biometric data for the left eyes of albino and normally pigmented chicks. Data represent means ± standard deviation; number of eyes for each group shown in brackets, albinos and normals respectively. External axial length derived as sum of all components, including the thicknesses of the retina, choroid and sclera. Albino chicks tended to have shallower anterior chambers and deeper vitreous chambers than normal chicks.
| Age (days post hatch) | Anterior chamber depth (mm) | Axial lens thickness (mm) | Vitreous chamber depth (mm) | External axial length (mm) | ||||
|---|---|---|---|---|---|---|---|---|
| Albinos | Normals | Albinos | Normals | Albinos | Normals | Albinos | Normals | |
| 4 – 5 (n=5, 8) | 1.177±0.06 | 1.227±0.031 | 1.765±0.086 | 1.790±0.055 | 5.403±0.072* | 5.113±0.063 | 8.748±0.197 | 8.608±0.084 |
| 15 – 16 (n=5, 7) | 1.182±0.123* | 1.440±0.073 | 2.285±0.067 | 2.263±0.136 | 5.636±0.376 | 5.542±0.112 | 9.594±0.346 | 9.801±0.171 |
| 27 (n=4, 5) | 1.631±0.105 | 1.727±0.056 | 2.449±0.029 | 2.551±0.042 | 6.680±0.484 | 6.198±0.142 | 11.308±0.560 | 11.028±0.211 |
significant difference between albino & normals, p<0.05; note that statistically significant differences were recorded at additional time points for both anterior and vitreous chambers.
Of the components making up the posterior wall of the eye, retinal thickness changes were negligible over the monitoring period for both albino and normal chicks while both the choroid and sclera increased in thickness. Sample data for mean retinal thickness for albino and normal chicks are respectively 226 ± 9 and 233 ± 8 μm (4–5 days after hatching), and 220 ± 29 and 230 ± 15 μm (21 days after hatching). Equivalent values for choroidal thickness are 110 ± 46 and 162 ± 26 μm (4–5 days after hatching), and 192 ± 26 and 213 ± 24 μm (21 days after hatching), and for scleral thickness, 81 ± 5 and 82 ± 11 μm (4–5 days after hatching) and 102 ± 15 and 109 ± 26 μm (21 days after hatching).
Despite the ocular shape abnormalities found in the albino chicks, intraocular pressure (IOP) was normal. Average values for 4 weeks-old albino and normal chicks were 7.5 ± 1.0 and 7.2 ± 1.3 mm Hg respectively.
Both the normal and albino chicks showed evidence of emmetropization; their refractive error decreased over time although the decrease was larger and more consistent in normal chicks than in albino chicks. Albino chicks exhibited myopia at all time points, instead of hyperopia like the normal chicks, and had higher than normal astigmatism (mostly against-the-rule) early in development. These trends are evident in the data summarized in Table 2; left and right eye data were averaged for intergroup comparisons here because there were no statistically significant differences between left and right eyes for either normal or albino chicks.
Table 2.
Refractive error data recorded from albino and normal chicks, from 6–28 days post hatch. Data for right and left eyes of individual chicks averaged; group means ± standard deviations presented; number of eyes for each group shown in brackets, albinos and normals respectively. Albino chicks were generally myopic while normal chicks were hyperopic, and albinos tended to have higher astigmatism.
| Age (days post hatch) | Spherical Equivalent Refractive Error (D) | Astigmatism (Horiz-Vert; D) | ||
|---|---|---|---|---|
| Albinos | Normals | Albinos | Normals | |
| 6 (n=4, 7) | −1.9 ±0.7* | 5.1 ±2.3 | −2.1 ±1.3* | 0.9 ±1.7 |
| 13 – 14 (n=8, 12) | −5.5 ±1.9* | 0.9 ±2.5 | 2.4 ±2.7* | 1.0 ±1.3 |
| 20 – 21 (n=10, 14) | −3.9 ±2.8* | 0.5 ±1.3 | 1.4 ±4.6 | 1.1 ±2.1 |
| 27 – 28 (n=8, 14) | −2.6 ±1* | 0.5 ±0.7 | 2.3 ±1.9 | 1.3 ±1.3 |
significant difference between albinos & normals; p<0.05.
Functional tests
Visual acuity
The behavior of the albino chicks suggested significant visual impairment and the results of OKN testing, summarized in Table 3, are consistent with this interpretation. Most of the normal chicks responded to the finest of the grating stimuli (2.48 cycles per degree) at all ages; there were only four cases in which OKN responses were not elicited with this grating, all involving older chicks (22–29 days after hatching), which were more excitable and thus more difficult to measure. On the other hand, the albino chicks did not respond to either of the two highest spatial frequencies under binocular conditions, and visual acuity did not improve over time (mean: 0.74 cycles per degree), ruling out a developmental delay in maturation of the retina as an explanation for this deficit.
Table 3.
Binocular visual acuities assessed as the highest spatial frequency eliciting an optokinetic nystagmus (OKN) response. Data are presented as mean ± standard deviations. Note the visual acuity of the normal chicks is likely to be higher than represented here, because most chicks resolved the finest grating used on testing at all ages.
| Age (days post hatch) | Visual acuity (cycles per degree) | |
|---|---|---|
| Albinos | Normals | |
| 13 – 15 | 0.74 ±0* (n=4) | 2.48 ±0 (n=7) |
| 20 – 22 | 0.74 ±0* (n=4) | 2.44 ±0.11 (n=7) |
| 27 – 29 | 0.74 ±0* (n=4) | 1.98 ±0.68 (n=6) |
significant difference between albinos & normals; p<0.05.
Neither switching from binocular to monocular testing nor reducing the amount of light reaching the retina using ND filters (ND 0.1 to 2.0) had much effect on the OKN responses of the albino chicks. While one of the two albino chicks tested under monocular conditions performed worse than under binocular conditions, the difference was small (response at 0.44 versus 0.74 cycles degree−1), and there was no difference between monocular and binocular acuities for the normal chicks. Only one of three albino chicks tested with ND filters 24 days after hatching showed any OKN response and only with the two lightest filters (0.5, 0.1 ND). At the same age, none of the normal chicks responded to the two finest grating patterns (1.86, 2.48 cycles degree−1) with the 2 ND filter and with the 1 ND filter, only two of four chicks responded to the 1.86 cycles degree−1 pattern and none responded to the 2.48 cycles degree−1 pattern. However, all but one of these chicks responded to the high frequency patterns with the two lighter filters (0.5, 0.1ND). Data collected at other ages show similar trends for both groups.
ERG recordings
Sample daytime ERG waveforms recorded from a normal and an albino chick are shown in Figure 5. While the waveforms recorded from both groups were similar in shape, there also were significant differences as described below. Responses recorded under night-time conditions tended to be smaller and slower than those recorded during the day for both groups.
Figure 5.

Typical daytime ERG recordings from normal (A) and albino (B) 22 day-old chicks. Flash intensity was 3.16 cd m−2 in each case.
The albino chicks showed increased light sensitivity. Specifically, for daytime recordings, albino chicks responded to flashes below the cut-off threshold of 0.316 cd m−2 for normal chicks (data not shown), and for stimulus intensities at or above 0.316 cd m−2, albino chicks showed significantly larger a- and b-waves than normal chicks. The larger waveforms also had steeper slopes, contributing to differences in implicit times, which were typically shorter for albino compared to normal chicks (Fig. 6A). For both groups, a- and b-wave amplitudes derived from nighttime recordings were smaller and their implicit times were longer than equivalent daytime values. Again, albino chicks generally showed larger a- and b-waves compared to normal chicks (Fig. 6B). They also showed significantly shorter b-wave implicit times for most stimulus intensities, although there were no intergroup differences in a-wave implicit times for these nighttime recordings.
Figure 6.

Amplitude and implicit times derived for a- and b-wave components of daytime (A) and nighttime (B) ERG recordings. * indicates intensities for which there is a significant difference between albino and normal chicks (ANOVA, p<0.05).
Discussion
In humans, albinism has been linked to abnormal refractive errors, with studies reporting both high hyperopia and high myopia (Nathanson, 1985; Abadi and Pascal, 1991; Perez-Carpinell et al., 1992; Wildsoet et al., 2000; Anderson et al., 2004). The current study aimed to understand the origin of these refractive errors, using the albino chick as an animal model. Like albino humans, the albino chicks exhibited decreased visual acuity and abnormal refractive errors, including higher than normal astigmatism. Additionally, their eyes had significantly shallower anterior chambers and longer vitreous chambers than their normally pigmented counterparts. We were able to confirm that the albino chicks carried a genetic mutation that limited expression of the tyrosinase gene and thus tyrosinase activity. We propose both genetic and visual contributions to observed ocular abnormalities. We also consider possible mechanisms for altered eye growth of albino eyes related to the lack of ocular melanin.
Reduced visual acuity & albinism
Our deduction from behavioral observations that the albino chicks had significantly reduced visual acuity is consistent with results of OKN testing. We are able to rule out myopia and poor accommodation as possible explanations for poor performance in OKN testing. To be in perfect focus, the stimulus drum required accommodation and/or myopia of approximately 4 D (OKN drum diameter 51 cm). Myopia reached a maximum around the age of the first measurements, i.e. -5.5 D at 13–14 days of age, and thus residual focusing errors would have been always small, even without accommodation (less than 2 D) and within the depth of focus of the albino eye, which is likely to be larger than that of normal chicks (around 1D, (Schmid and Wildsoet, 1997)), because of optical and retinal factors.
The deficit in OKN acuity in the albino chicks was evident under the binocular as well as monocular conditions, contrasting with the requirement of monocular conditions to reveal altered OKN responses in a delayed amelanotic strain (DAM) of chick (Komenda and Fite, 1983). Because binocular conditions prevail in the cage environment, this finding for the albino chicks has potential implications for emmetropization, which are discussed further below.
Nystagmus & albinism
Nystagmus was not observed in our albino chicks and thus can be ruled out as an underlying cause of the above reduction in visual acuity. Nystagmus is a common feature of human albinism, linked to the misrouting of optic nerve fibers, with increased numbers crossing the chiasm (Creel et al., 1978; Jay and Carroll, 1980). Because complete decussation of fibers at the chiasm is normal in the chick (Cowan et al., 1961), similar misrouting abnormalities are unlikely and thus the absence of nystagmus in albino chicks, predictable.
Albinism & emmetropization
To address the possibility that the mutation underlying the lack of ocular melanin is directly responsible for the refractive abnormalities, one must compare data collected soon after hatching from albino and normal chicks, so as to minimize the influence of visual experience. However, because of the very fragile nature of the albino chicks, measurements were not feasible until the chicks were about 4–5 days old. At this age the albino chicks were slightly myopic, with greater than normal astigmatism, while the normal chicks exhibited hyperopia, as expected. These early myopic refractive errors may be congenital, linked to the underlying mutation, a similar link between myopia and tyrosine negative albinism having been made in humans (Kasmann and Ruprecht, 1996). However, we cannot rule out a visual origin to these early changes in our chicks due to their precocial nature.
The developmental data provide conclusive evidence that emmetropization was impaired in our albino chicks. Specifically, they remained myopic at around one month of age, by which time the normal chicks had undergone significant emmetropization, exhibiting only small residual hyperopic refractive errors. Why might emmetropization be impaired in albinism? Three plausible explanations are considered below: 1. retinal image degradation resulting from the increased intraocular light scatter in albino eyes, 2. retinal functional abnormalities, and 3. altered signaling between the retina and choroid/sclera due to the lack of melanin in the retinal pigment epithelium and an associated functional abnormality.
Myopia is the predicted response to retinal image degradation, not only in albino animals, but in young eyes generally (Smith, 1999) However while such conditions are typically imposed experimentally, significant retinal image degradation occurs naturally in the albino chicks, due to increased intraocular light scatter and increased optical aberrations in their eyes (Tian et al., 2007). (Note that while dim light rearing conditions have been previously linked to increased eye enlargement (e.g., Chiu et al., 1975) they cannot explain the longer vitreous chambers in the albino compared to normal chicks, because all chicks were reared under the same low light levels.)
Do the albino chicks have a retinal functional abnormality? It is possible that increased light scatter caused by lack of light-absorbing melanin in albino chicks could contribute to their reduced visual acuity. In their eyes, light was able to pass through the anterior ocular structures surrounding the pupil to reach the photoreceptors (Wack et al., 1989), and we also demonstrated light leakage from one eye to the other across the interorbital septum with binocular ERG recordings (in albino but not normally pigmented chicks, covering one eye with an opaque black occluder to prevent stray light reaching the tested eye significantly reduced the amplitude of ERG response of the other eye; data not shown). However, performance on visual acuity tests did not improve when the albino chicks wore a similar black occluder over one eye, and light levels reaching the retina of the uncovered eye were reduced with ND filters. This suggests that factors other than light scatter are responsible for the poor visual acuity of the albino chicks, for example, abnormalities in photoreceptor function or retinal circuitry.
There are reports of reduced photoreceptor numbers in albinos of other species (Guillery et al., 1984; Jeffery et al., 1994; Putting et al., 1994; Grant et al., 2001; Rachel et al., 2002), although such abnormalities were not observed in albino birds (albino quails, (Takatsuji et al., 1984; Weidner et al., 1988; Jeffery and Williams, 1994). The ERG results for the albino chicks also argue against any significant deficit in photoreceptor function; they generally outperformed the normal chicks under both day- and night-time recording conditions. Nonetheless, in these recordings increased light levels reaching the photoreceptors of albino compared to normal eyes could have obscured any subtle photoreceptor deficit or retinal circuitry abnormality. The latter possibility is consistent with observed differences in immunohistochemical labeling for calretinin in the retinas of albino compared to normally pigmented chicks have been observed (A. Fisher, University of Ohio; unpublished data).
The albino chicks showed negligible tryosinase activity. This deficiency is likely to have functional implications for the RPE and thus for eye growth regulation. The RPE is assumed to play a key role in eye growth regulation, as it connects the retina, the presumed source of the growth modulatory signals, with its targets, the choroid and sclera (Rymer and Wildsoet, 2005). For example, the consequent lack of melanin may affect either or both the ionic balance between RPE cells and surrounding tissues and transcellular fluid transport because melanin binds Ca2+ and Mg2+, and melanin granules serve as an important intracellular reservoir for Ca2+ (Drager, 1985; Salceda and Sanchez-Chavez, 2000). In the current study, the thinner than normal choroids in albino eyes could indicate such an effect on fluid transport and/or altered signaling across the RPE. While RPE function has not been specifically studied for any albino species, there is a report of impaired RPE function, specifically a loss of phagocytic ability, in an amelanotic line of chickens that loses ocular pigmentation during early development (Lahiri and Bailey, 1993).
Another predicted consequence of the lack of tyrosinase in the RPE of albino eyes, with potential implications for ocular growth, is a reduction in, or absence of, DOPA synthesis. Evidence linking retinal abnormalities in albinism with a DOPA deficiency also is provided with the demonstration that experimental restoration of DOPA but not melanin levels in the RPE of albino mice prevents retinal and visual function abnormalities (Lavado et al., 2006). Altered ocular growth is a likely consequence of such retinal abnormalities. Altered DOPA levels also may be directly implicated in the altered eye growth patterns observed in albino eyes, given both the antimitogenic properties of DOPA (Akeo et al., 1989) and evidence linking dopamine (DOPA is its immediate precursor) and eye growth regulation (e.g. Stone et al., 1989). In the latter study, inhibition of light-induced increases in retinal dopamine and its metabolite, DOPAC, was linked to form deprivation myopia. Interestingly, changes in retinal dopamine are a common finding across four studies describing similar ocular shape abnormalities to those observed in the albino chicks – enlarged vitreous chambers and reduced anterior chamber depths – involving rge-rge chicks (Montiani-Ferreira et al., 2005), chicks reared in continuous light (Bartmann et al., 1994) and chicks injected intravitreally with either colchicine (Fischer et al, 1999; Choh et al., 2005) or kainic acid (Wildsoet & Pettigrew, 1989). Retinal dopamine levels and turnover are decreased by continuous light rearing, and in both colchicine-treated eyes, and the eyes of rge-rge chicks, the numbers of presumed dopaminergic (tyrosine hydroxylase-positive) retinal neurons are reduced. An on-going study of retinal dopamine turnover in albino chicks will provide further insight into the link between DOPA, dopamine and eye growth.
Increased astigmatism & albinism
The absence of nystagmus in our albino chicks is of interest in the context of refractive development in albino eyes. Note that our albino chicks showed increased astigmatism, just like human albinos (e.g. Wildsoet et al., 2000), although initially against-the-rule (ATR) rather than with-the-rule as in humans. Because high astigmatism has also been observed in cases of idiopathic nystagmus in humans, a causal link between the two has been assumed. However, the current observation in albino chicks questions this interpretation. Instead, we propose that increased astigmatism may occur as a secondary effect of altered anterior segment development, based on the association between shallower than normal anterior chambers and higher than normal ATR astigmatism in our albino chicks and similar results in chicks reared in continuous light (Schmid and Wildsoet, 1997).
Conclusion
Functional abnormalities in the RPE/retina, as well as retinal image degradation, likely contribute to the eye shape abnormalities and impaired emmetropization observed in our albino chicks. The findings of refractive error and eye shape abnormalities in very young albino chicks suggest additional genetic influences. This study in chick suggests directions for future investigations into the origin of their abnormal refractive errors in human albinos.
Footnotes
Publisher's Disclaimer: This is a PDF file of an unedited manuscript that has been accepted for publication. As a service to our customers we are providing this early version of the manuscript. The manuscript will undergo copyediting, typesetting, and review of the resulting proof before it is published in its final citable form. Please note that during the production process errors may be discovered which could affect the content, and all legal disclaimers that apply to the journal pertain.
Contributor Information
Jodi Rymer, University of California-Berkeley, USA.
Vivian Choh, University of Waterloo, Canada.
Shrikant Bharadwaj, Indiana University-Bloomington, USA.
Varuna Padmanabhan, University of California-Berkeley, USA.
Laura Modilevsky, University of California-Berkeley, USA.
Elizabeth Jovanovich, University of California-Berkeley, USA.
Brenda Yeh, University of California-Berkeley, USA.
Zhan Zhang, University of California-Berkeley, USA.
Huanxian Guan, University of California-Berkeley, USA.
W Payne, Michigan State University, USA.
Christine F Wildsoet, University of California-Berkeley, USA.
References
- Abadi RV, Pascal E. Visual resolution limits in human albinism. Vision Res. 1991;31:1445–1447. doi: 10.1016/0042-6989(91)90063-b. [DOI] [PubMed] [Google Scholar]
- Akeo K, Ebenstein DB, Dorey CK. Dopa and oxygen inhibit proliferation of retinal pigment epithelial cells, fibroblasts and endothelial cells in vitro. Exp Eye Res. 1989;49:335–346. doi: 10.1016/0014-4835(89)90044-4. [DOI] [PubMed] [Google Scholar]
- Anderson J, Lavoie J, Merrill K, King RA, Summers CG. Efficacy of spectacles in persons with albinism. J Aapos. 2004;8:515–520. doi: 10.1016/j.jaapos.2004.08.008. [DOI] [PubMed] [Google Scholar]
- Ando H, Funasaka Y, Oka M, Ohashi A, Furumura M, Matsunaga J, Matsunaga N, Hearing VJ, Ichihashi M. Possible involvement of proteolytic degradation of tyrosinase in the regulatory effect of fatty acids on melanogenesis. J Lipid Res. 1999;40:1312–1316. [PubMed] [Google Scholar]
- Baelde HJ, Cleton-Jansen AM, van Beerendonk H, Namba M, Bovee JV, Hogendoorn PC. High quality RNA isolation from tumors with low cellularity and high extracellular matrix component for cDNA microarrays: application to chondrosarcoma. J Clin Pathol. 2001;54:778–782. doi: 10.1136/jcp.54.10.778. [DOI] [PMC free article] [PubMed] [Google Scholar]
- Bartmann M, Schaeffel F, Hagel G, Zrenner E. Constant light affects retinal dopamine levels and blocks deprivation myopia but not lens-induced refractive errors in chickens. Vis Neurosci. 1994;11:199–208. doi: 10.1017/s0952523800001565. [DOI] [PubMed] [Google Scholar]
- Choh V, Padmanabhan V, Kuo K, Ni J, Wildsoet CF. Colchicine Attenuates the Minus Lens but Not Plus Lens Compensation in Chick. Invest Ophthalmol Vis Sci. 2005;46 E-Abstract 1989. [Google Scholar]
- Cowan WM, Adamson L, Powell TP. An experimental study of the avian visual system. J Anat. 1961;95:545–563. [PMC free article] [PubMed] [Google Scholar]
- Creel D, O'Donnell FE, Jr, Witkop CJ., Jr Visual system anomalies in human ocular albinos. Science. 1978;201:931–933. doi: 10.1126/science.684419. [DOI] [PubMed] [Google Scholar]
- Drager UC. Calcium binding in pigmented and albino eyes. Proc Natl Acad Sci USA. 1985;82:6716–6720. doi: 10.1073/pnas.82.19.6716. [DOI] [PMC free article] [PubMed] [Google Scholar]
- Grant S, Patel NN, Philp AR, Grey CN, Lucas RD, Foster RG, Bowmaker JK, Jeffery G. Rod photopigment deficits in albinos are specific to mammals and arise during retinal development. Vis Neurosci. 2001;18:245–251. doi: 10.1017/s095252380118209x. [DOI] [PubMed] [Google Scholar]
- Guillery RW, Hickey TL, Kaas JH, Felleman DJ, Debruyn EJ, Sparks DL. Abnormal central visual pathways in the brain of an albino green monkey (Cercopithecus aethiops) J Comp Neurol. 1984;226:165–183. doi: 10.1002/cne.902260203. [DOI] [PubMed] [Google Scholar]
- Jay B, Carroll W. Albinism. Recent advances. Trans Ophthalmol Soc U K. 1980;100:467–471. [PubMed] [Google Scholar]
- Jeffery G. The albino retina: an abnormality that provides insight into normal retinal development. Trends Neurosci. 1997;20:165–169. doi: 10.1016/s0166-2236(96)10080-1. [DOI] [PubMed] [Google Scholar]
- Jeffery G. The retinal pigment epithelium as a developmental regulator of the neural retina. Eye. 1998;12(Pt 3b):499–503. doi: 10.1038/eye.1998.137. [DOI] [PubMed] [Google Scholar]
- Jeffery G, Darling K, Whitmore A. Melanin and the regulation of mammalian photoreceptor topography. Eur J Neurosci. 1994;6:657–667. doi: 10.1111/j.1460-9568.1994.tb00311.x. [DOI] [PubMed] [Google Scholar]
- Jeffery G, Kinsella B. Translaminar deficits in the retinae of albinos. J Comp Neurol. 1992;326:637–644. doi: 10.1002/cne.903260410. [DOI] [PubMed] [Google Scholar]
- Jeffery G, Williams A. Is abnormal retinal development in albinism only a mammalian problem? Normality of a hypopigmented avian retina. Exp Brain Res. 1994;100:47–57. doi: 10.1007/BF00227278. [DOI] [PubMed] [Google Scholar]
- Kasmann B, Ruprecht KW. Might the refractive state in oculocutaneous albino patients be a clue for distinguishing between tyrosinase-positive and tyrosinase-negative forms of oculocutaneous albinism? Ger J Ophthalmol. 1996;5:422–427. [PubMed] [Google Scholar]
- Komenda JK, Fite KV. Optokinetic nystagmus in progressive retinal degeneration. Behav Neurosci. 1983;97:928–936. doi: 10.1037//0735-7044.97.6.928. [DOI] [PubMed] [Google Scholar]
- Lahiri D, Bailey CF. A comparison of phagocytosis by the retinal pigment epithelium in normal and delayed amelanotic chickens. Exp Eye Res. 1993;56:625–634. doi: 10.1006/exer.1993.1080. [DOI] [PubMed] [Google Scholar]
- Lavado A, Jeffery G, Tovar V, de la Villa P, Montoliu L. Ectopic expression of tyrosine hydroxylase in the pigmented epithelium rescues the retinal abnormalities and visual function common in albinos in the absence of melanin. J Neurochem. 2006;96:1201–1211. doi: 10.1111/j.1471-4159.2006.03657.x. [DOI] [PubMed] [Google Scholar]
- McHam ML, Fulton A. Albinism. Int Ophthalmol Clin. 1992;32:185–200. doi: 10.1097/00004397-199203210-00015. [DOI] [PubMed] [Google Scholar]
- Montiani-Ferreira F, Fischer A, Cernuda-Cernuda R, Kiupel M, DeGrip W, Sherry D, Cho S, Shaw G, Evans M, Hocking P, Petersen-Jones S. Detailed histopathologic charachterization of the retinopathy, globe enlarged (rge) chick phenotype. Molecular Vision. 2005;11:11–27. [PubMed] [Google Scholar]
- Nathanson JA. Biochemical and physiological effects of S-32–468, a beta-adrenoceptor antagonist with possible oculoselectivity. Curr Eye Res. 1985;4:191–197. doi: 10.3109/02713688509000850. [DOI] [PubMed] [Google Scholar]
- Oetting WS, King RA. Analysis of tyrosinase mutations associated with tyrosinase-related oculocutaneous albinism (OCA1) Pigment Cell Res. 1994;7:285–290. doi: 10.1111/j.1600-0749.1994.tb00629.x. [DOI] [PubMed] [Google Scholar]
- Oetting WS, King RA. Molecular basis of oculocutaneous albinism. J Invest Dermatol. 1994;103:131S–136S. doi: 10.1111/1523-1747.ep12399447. [DOI] [PubMed] [Google Scholar]
- Oetting WS, Summers CG, King RA. Albinism and the associated ocular defects. Metab Pediatr Syst Ophthalmol. 1994;17:5–9. [PubMed] [Google Scholar]
- Perez-Carpinell J, Capilla P, Illueca C, Morales J. Vision defects in albinism. Optom Vis Sci. 1992;69:623–628. doi: 10.1097/00006324-199208000-00005. [DOI] [PubMed] [Google Scholar]
- Putting BJ, Van Best JA, Vrensen GF, Oosterhuis JA. Blue-light-induced dysfunction of the blood-retinal barrier at the pigment epithelium in albino versus pigmented rabbits. Exp Eye Res. 1994;58:31–40. doi: 10.1006/exer.1994.1192. [DOI] [PubMed] [Google Scholar]
- Rachel RA, Dolen G, Hayes NL, Lu A, Erskine L, Nowakowski RS, Mason CA. Spatiotemporal features of early neuronogenesis differ in wild-type and albino mouse retina. J Neurosci. 2002;22:4249–4263. doi: 10.1523/JNEUROSCI.22-11-04249.2002. [DOI] [PMC free article] [PubMed] [Google Scholar]
- Rymer J, Wildsoet CF. The role of the retinal pigment epithelium in eye growth regulation and myopia: a review. Vis Neurosci. 2005;22:251–261. doi: 10.1017/S0952523805223015. [DOI] [PubMed] [Google Scholar]
- Salceda R, Sanchez-Chavez G. Calcium uptake, release and ryanodine binding in melanosomes from retinal pigment epithelium. Cell Calcium. 2000;27:223–229. doi: 10.1054/ceca.2000.0111. [DOI] [PubMed] [Google Scholar]
- Schaeffel F, Rohrer B, Lemmer T, Zrenner E. Diurnal control of rod function in the chicken. Vis Neurosci. 1991;6:641–653. doi: 10.1017/s0952523800002637. [DOI] [PubMed] [Google Scholar]
- Schmid GF, Papastergiou GI, Nickla DL, Riva CE, Lin T, Stone RA, Laties AM. Validation of laser Doppler interferometric measurements in vivo of axial eye length and thickness of fundus layers in chicks. Curr Eye Res. 1996;15:691–696. doi: 10.3109/02713689609008911. [DOI] [PubMed] [Google Scholar]
- Schmid KL, Abbott M, Humphries M, Pyne K, Wildsoet CF. Timolol lowers intraocular pressure but does not inhibit the development of experimental myopia in chick. Exp Eye Res. 2000;70:659–666. doi: 10.1006/exer.2000.0834. [DOI] [PubMed] [Google Scholar]
- Schmid KL, Wildsoet CF. The sensitivity of the chick eye to refractive defocus. Ophthalmic Physiol Opt. 1997;17:61–67. [PubMed] [Google Scholar]
- Schmid KL, Wildsoet CF. Assessment of visual acuity and contrast sensitivity in the chick using an optokinetic nystagmus paradigm. Vision Res. 1998;38:2629–2634. doi: 10.1016/s0042-6989(97)00446-x. [DOI] [PubMed] [Google Scholar]
- Shen B, Samaraweera P, Rosenberg B, Orlow SJ. Ocular albinism type 1: more than meets the eye. Pigment Cell Res. 2001;14:243–248. doi: 10.1034/j.1600-0749.2001.140403.x. [DOI] [PubMed] [Google Scholar]
- Smith EL., 3rd . Environmentally induced refractive errors in animals. In: Rosenfield M, Gilmartin B, Rosenfield M, Gilmartin Bs, editors. Myopia and Near Work. Oxford: Butterworth and Heinemann; 1999. pp. 57–90. [Google Scholar]
- Stone RA, Lin T, Laties AM, Iuvone PM. Retinal dopamine and form-deprivation myopia. Proc Natl Acad Sci U S A. 1989;86:704–706. doi: 10.1073/pnas.86.2.704. [DOI] [PMC free article] [PubMed] [Google Scholar]
- Takatsuji K, Ito H, Watanabe M, Ikushima M, Nakamura A. Histopathological changes of the retina and optic nerve in the albino mutant quail (Coturnix coturnix japonica) J Comp Pathol. 1984;94:387–404. doi: 10.1016/0021-9975(84)90026-4. [DOI] [PubMed] [Google Scholar]
- Tian Y, Shieh K, Wildsoet C. Opthalmic Technologies XVII, Proceedings of SPIE 6426. 2007. Retinal image degradation by optical aberrations and light scatter in normal and albino chick eyes. [Google Scholar]
- Tran N, Chiu S, Wildsoet C. The role of retinal image contrast in eye growth modulation in chicks. Invest Ophthalmol Vis Sci. 2005:46. [Google Scholar]
- Troilo D, Gottlieb MD, Wallman J. Visual deprivation causes myopia in chicks with optic nerve section. Curr Eye Res. 1987;6:993–999. doi: 10.3109/02713688709034870. [DOI] [PubMed] [Google Scholar]
- Vingrys AJ, Bui BV. Development of postreceptoral function in pigmented and albino guinea pigs. Vis Neurosci. 2001;18:605–613. doi: 10.1017/s0952523801184105. [DOI] [PubMed] [Google Scholar]
- Wack MA, Peachey NS, Fishman GA. Electroretinographic findings in human oculocutaneous albinism. Ophthalmology. 1989;96:1778–1785. doi: 10.1016/s0161-6420(89)32662-5. [DOI] [PubMed] [Google Scholar]
- Weidner C, Reperant J, Miceli D, Rio JP, Desroches AM, Kirpitchnikova E. Visual system degeneration in the glaucomatous albino quail. J Hirnforsch. 1988;29:299–314. [PubMed] [Google Scholar]
- Wildsoet C, Blackie C, Payne W. The Effect of Albinism on Emmetropization. A Study Using Chickens as Animal Model for Human Albinism. Invest Ophthalmol Vis Sci. 2002:43. [Google Scholar]
- Wildsoet CF, Oswald PJ, Clark S. Albinism: its implications for refractive development. Invest Ophthalmol Vis Sci. 2000;41:1–7. [PubMed] [Google Scholar]
- Wildsoet CF, Pettigrew JD. Kainic acid-induced eye enlargement in chickens: differential effects on anterior and posterior segments. Invest Ophthalmol Vis Sci. 1988;29:311–319. [PubMed] [Google Scholar]
- Wu J, Peachey NS, Marmorstein AD. Light-evoked responses of the mouse retinal pigment epithelium. J Neurophysiol. 2004;91:1134–1142. doi: 10.1152/jn.00958.2003. [DOI] [PMC free article] [PubMed] [Google Scholar]