Abstract
Although muscle contraction is known to result from movement of the myosin heads on the thick filaments while attached to the thin filaments, the myosin head movement coupled with ATP hydrolysis still remains to be investigated. Using a gas environmental (hydration) chamber, in which biological specimens can be kept in wet state, we succeeded in recording images of living muscle thick filaments with gold position markers attached to the myosin heads. The position of individual myosin heads did not change appreciably with time in the absence of ATP, indicating stability of the myosin head mean position. On application of ATP, the position of individual myosin heads was found to move by ≈20 nm along the filament axis, whereas no appreciable movement of the filaments was detected. The ATP-induced myosin head movement was not observed in filaments in which ATPase activity of the myosin heads was eliminated. Application of ADP produced no appreciable myosin head movement. These results show that the ATP-induced myosin head movement takes place in the absence of the thin filaments. Because ATP reacts rapidly with the myosin head (M) to form the complex (M⋅ADP⋅Pi) with an average lifetime of >10 s, the observed myosin head movement may be mostly associated with reaction, M + ATP → M⋅ADP⋅Pi. This work will open a new research field to study dynamic structural changes of individual biomolecules, which are kept in a living state in an electron microscope.
Muscle contraction results from relative sliding between the thick and thin filaments driven by chemical energy liberated by ATP hydrolysis. In the crossbridge model of muscle contraction (1, 2), globular heads of myosin, i.e., the crossbridges extending from the thick filament, attach to actin in the thin filament and change their angle of attachment to actin (powerstroke), leading to filament sliding or force generation until they are detached from actin. Each attachment-detachment cycle between a myosin head and actin is coupled with hydrolysis of one ATP molecule. Despite extensive studies to detect the change in angle between the myosin head and the thin filament, however, there is no decisive evidence that the myosin head powerstroke is associated with the myosin head rotation (3, 4).
A most straightforward way for studying the mechanism of muscle contraction may be to observe directly the movement of individual myosin heads on the thick filament under an electron microscope with sufficiently high magnifications. Though cellular functions, such as development, growth, and differentiation, are very readily impaired by electron beam irradiation (critical electron dose, 10−9−10−5 C/cm2), crystalline structures of various biomolecules are known to be resistant to much higher electron doses (5). This indicates the possibility of studying dynamic structural changes of living biomolecules in an electron microscope, using a gas environmental (hydration) chamber (EC), a device to keep the specimen in wet state in an electron microscope (5). In fact, Fukushima et al. (6) recorded ATP-induced shortening of muscle myofibrils electron microscopically with the above technique, and Suda et al. (7) determined the critical electron dose for the reduction of ATP-induced myofibrillar shortening to be 5 × 10⁻⁴ C/cm2.
Based on the above studies, we attempted to use the EC for studying the ATP-induced myosin head movement in muscle thick filaments. After a number of trials over 5 years, we have succeeded in recording the ATP-induced myosin head movement in living synthetic thick filaments. Here we describe the methods for the above dynamic electron microscopy of individual myosin heads together with the results obtained. It will be shown that the position of individual myosin heads does not change appreciably with time in the absence of ATP, but moves by ≈20 nm along the filament long axis on application of ATP.
MATERIALS AND METHODS
The EC.
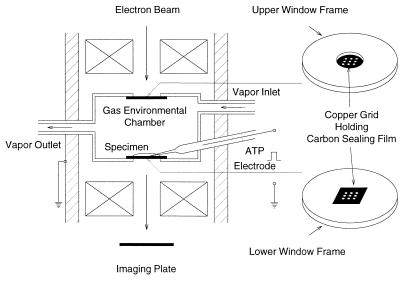
As shown schematically in Fig. 1, the EC used in the present study is a small cylindrical compartment (diameter, 2.0 mm; height, 0.8 mm) with upper and lower windows to pass electron beam. Each window is covered with a thin carbon sealing film (thickness, 15–20 nm) held on a copper grid with nine apertures (diameter, 0.1 mm) (8, 9). The carbon film is strong enough to bear pressure difference up to 1 atmosphere. The specimen placed on the lower carbon film is kept wet by constantly circulating the air saturated with water vapor (pressure, 60–80 torr; temperature, 26–28°C) through the chamber. The vapor flow rate (0.1–0.2 liter/min) can be adjusted in such a way that the thin layer of ATP-free experimental solution around the specimen is in equilibrium with vapor pressure in the EC. The EC contains an ATP-containing microelectrode with its tip immersed in the experimental solution. Further details of the EC have been described elsewhere (10). The EC is attached to a 200-kV transmission electron microscope (JEM 2000EX; JEOL).
Figure 1.
Schematic diagram of the EC. The upper and lower windows are covered with carbon sealing films held on copper grids with nine apertures. The interior of the EC is constantly circulated with water vapor to keep the specimen placed on the lower carbon film in wet state. The EC contains an ATP-containing microelectrode to apply ATP to the specimen iontophoretically. The image of the specimen is recorded on the imaging plate.
Preparation of Synthetic Thick Filaments.
The specimen used was synthetic thick filaments (myosin-paramyosin core complex), in which rabbit skeletal muscle myosin was bound to the surface of synthetic paramyosin filaments (diameter, 50–200 nm; length 10–30 μm) prepared from molluscan smooth muscle. The synthetic thick filaments were prepared from rabbit skeletal muscle myosin and paramyosin extracted from the anterior byssal retractor muscle of Mytilus edulis using Nonomura’s method (11), and kept in the ATP-free experimental solution (25 mM KCl/5 mM MgCl2/20 mM Pipes/0.1 mM DTT, pH 7.0) at myosin and paramyosin concentrations of 0.25 and 0.11 mg/ml, respectively. The advantages of using the synthetic thick filaments are: (i) they are stiff and tend to form nearly straight rods when placed on the carbon film; (ii) the filament profile is clearly distinguished from the background due to their large diameter; and (iii) because myosin molecules are bound around the paramyosin core in many rows, most myosin heads on the upper side of the filaments are free from possible constraints due to their attachment to the carbon film. In the early stage of our work, we tried to use native thick filaments isolated from rabbit skeletal muscle and synthetic thick filaments consisting only of rabbit skeletal myosin, but they proved to be unsuitable because they tended to curl and aggregate. In addition, individual filaments were not distinguished from the background due to their small diameter. We also tried to use native paramyosin filaments (length, ≥10 μm; diameter, ≤50 nm) as the core of the synthetic thick filaments, but such synthetic filaments also tended to curl and aggregate.
Colloidal gold particles (diameter, 15 nm; coated with protein A; E Y Laboratories) were attached to the myosin heads as position markers, using a site-directed antibody (IgG) to the junctional peptide between 50- and 20-kDa segments of myosin heavy chain (12). To bind the site-directed antibody to the myosin head (at a region 16 nm from the head-rod junction and opposite the ATP-binding site), 10 μl of the experimental solution containing the filaments was mixed with 25 μl of the experimental solution containing the antibody (concentration, 100 μg/ml). After 2–3 min, 35 μl of the filament-antibody mixture was further mixed with 10 μl of the experimental solution containing the colloidal gold particles (OD520, 3.5) and kept for 4 h to attach the gold particles to the myosin heads in the filaments. The synthetic thick filaments showed an Mg-ATPase activity (≈0.13 s−1, 28°C), which was not appreciably affected after mixing with the antibody. Finally, a small drop of the experimental solution (≈5 μl) containing the filaments was put onto the carbon film in the EC and blotted with filter paper. The final quantity of the solution remaining on the carbon film might be as small as 11−6 ml, though the value is admittedly crude.
The filaments with the gold position markers attached on the myosin heads were also observed after negative staining with uranyl acetate and rotary shadowing with platinum at an angle of 32° (BAF400D, Balzers).
Observation and Recording of the Filaments.
To avoid electron beam damage to the specimen, observation and recording were made with a total incident electron dose below 10−4 C/cm2, being well below the critical dose for the reduction of ATP-induced myofibrillar shortening (7). For this purpose, the filaments were observed with extremely weak beam intensities below 5 × 10⁻¹³ A/cm2 (measured with a Faraday cup on the microscope screen; AFC 20, JEOL), so that observation and focusing of the filaments on the microscope screen required enormous skill. The actual beam intensity through the filaments with a magnification of 10,000× was 5 × 10−13 × (10,000)2 = 5 × 10⁻⁵ A/cm2. As soon as the gold particles located on the upper surface of the filaments were brought in focus, electron beam was stopped except for the time of recording.
The filament images were recorded with an imaging plate system (PIX system, JEOL) with a magnification of 10,000×. The imaging plate was 10.2 × 7.7 cm in size (2,045 × 1,536 pixels), and had a sensitivity ≈60 times that of x-ray film (13). The exposure time was 0.1 s with a beam intensity of 1–2 × 10⁻¹² A/cm2. Due to the limitation of total incident electron dose, the recording was made only twice.
Application of ATP and ADP.
The application of ATP to the filaments in the ATP-free experimental solution was made iontophoretically by applying a current pulse (intensity, 10 nA; duration, 1 s) from an electronic stimulator to a glass capillary microelectrode containing 100 mM ATP (resistance, 15–20 MΩ through a current-clamp circuit (14, 15). The total amount of ATP released was estimated to be 10−14 mol (14). Assuming the volume of the experimental solution in the EC of ≈10−6 ml, the ATP concentration around the filaments was ≈10 μM. The time required for the released ATP to reach the filaments by diffusion was estimated to be less than 30 s by videorecording the ATP-induced myofibrillar shortening in the EC mounted on a light microscope. The application of ADP was made using a microelectrode containing 100 mM ADP. Hexokinase (50 units per ml) and d-glucose (2 mM) were added to the ATP-free experimental solution to eliminate contamination of ATP (14).
Data Analysis.
The filament images recorded with a magnification of 10,000× were analyzed with an image processor (Nexus Qube system, Nexus, Tokyo). In this condition, the pixel size on the imaging plate records was 5 × 5 nm, while the average number of electrons reaching a single pixel during the exposure time was ≈ 30. Reflecting this electron statistics, each gold particle image on the record consisted of 4–15 pixels. Each imaging plate record was divided into subframes containing 512 × 480 pixels, and each subframe was observed on the monitor screen (26.5 × 20 cm). Particles suitable for analysis were selected after an appropriate binarization procedure, i.e., the procedure to determine each particle configuration consisting of pixels with electron counts above a chosen level. They consisted of 5–10 pixels with shapes not markedly influenced by the level of binarization used.
The center of mass position for each selected particle was determined as the coordinates (two significant figures) within a single pixel where the center of mass position was located, and these coordinates representing the position of the particles (and therefore the position of the myosin heads) were compared between the two different imaging plate records. The absolute coordinates common to the two records were obtained based on the position of natural markers (bright spots on the carbon film, see Fig. 2A). The distance (D) between the two center of mass positions (with the coordinates x1, y 1 and x2, y2, respectively) was calculated as D =  .
.
Figure 2.
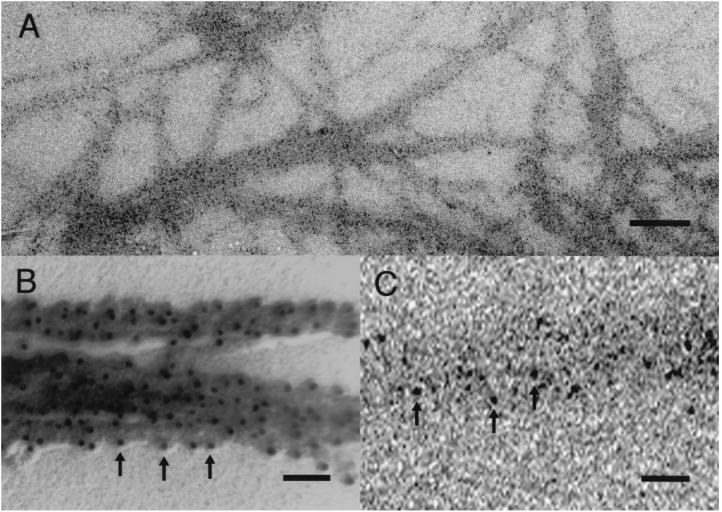
Typical images of the synthetic thick filament (myosin-paramyosin core complex). (A) Imaging plate record of the thick filaments with gold particles attached to the myosin heads, taken with a magnification of ×10,000. (Bar = 500 nm.) (B) Conventional electron micrograph of the filaments after negative staining with uranyl acetate and rotary shadowing with platinum (thickness, 2 nm). (Bar = 100 nm.) (C) Enlarged imaging plate record showing part of a thick filament with gold particles on it. (Bar = 100 nm.) Arrows in B and C indicate gold particles.
RESULTS
Stability of the Myosin Head Position in the Absence of ATP.
A typical imaging plate record of the synthetic thick filaments is shown in Fig. 2A. The gold particles attached to the myosin heads are clearly seen as discrete dark spots on the filaments, which are also readily distinguished from the background. As shown in Fig. 2B, the filaments are actually covered by the myosin heads with the gold particles attached to them. An enlarged image of a thick filament with the particles on it is shown in Fig. 2C. To examine whether the particle (and the myosin head) positions are stable or fluctuate with time, we compared the particle positions between two records of the same filaments taken at an interval of 3–5 min. After selecting particles suitable for analysis, we determined the center of mass position for each particle as the coordinates within a single pixel, and these coordinates representing the particle positions were compared between the two records.
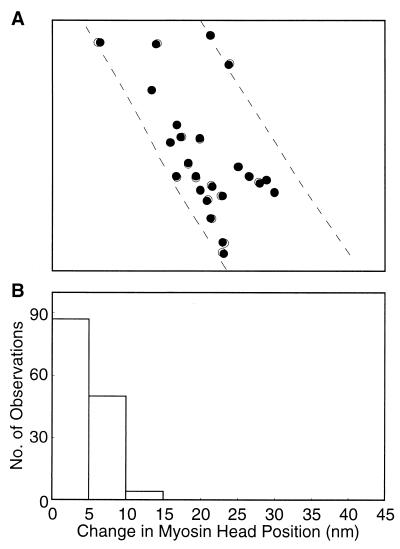
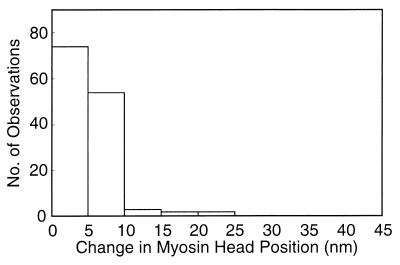
An example of the results is shown in Fig. 3A, in which a circle of 15 nm diameter is drawn around each center of mass position determined. It can be seen that the position for each particle (and therefore the position for each myosin head) remains almost unchanged with time, if the limit of spatial resolution determined by the pixel size (5 × 5 nm) is taken into consideration. Fig. 3B is a histogram showing the distribution of the distance (D) between the two positions of the same particle. Among 141 particles examined on three different pairs of records, 87 particles shown no significant position changes (D < 5 nm), and 50 particles showed only small position changes (5 nm < D < 10 nm). These results indicate that, though the position of each myosin head is expected to fluctuate due to thermal motion, its mean position time averaged for 0.1 s does not change appreciably with time in the ATP-free experimental solution.
Figure 3.
Stability of the myosin head position in the ATP-free experimental solution. (A) Comparison of the myosin head positions between the two records of the same filament on the common coordinates. Filled and open circles (diameter, 15 nm) are drawn around the center of mass position of each particle in the first and the second records, respectively. Broken lines indicate the contour of the filament on which the particles are located. (B) Histogram showing the distribution of distance between the two center of mass positions of the same particles in the first and the second records.
ATP-Induced Myosin Head Movement.
We examined possible myosin head movement in response to ATP application to the filaments, by taking two records of the same filaments, one before and the other after ATP application. Based on the time of ATP diffusion from the ATP-containing microelectrode to the filaments (<30 s), the second records were taken at 60 s after the onset of current pulse to the electrode, whereas the first records were taken 2–3 min before ATP application. To compare particle positions unambiguously, we focused attention only on particles that were sparsely distributed along a single filament and clearly separated from adjacent ones.
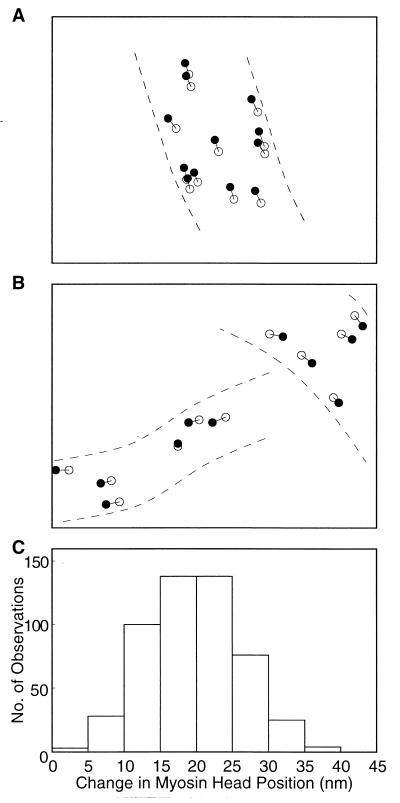
The results are summarized in Fig. 4. As schematically illustrated in Fig. 4 A and B, the center of mass position of each particle was found to move by up to 30 nm in the direction parallel to the filament long axis after ATP application, indicating the marked ATP-induced movement of individual myosin heads. Fig. 4C is a histogram showing the distribution of the amplitude of ATP-induced myosin head movement, constructed from 512 measurements on three different pairs of records. The histogram exhibits a peak at ≈20 nm. The average amplitude of ATP-induced myosin head movement was 19.6 ± 0.3 nm (mean ± SD, n = 512). The occasional presence of particles whose position did not change appreciably after ATP application (Fig. 4B) indicates that the filaments are fixed in position.
Figure 4.
Movement of the individual myosin heads on the filaments in response to ATP application. (A and B) Examples showing changes in the center of mass position of the same particles after ATP application. Filled and open circles (diameter, 15 nm) are also drawn around the center of mass positions of the same particles in the records before and those after ATP application, respectively. (C) Histogram showing the distribution of distance between the two center of mass positions of the same particles in the two records, representing the amplitude of the ATP-induced myosin head movement.
To further exclude the possibility that the myosin head movement is associated with any drift of the filaments, the contour of the filaments (especially the end of the filaments on which the myosin head movement was recorded) was determined from the contrast-enhanced filament image after appropriate binarization and smoothing procedures, and the position for each outermost pixel along the filament contour was compared before and after ATP application. Irrespective of the level of binarization, there was a significant fraction (>25%) of pixels whose position remained unchanged by ATP application, and such pixels were distributed at fairly regular intervals (every 3–5 consecutive pixels). The position of other outermost pixels changed randomly after ATP application. At the filament ends, the difference in position of the outermost pixels were 5–15 nm along the filament axis, and the pixel position changes were frequently opposite to the direction of myosin head movement. Similar results were obtained with respect to pixels constituting the filament contour in the record pairs taken without ATP application, indicating that the filament drift, if any, may not seriously affect the results obtained.
The ATP-induced myosin head movement was not observed in the filaments whose ATPase activity had been completely eliminated by N-ethylmaleimide. We also applied ADP to the filaments with a microelectrode containing ADP, but observed no appreciable myosin head movement in response to ADP application as shown in Fig. 5. These results are consistent with the view that the ATP-induced myosin head movement is associated with reaction between the myosin heads and ATP.
Figure 5.
Ineffectiveness of ADP in inducing myosin head movement. Histogram showing the distribution of distance between the two center of mass positions of the same particles in the two records, one taken before and the other taken after ADP application.
DISCUSSION
In the present study, we have succeeded in recording the ATP-induced movement of the individual myosin heads in living muscle thick filaments, using the EC in which the filaments are kept wet to retain their physiological function. Our findings are summarized: (i) in the absence of ATP, the position of the individual myosin heads (time averaged for 0.1 s) does not change appreciably with time (Fig. 3); (ii) on application of ATP, the individual myosin heads move by ≈20 nm along the filament long axis (Fig. 4); and (iii) application of ADP does not produce the myosin head movement (Fig. 5). In addition, the ATP-induced myosin head movement was not observed in the filaments, in which Mg-ATPase activity of the myosin heads were eliminated with N-ethylmaleimide, and the filaments did not move appreciably irrespective of the absence and presence of ATP. These results indicate that the ATP-induced myosin head movement found in the present work is a step in the cyclic interaction between actin, myosin, and ATP that is responsible for muscle contraction. In fact, the head movement is parallel to the filament long axis, i.e., parallel to that of myofilament sliding. It is our future goal to examine whether the myosin head position returns to the original position after complete exhaustion of applied ATP.
When ATP released from the microelectrode reaches the myosin head, it reacts rapidly with the myosin head (M) to form the complex M⋅ADP⋅Pi, having the average lifetime of >10 s due to its slow Pi release (16). Though some myosin heads would repeat the ATPase reaction cycle more than once, the majority of the myosin heads in the filament record may be in the state of M⋅ADP⋅Pi, suggesting that the myosin head movement is coupled with reaction, M + ATP → M⋅ADP⋅Pi. The present finding that the myosin head movement coupled with ATP hydrolysis can take place in the absence of the thin filament is consistent with the suggestion that the myosin head position in relaxed muscle changes depending on the state of bound nucleotide (17).
At the present stage, it is not possible to determine whether the ATP-induced myosin head movement corresponds to the myosin head powerstroke or to the preparatory movement preceding the powerstroke. If the former is actually the case, the direction of the head movement should be toward the bare region located at the center of the thick filament. To ascertain the direction of the head movement relative to the center of the thick filament, it is necessary to record the head movement on both sides of the thick filament bare region. Unfortunately, we do not yet succeed in such a recording mainly because the synthetic paramyosin filaments are very long and seem to be mostly monopolar, as indicated by observation that fluorescent F-actin filaments slide past them over a large distance without changing sliding velocity (H.S. and S.C., unpublished work). As already mentioned, we tried to use other types of thick filaments hoping to observe the myosin head movement at both sides of the bare region. Unfortunately, none of them proved to be suitable.
Although it is an open question whether the observed ATP-induced myosin head movement corresponds to the powerstroke or not, it is of interest that the average amplitude of the head movement (≈20 nm) is similar to the maximum single displacements between a single myosin head and the F-actin filament recorded in in vitro motility assay systems (18, 19). The large myosin head movement may not readily fit into the contraction model based on the myosin head rotation, and possibly would result either from cooperative action of myosin two heads (20, 21) or from shortening of myosin subfragment-2 region (22, 23). Much more experimental work is needed to clarify the myosin head movement responsible for muscle contraction.
Finally, we emphasize that our work constitutes the first success, to our knowledge, in recording dynamic structural changes of individual biomolecules electron microscopically. The dynamic electron microscopy can be performed with magnifications much higher than that in the present study (10,000×) with techniques for rapid automatic focusing of the specimen. Thus, the use of the EC would open a new research field for studying physiological function of various biomolecules such as motor proteins, channel proteins, transporters, and receptors.
Acknowledgments
We thank Japan Electron Optics Co. for generous support that made our work possible. Our thanks are also due to Prof. A. Fukami for encouragement and to Drs. H. Honda, R. Shibayama, and I. Shirakawa for technical help. This work was supported in part by research grants from the Ministry of Education, Science, and Culture of Japan (No. 63890013 and No. 05557004 to H.S.).
ABBREVIATION
- EC
gas environmental chamber
References
- 1.Huxley A F. Prog Biophys Biophys Chem. 1957;7:255–318. [PubMed] [Google Scholar]
- 2.Huxley H E. Science. 1969;164:1356–1366. [PubMed] [Google Scholar]
- 3.Sugi H. In: Muscle Contraction and Cell Motility: Molecular and Cellular Aspects. Sugi H, editor. Heidelberg: Springer; 1992. pp. 132–171. [Google Scholar]
- 4.Huxley H E. Annu Rev Physiol. 1996;58:1–19. doi: 10.1146/annurev.ph.58.030196.000245. [DOI] [PubMed] [Google Scholar]
- 5.Butler E P, Hale K F. Dynamic Experiments in the Electron Microscope. Amsterdam: North Holland; 1981. [Google Scholar]
- 6.Fukushima K, Ishikawa A, Fukami A, Suzuki S, Sugi H, Murakami S. 11th Int Congr Electron Microsc. 1986;1:329–330. [Google Scholar]
- 7.Suda H, Ishikawa A, Fukami A. J Electron Microsc. 1992;41:223–229. [PubMed] [Google Scholar]
- 8.Fukushima K, Ishikawa A, Fukami A. J Electron Microsc. 1985;34:47–51. [Google Scholar]
- 9.Fukami A, Fukushima K, Kohyama N. In: Microstructure of Fine-Grained Sediments from Mud to Shale. Bennett R H, Bryant W R, Hulbert M H, editors. Heidelberg: Springer; 1991. pp. 321–331. [Google Scholar]
- 10.Fukushima K. Ph.D. Thesis. Tokyo: Nihon University; 1988. (in Japanese). [Google Scholar]
- 11.Nonomura Y. J Mol Biol. 1974;88:445–455. doi: 10.1016/0022-2836(74)90494-x. [DOI] [PubMed] [Google Scholar]
- 12.Sutoh K, Tokunaga M, Wakabayashi T. J Mol Biol. 1989;206:357–363. doi: 10.1016/0022-2836(89)90485-3. [DOI] [PubMed] [Google Scholar]
- 13.Amemiya Y, Wakabayashi K, Tanaka H, Ueno Y, Miyahara J. Science. 1987;237:164–168. doi: 10.1126/science.3496662. [DOI] [PubMed] [Google Scholar]
- 14.Oiwa K, Chaen S, Sugi H. J Physiol. 1991;437:751–763. doi: 10.1113/jphysiol.1991.sp018623. [DOI] [PMC free article] [PubMed] [Google Scholar]
- 15.Oiwa K, Kawakami T, Sugi H. J Biochem. 1993;114:28–32. doi: 10.1093/oxfordjournals.jbchem.a124134. [DOI] [PubMed] [Google Scholar]
- 16.Lymn R W, Taylor E W. Biochemistry. 1971;10:4617–4624. doi: 10.1021/bi00801a004. [DOI] [PubMed] [Google Scholar]
- 17.Wray J S. J Muscle Res Cell Motil. 1987;8:62. doi: 10.1007/BF01739760. (abstr.). [DOI] [PubMed] [Google Scholar]
- 18.Finer J T, Simmons R M, Spudich J A. Nature (London) 1994;368:113–119. doi: 10.1038/368113a0. [DOI] [PubMed] [Google Scholar]
- 19.Ishijima A, Harada Y, Kojima H, Funatsu T, Higuchi H, Yanagida T. Biochem Biophys Res Commun. 1994;199:1057–1063. doi: 10.1006/bbrc.1994.1336. [DOI] [PubMed] [Google Scholar]
- 20.Tokiwa T, Morales M F. Biochemistry. 1971;10:1722–1727. doi: 10.1021/bi00785a033. [DOI] [PubMed] [Google Scholar]
- 21.Chaen S, Shimada M, Sugi H. J Biol Chem. 1986;261:13632–13636. [PubMed] [Google Scholar]
- 22.Lovell S, Karr T, Harrington W F. Proc Natl Acad Sci USA. 1988;85:1849–1853. doi: 10.1073/pnas.85.6.1849. [DOI] [PMC free article] [PubMed] [Google Scholar]
- 23.Sugi H, Kobayashi T, Gross T, Noguchi K, Karr T, Harrington W F. Proc Natl Acad Sci USA. 1992;89:6134–6137. doi: 10.1073/pnas.89.13.6134. [DOI] [PMC free article] [PubMed] [Google Scholar]


