

Abstract
The spontaneously hypertensive rat (SHR) has been widely used as an animal model for attention-deficit/hyperactivity disorder (AD/HD), a developmental disorder that affects 3-5% of school-age children. Quantitative high-resolution (180×180×1500 μm) perfusion magnetic resonance imaging was performed to evaluate regional CBF in AD/HD rats (SHR, n=7) and control Wistar Kyoto rats (WKY, n=9) in the frontal cortex, motor cortex, sensory cortex, corpus callosum, hippocampus, thalamus, globus pallidus, caudoputamen and whole brain. The accuracy of repeated cerebral blood flow (CBF) measurements within animals in these brain regions ranged from 3 to 10% (7 repeated measures) and across animals ranged from 15 to 18% (n = 7 rats), respectively, indicating highly accurate and reproducible CBF measurements. Regional CBF of the SHR were statistically different from those of the WKY rats in all structures analyzed (P<0.05) except for the caudate putamen (P=0.09) and the globus pallidus (P=0.12). Whole brain CBF of the SHR (1.5±0.2ml/gram/min, mean±SD) was ∼25% higher than that of the WKY rats (1.2±0.2ml/gram/min), likely due to the hypertensive nature of the AD/HD rat model. Following normalization to eliminate global CBF differences, CBF in the medial prefrontal cortex, a structure thought to be the equivalent of the human dorsolateral prefrontal cortex and widely implicated in AD/HD, was found to be higher in SHR compared to WKY rats (P<0.05). The only other structure that was found to be statistically different after normalization is the corpus callosum (P<0.05). Since resting cerebral blood flow is intricately coupled to resting neural activity, these results suggest that there was abnormal resting neural activity in the medial prefrontal cortex and the corpus callosum between the control and AD/HD animals, consistent with the hyperactivity, impulsivity, inattention, and other AD/HD-like behaviors in this animal model.
Keywords: CBF, arterial spin labeling, fMRI, ADHD, hypertensive, prefrontal cortex
1. INTRODUCTION
Attention-deficit/hyperactivity disorder (ADHD) is an early-onset developmental disorder that affects approximately 3-5% of school-age children and mainly occurs in males. It is marked by symptoms of inattention, hyperactivity, and impulsivity, and is among the most prevalent of childhood disorders (American Psychiatric Association 1994). In addition to the interpersonal and scholastic problems that accompany the disorder, children with ADHD also suffer from low self-images (Dumas and Pelletier 1999) and are predisposed to develop other psychiatric problems later in life (Tarter et al 2003). Furthermore, ADHD children show less persistence at academic tasks (Hoza et al 2001). ADHD has also been shown to interact with comorbid learning disabilities to exacerbate handicaps in executive function (Seidman et al 2001). Barkley describes ADHD as a failure in the brain circuitry responsible for behavioral inhibition and self-control. The dorsolateral prefrontal cortex is a key structure that is implicated in ADHD and is hypothesized to contribute to a combination of executive functions, including but not limited to working memory and internalization (Barkley 1998).
With the advent of imaging technology, structural, functional and neurochemical profiles of many neurological and psychiatric disorders can be visualized across the entire brain at high spatial and temporal resolution. A plethora of structures have been identified to be associated with ADHD. Some of these prominent structures are the frontal lobes, basal ganglia, cerebellum, and frontal-basal ganglia circuitry (Amen and Carmichael 1997; Casey et al 1997; Giedd et al 2001; Kates et al 2002). Prefrontal volume has been found to be 8.3% smaller in ADHD boys (Mostofsky et al 2002). Decreased prefrontal activation was observed in ADHD adolescents and was correlated with poorer performance on executive tasks (Rubia et al 1999). A lower cerebral blood flow (CBF) in the prefrontal cortices and the cerebellum in humans with ADHD has been reported using single photon emission computerized tomography (SPECT) (Kim et al 2002). The resting CBF abnormalities were lateralized with a larger reduction in the right compared to the left prefrontal cortex (Spalletta et al 2001).
Although experiments are often done on human subjects, animal models offer the means to study the mechanisms of the disease under well controlled conditions as well as increase the range of methods with which the disorder can be studied. The most widely used animal model for ADHD is the spontaneously hypertensive rat (SHR) because it shows many of the salient symptoms of ADHD, including hyperactivity and motor and cognitive impulsiveness (Sagvolden 2000). SHR are bred from parental Wistar Kyoto rats (WKY) (Okamoto and Aoki 1963) which do not show the quasi-ADHD symptoms, making the WKY strain an ideal control. Furthermore, a genetic model like the SHR, as opposed to an environmental model like abused or chemically treated rats (Sagvolden 2000), should better represent a disease which has been shown to have a genetic component (Morrison and Stewart 1971).
While cerebral blood flow (CBF) can be measured using autoradiography, positron emission tomography (PET), SPECT, laser Doppler techniques, and many other techniques, CBF measurement using magnetic resonance imaging has some unique advantages. It is non-invasive, quantitative, high spatial resolution with whole brain coverage. CBF MRI can be measured by using an exogenous intravascular contrast agent or by magnetically labeling the endogenous water in blood (Calamante et al., 1999; Barbier et al., 2001). The former is efficient but it has lower spatial resolution because the long half life of the contrast agent allows only one CBF measurement per bolus injection, precluding the possibility of signal averaging needed for high spatial resolution measurements. Arterial spin labeling (ASL) techniques, on the other hand, are totally non-invasive, and the labeled water has a short half-life (∼ blood T1) making it possible to performed multiple repeated measurements which can be used to augment spatial resolution and/or signal-to-noise ratio.
ASL can be performed using pulsed labeling (Detre et al., 1994; Wong et al., 1998; Wang et al., 2005) or continuous labeling (Silva et al., 1997a; Zaharchuk et al., 1999; Talagala et al., 2004; Zhang et al., 2007); both are capable of multislice and whole-brain imaging. Continuous ASL (cASL) can be achieved with the same radiofrequency (RF) coil used for imaging or a separate neck coil. cASL with a separate neck coil is generally more sensitive relative to the single-coil technique (Kim, 1995; Wong et al., 1998; Wang et al., 2005), particularly in small animals such as rodents which have short arterial transit time. With the separate neck coil, magnetization-transfer effect is eliminated if the coils are properly decoupled, resulting in a larger signal difference between labeled and non-labeled images, and thus improved CBF SNR. RF power deposition is localized to the neck area and unlabeled images can be acquired without labeling RF, reducing specific absorption rate which could cause tissue heating. By quantifying the labeling efficiency, quantitative CBF in unit of mL per gram per min can be determined.
The goal of this study was to investigate the quantitative regional blood flow differences between the ADHD (SHR) and normal (WKY) rats under resting conditions. Since cerebral blood flow is intricately coupled to neural activity (Roy and Sherrington 1890), we hypothesized that CBF measurements could offer insights into the regional neural activity differences between the control and ADHD animals under resting conditions. Multislice high-resolution (180×180×1500 μm) quantitative perfusion imaging was performed using magnetic resonance imaging. The continuous arterial spin labeling technique using a two-coil system and echo-planar data acquisition was used. Quantitative cerebral blood flow (CBF) maps were derived. The accuracy of repeated CBF measurements within and across different animals was carefully evaluated. CBF differences between ADHD and control rats were analyzed for the medial prefrontal cortex, caudate nucleus, globus pallidus, frontal cortex, sensory cortex, motor cortex, thalamus, hippocampus, and whole brain.
2. RESULTS
2.1. CBF reproducibility
Representative anatomic images from a WKY rat are shown in Figure 1A. Representative regions of interest (ROIs) are shown overlaying the anatomic images which include the frontal cortex, the sensory cortex, the hippocampus, the thalamus, the globus pallidus, the caudate putamen, the corpus callosum, the medial prefrontal cortex, and the motor cortex. Representative high-resolution echo planar images (EPI) and quantitative CBF images from the same animal are shown in Figure 1B and 1C, respectively. Heterogeneous CBF distribution across the entire brain was observed as expected (i.e., the corpus callosum and the lateral ventricles had lower CBF values).
Figure 1.
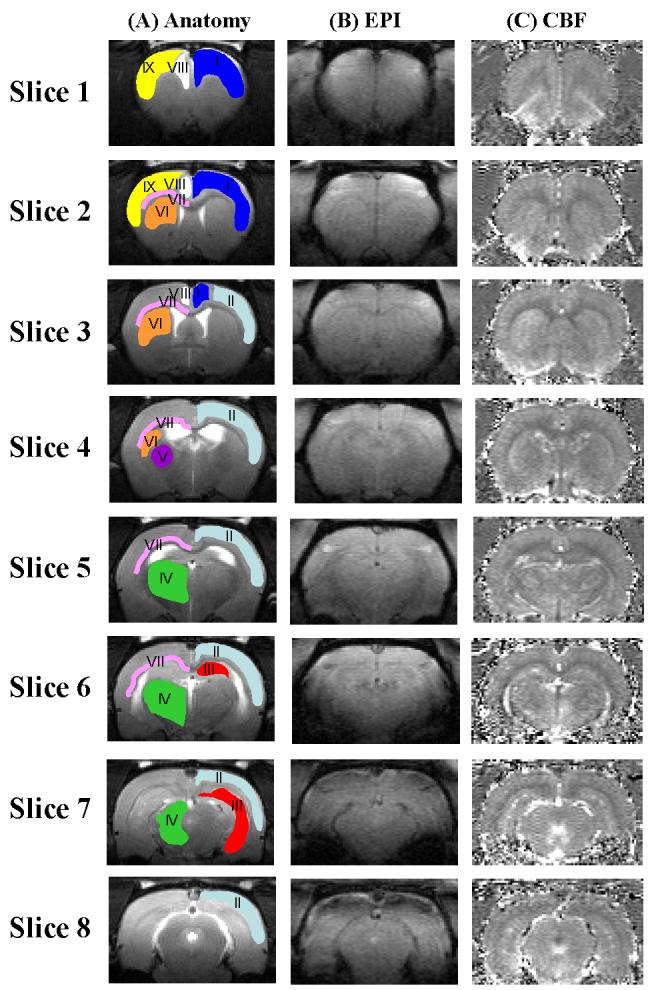
Anatomical images of a WKY rat. Overlaid on the anatomy are nine representative regions of interest (ROIs): I. Frontal cortex - dark blue; II. sensory cortex - light blue; III. hippocampus - red; IV. thalamus - green; V. globus pallidus - purple; VI. caudoputamen - orange; VII. corpus callosum - pink VIII. medial prefrontal cortex - white; IX. motor frontal cortex - yellow. ROI for each type of structure was drawn on one hemisphere for clarity; analysis used ROI's from both hemispheres. (B) Representative echo planar image (EPI) of a WKY rat. (C) Representative perfusion image from the same animal.
We carefully evaluated the accuracy and consistency of CBF measurement within the same animal. Representative averages and standard deviations for seven sets of repetitions of the same WKY rat on the same day are shown in Table 1. The average whole-brain cerebral blood flow was 0.99 ± 0.04 ml/gram/min (mean ± SD, 7 repetitions), and the standard deviations for the other brain sub-structures ranged from 0.03 to 0.10 ml/gram/min. Since each rat was measured twice, the average percent differences for each ROI across the two repetitions of the same animal were also evaluated. The average percent differences ranged from 17% in the corpus callosum to 33% in the left medial frontal lobe with a whole brain average of 18% .
Table 1.
Representative Averages and Standard Deviations for Seven Consecutive Repetitions from one animal.
| Region of Interest (ROI) | Average | SD |
|---|---|---|
| Whole brain | 0.99 | 0.04 |
| Frontal cortex | 0.91 | 0.07 |
| Sensory cortex | 0.90 | 0.06 |
| Hippocampus | 0.98 | 0.05 |
| Thalamus | 1.09 | 0.03 |
| Globus pallidus | 0.58 | 0.04 |
| Caudate putamen | 1.00 | 0.06 |
| Corpus callosum | 0.52 | 0.05 |
| Medial prefrontal cortex | 1.02 | 0.09 |
| Motor cortex | 0.89 | 0.05 |
| Right medial prefrontal cortex | 1.02 | 0.08 |
| Left medial prefrontal cortex | 1.03 | 0.10 |
2.2. Resting cerebral blood flow differences between SHR and WKY rats
The group-average quantitative cerebral blood flow differences between WKY and SHR are shown in Figure 2A. For WKY control rats, the CBF in different brain regions varied from 0.5 to 1.6 ml/gram/min, indicating the heterogeneity of CBF distribution in the rat brain, with a whole brain average of 1.2 ± 0.2 ml/gram/min. These quantitative CBF values are consistent with those reported previously under similar conditions (Duong et al 2001a; Duong et al 2000; Sicard et al 2003). For the SHR, CBF ranged from 0.7 to 2.4 ml/gram/min with a whole brain average of 1.5 ± 0.2 ml/gram/min. Sub-structures of the left and right hemispheres were analyzed separately but no statistical differences were found, and data of the left and right hemispheres were grouped together for statistical comparison between SHR and WKY rats. The global and regional quantitative CBF of the SHR and WKY rats were statistically different for all substructures analyzed (P < 0.05) except for at the caudate putamen (P = 0.09) and globus pallidus (P = 0.12). The differences between the two rat strains could be due in part to the SHR being hypertensive, which results in systemically higher resting blood flow across the entire brain.
Figure 2.


(A) Quantitative cerebral blood flow from different brain structures of SHR (black, n = 7, mean ± SD) and WKY rats (white, n = 9) using the ROIs in Figure 1. (B) Normalized cerebral blood flow from different regions of interests of SHR and WKY rats. Values were normalized by dividing the CBF values of individual structures by the whole brain average. * P < 0.05. CX: cortex, pfc: prefrontal cortex.
Therefore, to further investigate the relative regional CBF differences between SHR and WKY rats, normalized CBF values with respect to the whole-brain average were analyzed (Figure 2B). CBF in the medial prefrontal cortex and the corpus callosum of the SHR was found to be higher than the WKY rats (P < 0.05). No statistical differences in the normalized CBF values between SHR and WKY rats were observed in other brain structures analyzed (P > 0.05).
3. DISCUSSION
This study reports regional CBF differences between SHR (AD/HD model) and WKY (controls) rats. Regional quantitative CBF of the SHR were statistically different from those of the WKY rats in all structures analyzed except for the caudate putamen and the globus pallidus. Following normalization to eliminate global CBF differences, CBF in the medial prefrontal cortex, a structure thought to be the equivalent of the human dorsolateral prefrontal cortex and widely implicated in AD/HD, was found to be higher in SHR compared to WKY rats. Since resting CBF is intricately coupled to resting neural activity, these results suggest that there was abnormal resting neural activity in the medial prefrontal cortex and the corpus callosum between the control and AD/HD animals, consistent with the hyperactivity, impulsivity, inattention, and other AD/HD-like behaviors in this animal model. These findings were made possible by high-resolution CBF measurements using the continuous arterial spin labeling technique.
3.1. Consistency of cerebral blood flow measurements within and across animals
MRI offers a non-invasive tool to image quantitative CBF at reasonably high spatial and temporal resolution at the level of the capillary and tissue (Duong et al 2001b; Kim 1995; Kwong et al 1992; Wong et al 1998). While consistent with many existing and established invasive CBF measurements, the arterial spin labeling technique used to measure cerebral blood flow herein is subject to errors that could compromise the precision of CBF measurements. These errors could arise from magnetization transfer, transit time, and water-exchange effect. With the use of the actively decoupled two-coil system for CBF measurements, the magnetization transfer effect on quantitative CBF values was not an issue (Duong et al 2000; Silva et al 1999). Transit time (Calamante et al 1999; Zhou and van Zijl 1999) and water-exchange effects have been shown to be small (Parkes and Tofts 2002; Silva et al 1997a; Zhou et al 2001) and are not expected to alter the overall conclusions of this study.
We carefully evaluated the accuracy of repeated measurements within and across animals. To the best of our knowledge, the accuracy of repeated CBF measurements using the continuous arterial spin-labeling technique within and across animals has not been carefully evaluated. The differences in experimental setup, animal size, blood gases, animal physiology and temperature could potentially affect the accuracy of the CBF measurements. In this study, similar animal size and experimental setup were used. A previous study (Sicard et al 2003) in which animal physiology, such as blood gases, blood pressure, respiration and heart rates were carefully evaluated under identical experimental conditions, showed that all animals had normal physiological parameters. Therefore, these physiological parameters were not measured in this study to avoid being invasive. For consistency within the same rats on the same day, we observed regional and whole-brain differences of ∼ 4%. Consistency across animals in the same group was ∼ 18% for the WKY group and ∼ 15% for the SHR group. These compared favorably with ∼ 25% difference in alpha-chloralose anesthetized and mechanically ventilated animals (Duong et al 2000).
3.2. Resting cerebral blood flow differences between SHR and WKY rats
This study aimed at evaluating the cerebral blood flow differences between the spontaneously hypertensive rat (SHR) and its non-ADHD Wistar Kyoto (WKY) kin. This was done in hopes of revealing the relevance of SHR as a model for attention-deficit/hyperactivity disorder (ADHD). We observed significant increase in resting blood flow in the SHR relative to the WKY rats for all sub-structures analyzed except for the caudate putamen and globus pallidus. The global increase in blood flow across the entire brain could be attributed in part to the hypertensive nature of this rat model which may have nothing to do with ADHD characteristics. We therefore normalized CBF with respect to the whole brain CBF value and this normalization should remove the hypertensive component of the animal model.
When the regional CBF values were normalized with respect to the whole brain average for each animal, the medial prefrontal cortex showed a consistent and significant higher blood flow in SHR compared to WKY rats. The medial prefrontal cortex in rats is thought to be equivalent of the primate dorsolateral prefrontal cortex (Akert 1964; Rose and Woolsey 1948a; Rose and Woolsey 1948b; Rose and Woolsey 1949), although it is still debated whether rats have such a homologous structure (Preuss 1995). The dorsolateral prefrontal cortex is purported to play a central role in ADHD (Barkley 1998; Giedd et al 2001). There have been a few studies on anatomical, functional and perfusion differences centered around the prefrontal cortex and more specifically the dorsolateral prefrontal cortex. Smaller frontal lobes have been reported in ADHD boys relative to age-matched controls (Mostofsky et al 2002). ADHD children showed smaller prefrontal activation involving motor responses and these findings were correlated with poorer behavioral performance (Rubia et al 1999). Decreased resting blood flow in the prefrontal cortex in ADHD children relative to controls had been reported as measured by SPECT (Kim et al 2002). The resting CBF abnormalities have also been found to be lateralized with larger reduction in the right compared left prefrontal cortices (Spalletta et al 2001).
In contrast to the human CBF studies, the resting CBF in the medial prefrontal cortex of ADHD rats was found to be consistently higher than that of the WKY control rats. Our data is consistent with the findings of increased norepinephrine activity in prefrontal cortex slices of the same SHR model relative to the WKY rats (Russell et al 2000). Given the accuracy, consistency and reproducibility of our CBF measurements, the CBF differences in the medial prefrontal cortex of ADHD between SHR and WKY rats are very unlikely to be artifactual. Discrepancies between the human and animal CBF data could be due to the SHR rat model itself or due to the use of anesthetics. As with any animal models of human disorders or diseases, it is possible that the SHR do not perfectly model the ADHD conditions in humans. Furthermore, anesthetized animals were used in our study in contrast to the human studies, which generally use conscious patients. Anesthetics, widely used in magnetic resonance imaging of animal models to avoid movement artifacts, are known to affect resting blood flow and neural activity. In particular, isoflurane is a potent vasodilator (Hensen et al 1988; Matta et al 1999) which could partially mask regional differences between the experimental and control groups. Our lab has recently developed technology for quantitative CBF measurements in conscious rats (Sicard et al 2003). CBF comparison of awake and anesthetized models of the SHR and WKY rats are under investigation, which could potentially yield additional insight into this ADHD rat model.
Similarly, after normalization, CBF values of the corpus callosum showed a significantly higher blood flow in SHR compared to WKY rats. This result needs to be interpreted with caution because of its small size and the potential for partial volume effect. A smaller rostral corpus callosum in ADHD children had been reported relative to controls (see review (Giedd et al 2001)). It has also been suggested that the cortical-striatial circuitry is impaired in ADHD patients (Amen and Carmichael 1997; Casey et al 1997; Giedd et al 2001; Kates et al 2002). Our resting CBF data in the corpus callosum is consistent with these findings. Other studies reported functional abnormality in the cerebellum in ADHD patients (Giedd et al 2001). Cerebellum CBF was not measured in our study. Probe electronics are currently being developed for imaging cerebellar CBF.
One major implication of our findings is that caution must be exercised when comparing stimulus-evoked fMRI responses between normal and ADHD in rats and/or humans. We observed ∼ 25% CBF differences (whole brain average) between ADHD and control rats. It has been shown that the resting blood flow level markedly modulates the magnitude and the dynamics of the stimulus evoked BOLD responses (i.e., time to peak and full-width at half maximum of the fMRI response function). Higher resting CBF yields a smaller stimulus-evoked fMRI BOLD percent change, and a slower, broader hemodynamic response associated with visual stimulation (Cohen et al 2002; Kemna and Posse 2001). Therefore, these results suggest that caution must be exercised when comparing stimulus-evoked fMRI responses between SHR and WKY animals.
In summary, we employed high-resolution CBF arterial spin-labeling technique to study normal and AD/HD rats. The accuracy of repeated CBF measurements using MRI on different brain substructures was reported to be 3-10% within the same animal and 15-18 % across animals, suggesting highly accurate and reproducible quantitative CBF measurements. ADHD rats showed markedly higher regional and global blood flow when compared to the control WKY rats. After normalization to eliminate the global differences, regional CBF in the ADHD rats showed differentially higher CBF in the corpus callosum and the medial prefrontal cortex; the latter has been widely implicated in ADHD.
4. METHODS
4.1. Animal preparation
All animal experiments were approved by IACUC and in accordance with guidelines published by the NIH. Two groups of male rats (356 ± 48 grams), were imaged. Group I consisted of Wistor Kyoto rats (WKY, n = 9, control). Group II consisted of spontaneously hypertensive rats (SHR, n = 7, experimental). Typically, each rat was imaged twice on different days. Animals were secured in a MR-compatible rat stereotaxic headset with custom-designed ear- and tooth-bars with a built-in radiofrequency neck coil for arterial spin labeling. All imaging studies were performed under 2% isoflurane, in which animals respired spontaneously without mechanical ventilation. The rectal temperature was monitored and maintained at 37.5 ± 1°C throughout the study via a feedback-regulated, circulating-water pad.
4.2. MR experiments
All MR experiments were performed on a 4.7-T/40-cm horizontal magnet (Oxford, UK) equipped with a Biospec Bruker console (Bruker, Germany), and a 20-G/cm magnetic field gradient insert (ID = 12 cm) capable of 120-μs rise time (Bruker, Germany). An actively-decoupled surface coil (2.3-cm ID) was used for brain imaging and a neck coil (Duong et al 2000; Silva et al 1999) for perfusion labeling. Coil-to-coil electromagnetic interaction was actively decoupled. High-resolution anatomical images were acquired using the fast spin-echo (rapid acquisition with relaxation enhancement, RARE) pulse sequence with TR = 2 s (90° flip angle), 16 echo trains, effective TE = 85 ms, matrix = 256 × 256, FOV = 2.56 × 2.56 cm2, and eight 1.5-mm slices. Sixteen transients were acquired for signal averaging.
CBF measurements were made using the continuous arterial spin-labeling technique (Duong et al 2000; Silva et al 1999) with four-shot, gradient-echo, echo-planar-imaging (EPI) acquisition. Paired images were acquired alternately – one with arterial spin labeling and the other without spin labeling (control). The MR parameters were: data matrix = 128 × 128, FOV = 2.56 × 2.56 cm2, the same eight 1.5-mm slices as anatomy, TE = 15 ms, and TR = 2 s per shot (90° flip angle). Continuous arterial spin labeling employed a 1.78-s square radiofrequency pulse to the labeling coil in the presence of 1.0 G/cm gradient along the flow direction such that the condition of adiabatic inversion was satisfied (Detre et al 1992). The sign of the frequency offset was switched for control (non-labeled) images. The total time for one pair of images is 16 s. For each set of CBF measurement, thirty-one pairs of images (∼ 8 mins) were acquired and the first pair was discarded and excluded from analysis. This was repeated 6-8 times for each imaging session (∼ 60 mins), and the resulting values were averaged.
4.3. Data analysis
Image analysis employed codes that were written in Matlab (MathWorks Inc, Natick, MA) and the STIMULATE software (Strupp 1996). CBF image (SCBF) with intensity in unit of ml per gram tissue per min was calculated pixel-by-pixel using (Silva et al 1997b),
| [1] |
where SC and SL are signal intensities of the control and labeled images, respectively. λ is the water brain-blood partition coefficient, T1 is that of tissue, and α is the arterial spin-labeling efficiency (Silva et al 1997b). λ was taken to be 0.9 (Herscovitch and Raichle 1985). T1 and α were measured to be 1.5 s and 0.75, respectively.
Multiple CBF measurements from each animal were averaged to obtain a single multislice set of CBF images. Regions of interests (ROIs) were analyzed in both hemispheres and were carefully drawn with reference to both anatomy and CBF images. These ROIs were the whole brain, frontal cortex, medial prefrontal cortex, motor cortex, sensory cortex, corpus callosum, hippocampus, thalamus, globus pallidus, and caudoputamen. Accuracy and consistency of repeated CBF measurement within and across different animals were evaluated. Differences in resting CBF values in different brain structures between SHR and WKY rats were compared. In addition, relative differences in regional CBF with respect to the whole brain average were also analyzed by dividing the regional CBF values by the average CBF values of the whole brain for each animal. This normalization removed bias due to anesthetics. Statistical tests between SHR and WKY rats were performed by using the unpaired student's t-test assuming unequal variances. All reported values and error bars on plots were in mean ± SD.
ACKNOWLEDGEMENT
This work was supported in part by the NIH (NINDS, R01-NS45879) and the American Heart Association (SDG-0430020N). The Yerkes Imaging Center is supported by an NIH/NCRR base grant (P51RR000165).
Footnotes
Publisher's Disclaimer: This is a PDF file of an unedited manuscript that has been accepted for publication. As a service to our customers we are providing this early version of the manuscript. The manuscript will undergo copyediting, typesetting, and review of the resulting proof before it is published in its final citable form. Please note that during the production process errors may be discovered which could affect the content, and all legal disclaimers that apply to the journal pertain.
REFERENCES
- Akert K. Comparatiove anatomy of the frontal cortex and thalamofrontal connections. In: Warren JM, Akert K, editors. The frontal granular cortex and behavior. McGraw-Hill; New York: 1964. pp. 372–296. [Google Scholar]
- Amen DG. Carmichael BD High-resolution brain SPECT imaging in ADHD. Annals of Clinical Psychiatry. 1997;9:81–86. doi: 10.1023/a:1026201218296. [DOI] [PubMed] [Google Scholar]
- American Psychiatric Association . Diagnostic and Statistical Manual of Mental Disorders, 4th ed. 4 ed. American Psychiatric Association; Washington, D.C.: 1994. [Google Scholar]
- Barkley RA. Attention-deficit/hyperactivity disorder. Scientific American. 1998;279:66–71. doi: 10.1038/scientificamerican0998-66. [DOI] [PubMed] [Google Scholar]
- Barbier EL, Lamalle L, Decorps M. Methodology of brain perfusion imaging. J Magn Reson Imaging. 2001;13:496–520. doi: 10.1002/jmri.1073. [DOI] [PubMed] [Google Scholar]
- Calamante F, Thomas DL, Pell GS, Wiersma J, Turner R. Measuring cerebral blood flow using magnetic resonance imaging techniques. J Cereb Blood Flow Metab. 1999;19:701–735. doi: 10.1097/00004647-199907000-00001. [DOI] [PubMed] [Google Scholar]
- Casey BJ, Castellanos FX, Giedd JN, Marsh WL. Implications of right frontostriatal circuitry in response inhibition and attention-deficit/hyperactivity disorder. Journal of the American Academy of Child and Adolescent Psychiatry. 1997;36:374–383. doi: 10.1097/00004583-199703000-00016. [DOI] [PubMed] [Google Scholar]
- Cohen ER, Ugurbil K, Kim S-G. Effect of basal conditions on the magnitude and dynamics of the blood oxygenation level-dependent fMRI response. J Cereb Blood Flow Metab. 2002;22:1042–1053. doi: 10.1097/00004647-200209000-00002. [DOI] [PubMed] [Google Scholar]
- Detre JA, Leigh JS, Williams DS, Koretsky AP. Perfusion imaging. Magn Reson Med. 1992;23:37–45. doi: 10.1002/mrm.1910230106. [DOI] [PubMed] [Google Scholar]
- Detre JA, Zhang W, Roberts DA, Silva AC, Williams DS, Grandis DJ, Koretsky AP, Leigh JS. Tissue specific perfusion imaging using arterial spin labeling. NMR in Biomed. 1994;7:75–82. doi: 10.1002/nbm.1940070112. [DOI] [PubMed] [Google Scholar]
- Dumas D, Pelletier L. A study of self-perception in hyperactive children. The American Journal of Maternal/Child Nursing (MCN) 1999;24:12–19. doi: 10.1097/00005721-199901000-00004. [DOI] [PubMed] [Google Scholar]
- Duong TQ, Iadacola C, Kim S-G. Effect of hyperoxia, hypercapnia and hypoxia on cerebral interestitial oxygen tension and cerebral blood flow in the rat brain: an 19F/1H study. Magn Reson Med. 2001a;45:61–70. doi: 10.1002/1522-2594(200101)45:1<61::aid-mrm1010>3.0.co;2-8. [DOI] [PubMed] [Google Scholar]
- Duong TQ, Kim D-S, Ugurbil K, Kim S-G. Localized blood flow response at sub-millimeter columnar resolution. Proc Nat Acad Sci. 2001b;98:10904–10909. doi: 10.1073/pnas.191101098. [DOI] [PMC free article] [PubMed] [Google Scholar]
- Duong TQ, Silva AC, Lee S-P, Kim S-G. Functional MRI of calcium-dependent synaptic activity: cross correlation with CBF and BOLD measurements. Magn Reson Med. 2000;43:338–392. doi: 10.1002/(sici)1522-2594(200003)43:3<383::aid-mrm10>3.0.co;2-q. [DOI] [PubMed] [Google Scholar]
- Giedd JN, Blumenthal J, Molloy E. Castellanos FX Brain imaging of attention-deficit hyperactivity disorder. Annals New York Academy of Science. 2001;931:33–49. doi: 10.1111/j.1749-6632.2001.tb05772.x. [DOI] [PubMed] [Google Scholar]
- Hensen TD, Warner DS, Todd MM, Vust LJ. Trawick DC Distribution of cerebral blood flow during halothane versus isoflurane anesthesia in rats. Anesthesiology. 1988;69:332–337. doi: 10.1097/00000542-198809000-00008. [DOI] [PubMed] [Google Scholar]
- Herscovitch P, Raichle ME. What is the correct value for the brain-blood partition coefficient for water? J Cereb Blood Flow Metab. 1985;5:65–69. doi: 10.1038/jcbfm.1985.9. [DOI] [PubMed] [Google Scholar]
- Hoza B, Pelham WE, Waschbusch DA, Kipp H, Owens J. Academic task presistence of normally achieving ADHD and control boys: Performance, self-evalutations, and attributions. Journal of Consulting & Clinical Psychology. 2001;69:271–283. doi: 10.1037//0022-006x.69.2.271. [DOI] [PubMed] [Google Scholar]
- Kates WR, Fredrikse M, Mostofsky SH, et al. MRI parcellation of the frontal lobe in boys with attention-deficit/hyperactivity disorder or Tourette syndrome. Psychiatry Research: Neuroimaging. 2002;116:63–81. doi: 10.1016/s0925-4927(02)00066-5. [DOI] [PubMed] [Google Scholar]
- Kemna LJ. Posse S Effect of respiratory CO2 changes on the temporal dynamics of the hemodynamic response in functional MR imaging. NeuroImage. 2001;14:642–649. doi: 10.1006/nimg.2001.0859. [DOI] [PubMed] [Google Scholar]
- Kim B-N, Lee J-S, Shin M-S, Cho S-C, Lee D-S. Regional cerebral perfusion abnormalities in attention deficit/hyperactivity disorder. Eur Arch Psych Clin Neurosci. 2002;252:219–225. doi: 10.1007/s00406-002-0384-3. [DOI] [PubMed] [Google Scholar]
- Kim S-G. Quantification of relative cerebral blood flow change by flow-sensitive alternating inversion recovery (FAIR) technique: application to functional mapping. Magn Reson Med. 1995;34:293–301. doi: 10.1002/mrm.1910340303. [DOI] [PubMed] [Google Scholar]
- Kwong KK, Belliveau JW, Chesler DA, et al. Dynamic magnetic resonance imaging of human brain activity during primary sensory stimulation. Proc Natl Acad Sci USA. 1992;89:5675–5679. doi: 10.1073/pnas.89.12.5675. [DOI] [PMC free article] [PubMed] [Google Scholar]
- Matta BF, Heath KJ, Tipping K, Summors AC. Direct cerebral vasodilatory effects of sevoflurane and isoflurane. Anesthesiology. 1999;91:677–680. doi: 10.1097/00000542-199909000-00019. [DOI] [PubMed] [Google Scholar]
- Morrison JR, Stewart MA. A family study of the hyperactive child syndrome. Biol. Psychiatry. 1971;3:189–195. [PubMed] [Google Scholar]
- Mostofsky SH, Cooper KL, Kates WR, Denckla MB, kaufmann WE. Smaller prefrontal and premotor volumes in boys with attention-deficit/hyperactivity disorder. Biol. Psychiatry. 2002;52:785–794. doi: 10.1016/s0006-3223(02)01412-9. [DOI] [PubMed] [Google Scholar]
- Okamoto K, Aoki K. Development of a strain of spontaneously hypertensive rats. Jpn Circ J. 1963;27:282–293. doi: 10.1253/jcj.27.282. [DOI] [PubMed] [Google Scholar]
- Parkes LM. Tofts PS Improved accuracy of human cerebral blood perfusion measurements using arterial spin labeling: Accounting for capillary water permeability. Magn Reson Med. 2002;48:27–41. doi: 10.1002/mrm.10180. [DOI] [PubMed] [Google Scholar]
- Preuss TM. Do rats have prefrontal cortex? The Rose-Woolsey-Akert program reconsidered. Journal of Cognitive Neuroscience. 1995;7:1–24. doi: 10.1162/jocn.1995.7.1.1. [DOI] [PubMed] [Google Scholar]
- Rose JE, Woolsey CN. The orbitofrontal cortex and its connections with the mediodorsal nucles in rabbit, sheep, and cat. Research Publications Assocations for Research in Nervous and Mental Disease. 1948a;27:210–232. [PubMed] [Google Scholar]
- Rose JE, Woolsey CN. Structure and relations of limbic cortex and anterior thalamic nuclei in rabbit and cat. Journal of Comparative Neurology. 1948b;89:279–340. doi: 10.1002/cne.900890307. [DOI] [PubMed] [Google Scholar]
- Rose JE, Woolsey CN. Organization of the mammalian thalamus and its relationships to the cerebral cortex. Electroencephalography and Clinical Neurophysiology. 1949;1:391–403. [PubMed] [Google Scholar]
- Roy CS, Sherrington CS. On the regulation of blood supply of the brain. J Physiol. 1890;1:85–108. doi: 10.1113/jphysiol.1890.sp000321. [DOI] [PMC free article] [PubMed] [Google Scholar]
- Rubia K, Overmeyer S, Taylor E, et al. Hypofrontality in attention-deficit/hyperactivity disorder during higher-order motor control: A study with functional MRI. Am J Psychiatry. 1999;156:891–896. doi: 10.1176/ajp.156.6.891. [DOI] [PubMed] [Google Scholar]
- Russell V, Allie S, Wiggins T. Increased nonadrenergic activity in prefrontal cortex slices of an animal model for attention-deficit/hyperactivity disorder -- the spontaneously hypertensive rat. Behavioural Brain Research. 2000;117:69–74. doi: 10.1016/s0166-4328(00)00291-6. [DOI] [PubMed] [Google Scholar]
- Sagvolden T. Behavioral validation of the spontaneously hypertensive rat (SHR) as an animal model of attention-deficit/hyperactivity disorder (AD/HD) Neuroscience and Biobehavioral Reviews. 2000;24:31–39. doi: 10.1016/s0149-7634(99)00058-5. [DOI] [PubMed] [Google Scholar]
- Seidman L, Biederman J, Monuteaux MC, Doyle AE, Faraone SV. Learning disabilities and executive dysfunction in boys with attention-deficit/hyperactivity disorder. Neuropsychology. 2001;15:544–556. doi: 10.1037//0894-4105.15.4.544. [DOI] [PubMed] [Google Scholar]
- Sicard K, Shen Q, Brevard M, et al. Regional Cerebral Blood Flow and BOLD Response in Conscious and Anesthetized Rats Under Basal and Hypercapnic Conditions: Implications for fMRI Studies. J Cereb Blood Flow Metab. 2003;23:472–481. doi: 10.1097/01.WCB.0000054755.93668.20. [DOI] [PMC free article] [PubMed] [Google Scholar]
- Silva A, Lee S-P, Yang C, Iadecola C, Kim S-G. Simultaneous BOLD and perfusion functional MRI during forepaw stimulation in rats. J Cereb Blood Flow Metab. 1999;19:871–879. doi: 10.1097/00004647-199908000-00006. [DOI] [PubMed] [Google Scholar]
- Silva A, Williams D, Koretsky A. Evidence for the exchange of arterial spin-labeled water with tissue water in rat brain from diffusion-sensitized measurements of perfusion. Magn Reson Med. 1997a;38:232–237. doi: 10.1002/mrm.1910380211. [DOI] [PubMed] [Google Scholar]
- Silva AC, Zhang W, Williams DS, Koretsky AP. Estimation of water extraction fractions in rat brain using magnetic resonance measurement of perfusion with arterial spin labeling. Magn Reson Med. 1997b;37:58–68. doi: 10.1002/mrm.1910370110. [DOI] [PubMed] [Google Scholar]
- Spalletta G, Pasini A, Pau F, Guido G, Menghini L, Caltagirone C. Prefrontal blood flow dysregulation in drug naive ADHD children without structural abnormalities. J Neural Transm. 2001;108:1203–1216. doi: 10.1007/s007020170010. [DOI] [PubMed] [Google Scholar]
- Strupp JP. Stimulate: A GUI based fMRI analysis software package. NeuroImage. 1996;3:S607. [Google Scholar]
- Talagala SL, Ye FQ, Ledden PJ, Chesnick S. Whole-brain 3D perfusion MRI at 3.0 T using CASL with a separate labeling coil. Magn Reson Med. 2004;52:131–140. doi: 10.1002/mrm.20124. [DOI] [PubMed] [Google Scholar]
- Tarter RE, Kirisci L, Mezzich A, et al. Neurobehavioral disinhibition in childhood predicts early age at onset of substance use disorder. American Journal of Psychiatry. 2003;160:1079–1085. doi: 10.1176/appi.ajp.160.6.1078. [DOI] [PubMed] [Google Scholar]
- Wang J, Zhang Y, Wolf RL, Roc AC, Alsop DC, Detre JA. Amplitude-modulated continuous arterial spin-labeling 3.0-T perfusion MR imaging with a single coil: feasibility study. Radiology. 2005;235:218–228. doi: 10.1148/radiol.2351031663. [DOI] [PubMed] [Google Scholar]
- Wong EC, Buxton RB, Frank LR. Quantitative imaging of perfusion using a single subtraction (QUIPSS and QUIPSSII) Magn Reson Med. 1998;39:702–708. doi: 10.1002/mrm.1910390506. [DOI] [PubMed] [Google Scholar]
- Zaharchuk G, Ledden PJ, Kwong KK, Reese TG, Rosen BR, Wald LL. Multislice perfusion and perfusion-territory imaging in humans with separate label and imaging coil. Magn Reson Med. 1999;41:1093–1098. doi: 10.1002/(sici)1522-2594(199906)41:6<1093::aid-mrm4>3.0.co;2-0. [DOI] [PubMed] [Google Scholar]
- Zhang W, Silva A, Williams D, Koretsky A. NMR measurement of perfusion using arterial spin labeling without saturation of macromolecular spins. Magn Reson Med. 1995;33:370–376. doi: 10.1002/mrm.1910330310. [DOI] [PubMed] [Google Scholar]
- Zhou J, van Zijl PC. Effect of transit times on quantification of cerebral blood flow by the FAIR T1-difference approach. Magn Reson Med. 1999;42:890–894. doi: 10.1002/(sici)1522-2594(199911)42:5<890::aid-mrm8>3.0.co;2-8. [DOI] [PubMed] [Google Scholar]
- Zhou J, Wilson DA, Ulatowski JA, Traystman RJ, van Zijl PC. Two-compartment exchange model for perfusion quantification using arterial spin tagging. J Cereb Blood Flow Metab. 2001;21:440–455. doi: 10.1097/00004647-200104000-00013. [DOI] [PubMed] [Google Scholar]