

Abstract
The Pacinian channel has been implicated in the perception of fine textures (Hollins et al., Somatosens Mot Res 18: 253–262, 2001a). In the present study, we investigate candidate codes for Pacinian-mediated roughness perception. We use a Hall effect transducer to record the vibrations elicited in the skin when a set of textured surfaces is passively presented to the index finger. The peak frequency of the vibrations is found to decrease systematically as spatial period increases. The power of the vibrations—weighted according to the spectral sensitivity of the Pacinian system—increases with spatial period for all but the coarsest surfaces. By varying the scanning velocity, we manipulate the temporal and intensive characteristics of the texture-induced vibrations and assess the effect of the manipulation on perceived roughness. We find that doubling the scanning velocity does not result in the substantial decrease in roughness predicted by a frequency theory of vibrotactile roughness perception. On the other hand, the effects of speed on roughness match those of speed on power. We propose that the roughness of a fine surface (spatial period<200 μm) is a function of the Pacinian-weighted power of the vibrations it elicits.
Keywords: texture, vibration, roughness, power, Pacinian
Introduction
According to the duplex theory of tactile texture perception (Hollins et al., 1998, 2001a; Hollins and Risner, 2000), two distinct mechanisms underlie the tactile perception of texture. On the one hand, the perception of coarse textures, with elements more than 100 μm in size, is mediated by slowly adapting type I mechanoreceptive afferents (SA I). Perceived roughness of such textures is believed to be a function of the spatial variation in SA I afferent firing rates (Connor et al., 1990; Connor and Johnson, 1992; Blake et al., 1997; Yoshioka et al., 2001), although recent evidence suggests that temporal cues may also play a role (Cascio and Sathian, 2001; Gamzu and Ahissar, 2001). On the other hand, the perception of fine textures, with particle sizes less than 100 μm, is mediated by vibrotactile channels. As the exploring finger scans a finely textured surface (or the surface is scanned across the finger), vibrations are produced in the skin. These vibrations are then transduced by rapidly adapting mechanoreceptors in the skin (i.e., Pacinian or Meissner corpuscles), and it is on the basis of this vibrotactile signal that these textures are perceived.
Several lines of evidence implicate the vibrotactile channels in the perception of fine textures. First, when the finger is held in stationary contact with a fine texture so that vibrations are not produced, perception of the texture is impaired (Hollins and Risner, 2000). Second, a surface that is vibrating perpendicular to the scanning direction is perceived as rougher than an identical surface that is not vibrating (Hollins et al., 2001b). Third, vibrotactile adaptation reduces the perceived roughness of fine surfaces while having little effect on the perception of coarse surfaces (Hollins et al., 1998). Finally, adaptation of the PC channel impairs the discrimination of fine but not coarse textures (Hollins et al., 2001a).
All of these results taken together strongly suggest that the perception of fine textures relies on the vibrotactile system. However, the relation between the perceived texture of a surface and the physical characteristics of the vibrations it elicits in the skin is not clear. In other words, how does the vibrotactile system encode fine texture? In the present study, we seek to draw parallels between the features of the vibrations elicited by a textured surface and its perceived roughness.1
There are at least two ways in which aspects of vibration might underlie roughness perception. Roughness might be encoded intensively; that is, the intensity of the vibrations elicited in the skin during the exploration of a surface might determine its perceived roughness. Alternatively, roughness might be encoded temporally, in which case the frequency composition of the texture-induced vibrations determines perceived roughness (of course, these two hypotheses are not mutually exclusive). A third possibility, that the layout of textured surfaces is encoded spatially, as has been shown to be true for coarse textures (Lederman and Taylor, 1972; Taylor and Lederman, 1975; Connor et al., 1990; Connor and Johnson, 1992; Yoshioka et al., 2001), seems unlikely for theoretical reasons. The PC channel—unequivocally implicated in fine texture perception (Hollins et al., 2001a)—has very poor spatial resolution.
There is some evidence to suggest that vibrotaction-mediated roughness perception relies on an intensive code. Miyaoka et al. (1999) investigated subjects' ability to discriminate the roughness of fine abrasive papers with particle sizes ranging from 1 to 40 μm; they also had subjects discriminate the height of ridges, varying the ridge height of the standard from 6 to 25 μm. Miyaoka et al. (1999) hypothesized that, if roughness perception relied on amplitude information, difference thresholds in the roughness-discrimination experiment should be in the same range as those obtained in the height-discrimination experiment. Indeed, difference thresholds in the two conditions were of comparable magnitude. In addition, they noted that, at typical scanning velocities, the temporal frequencies presumably elicited by these surfaces were far beyond the range of frequencies that could be resolved by the vibrotactile system (i.e., greater than 1 kHz). A temporal code thus seemed unlikely. Miyaoka et al. (1999) concluded that these surfaces were discriminated on the basis of amplitude information.
In another study (Hollins et al., 2001b), subjects were presented with two surfaces, one of which was vibrating. It was found that subjects tended to perceive the vibrating surface as rougher than the stationary one. The tendency to judge the vibrating surface as rougher increased as the amplitude of the vibrations increased. Also, as would be predicted by an intensive theory of roughness, this effect was independent of the frequency with which the surface was vibrating (the intensity of the vibrations was equated in sensation level at all frequencies). A temporal theory of roughness perception might predict that a surface would be perceived as smoother as the frequency of the vibrations it elicits in the skin increases; fine surfaces tend to have lower spatial periods and thus elicit higher frequency vibrations than coarse ones at equivalent scanning velocities. Hollins et al.'s (2001b) results do not support this hypothesis.
The objective of the present study was to further evaluate prospective vibrotactile codes for roughness. Our strategy consisted of recording the vibrations elicited in the skin during the exploration of surfaces that systematically vary in the dimensions of their surface features, and drawing parallels between aspects of the texture-induced vibrations and their perceived roughness, as measured by means of magnitude estimation. In the first experiment, we examined how the frequency content of the textural vibrations varied with the spatial layout of the surfaces.
EXPERIMENT 1
Materials and methods
Stimuli
The textured surfaces were two-dimensional arrays of truncated pyramids, etched in silicon using photolithography and wet chemical etching. For a detailed description of how these surfaces were produced, see Hollins et al. (2001a). The pyramids covered the entire surface of the circular silicon wafers (diameter = 76.2 mm, thickness = 2 mm). The center-to-center distance between pyramids (or spatial period) in the x and y dimensions was four times the width of the top of a pyramid. Pyramid height, width and spatial period thus increased proportionally from one surface to the next.
We wished to include surfaces that fell within the vibrotactile range and others that fell within the SA I-mediated range. Eight surfaces were used in Experiments 1 and 2. Spatial periods were 16, 40, 80, 124, 184, 276 and 416 μm; the eighth surface was smooth and will be referred to as the “null” surface. Based on a previous study (Hollins and Risner, 2000), we predicted that the transition between PC-mediated and SA I-mediated roughness perception would occur for surfaces with spatial periods around 200 μm (see Discussion of Experiment 2 for rationale).
Apparatus
The textured surfaces were mounted on a belt driven by a gear motor (Bodine Electric Co., Chicago, IL). Motor speed was proportional to a DC voltage produced by a digital-to-analog converter (DAC) (CIO-DAS1602/16, ComputerBoards, Inc. Mansfield, MA), itself controlled by a computer (Dell OptiPlex GX1p, Round Rock, TX). Motor speed was measured via an encoder (RM15, RENCO Encoders Inc.. Goleta, CA), the output of which was sampled at 50 kHz by a 16-channel analog-to-digital converter (ADC) (CIO-DAS1602/16, Computer Boards, Inc.). To calibrate belt speed, a DC voltage was sent from the DAC to the motor and the speed was measured. If the speed was below the nominal speed, the signal from the computer was incremented; otherwise it was decremented. The calibration routine proceeded until belt speed was within 2% of its nominal value. The mean output signal for three such measurements was used to drive the belt for the recording protocol.
Vibrations elicited in the finger by the passive presentation of the textured surfaces were measured by means of a Hall effect transducer (HET) (type SS94A1F, Honeywell, Inc., Morristown, NJ). An HET produces a small current inversely proportional to the distance between it and a magnet. In these experiments, a small circular rare earth magnet (diameter = 5 mm, thickness = 1.6 mm) was secured to the center of the distal index finger pad by means of a thin layer of rubber cement. Vibrations generated in the fingertip by the textured surface thus traveled up the finger a short distance before causing the magnet to vibrate (see Fig. 1). The current produced in the HET as the magnet vibrated was amplified (CP302, Sable Systems, Las Vegas, NV), sampled at 50 kHz by the ADC, and stored to file. Unless otherwise specified, the HET was placed approximately 5 mm from the magnet. The position of the HET with respect to the magnet was varied only in order to ascertain the effects of distance on the amplitude of the currents produced in the HET as the magnet oscillated.
Figure 1.

Experimental setup. As the belt moves the surface across the finger, texture-induced vibrations travel a short distance up the finger from the plane of contact with the surface, setting the magnet in motion. The Hall effect transducer (HET) produces a small current inversely proportional to the separation between itself and the magnet. At rest, the separation between the magnet and HET is approximately 5 mm. The signal is then amplified and digitized.
The current elicited in the HET by a magnet vibrating at frequencies ranging from 10 to 640 Hz was measured in preliminary experiments. For these calibration measurements, the magnet was mounted on a vibrator (minishaker 4810, Bruel & Kjaer, Naerum, Denmark) driven by an arbitrary waveform generator (PCIP awfg, Keithley Metrabyte, Taunton, MA) via a power amplifier (type 2706, Bruel & Kjaer). The waveform of the vibrator was monitored via an accelerometer (type 4371, Bruel & Kjaer), the output of which was fed into a charge amplifier (type 2635, Bruel & Kjaer) and sampled at 50 kHz by the ADC.
We found that the current elicited in the HET by a magnet oscillating sinusoidally was also sinusoidal (as determined by visual inspection of the waveform and of its Fourier spectrum). If the baseline distance between the HET and the magnet was held constant, the amplitude of the HET output was proportional to the amplitude of the magnet's oscillations. The further the magnet was from the HET, the lower the amplitude of the HET current. The HET did not attenuate stimulus amplitude differentially with frequency. When the magnet vibrated according to a complex waveform consisting of superimposed sinusoids, the HET signal did not introduce any phase shifts. The HET thus preserved the stimulus waveform faithfully. These preliminary experiments served to verify that the signal elicited in the HET mirrored the movements of the magnet over time.
Subjects
The subjects were three male university students, ranging in age from 21 to 28 years. One subject was naive and was paid for his participation; one was a research assistant; the third was one of the authors (SJB). The three subjects participated in all the experiments reported here.
Procedure
Before a block of recordings, the surface was mounted and secured on a custom-made platform, itself fixed to the belt (see Fig. 1). The platform was 15 cm long and 5 cm wide. After a magnet had been attached tothe center of the subject's right distal index finger pad, the finger was secured using a clamp so that the fingertip rested lightly on the platform, approximately 4 cm ahead of the textured surface. In order to equate gain from recording to recording, the recording finger was fixed so that the distance between the magnet and the HET would remain constant during the recording block. The surface of the platform was flush and continuous with that of the stimulus (see Fig. 1). A trial began when the belt was set in motion, at a nominal speed of 2 cm/s. Three seconds after the belt began to move, belt speed was measured. One second later, sampling of the HET output was triggered and lasted 500 ms. Belt speed was once again measured 250 ms after the end of the sampling interval. If the mean of the two measured speeds fell outside of 5% of the desired speed, the trial was discarded. After the second speed measurement, the belt was stopped. During the period in which the motor was accelerating to its nominal value, the subject's finger was in contact with the supporting platform. It was only after the motor had reached full speed that the finger came into contact with the textured surface.
Since our objective was to relate texture-induced vibrations to the textural percept, it was necessary to ensure that the subject experienced the stimulus adequately on each recording trial. The subject was thus instructed tonotify the experimenter when he did not clearly perceive the textured stimulus. Recordings obtained on trials on which the subject did not feel the surface clearly were discarded.
On some runs, the subject reported making inadvertent finger movements during the sampling interval; these were sometimes much larger in amplitude than the texture-induced vibrations (as determined by inspecting the records). In order to discard trials in which finger movements overshadowed the vibrations without relying on the subjects' reports in deciding when to do so, we devised a winnowing procedure that identified outlier recordings and discarded them. The winnowing process was effected once 20 recordings were obtained for a given surface.
First, the Fourier transform of each of the 20 recordings was computed using the one-dimensional fast Fourier transform algorithm in Matlab (version 5.3.1, The Mathworks, Inc., Natick, MA). The Fourier spectrum of each recording for frequencies ranging from 2 to 1,500 Hz was then derived by calculating the complex modulus of each element of its Fourier transform. Because the HET output was sampled for 500 ms, the frequency resolution of the Fourier transforms and spectra was 2 Hz. To compensate for small run-to-run variations in the distance between the subject's finger and the HET, the Fourier spectrum of each recording was normalized by dividing the amplitude of each component by the mean amplitude for frequencies between 2,000 and 4,000 Hz. We found during pilot testing that the mean spectral amplitude in this frequency range was insensitive tothe textured stimulus presented but increased as the distance between the magnet and the HET decreased. The spectra were partitioned into 10 Hz bins, the amplitudes of Fourier components within a bin being averaged. The Fourier spectra were binned in order tomake them less susceptible tosmall variations in motor speed.
The mean and standard deviation, across recordings, were computed for each bin. If the amplitude of 10% or more of the bins in a given record fell more than two standard deviations from their respective means, the recording was replaced. Winnowing proceeded until 20 recordings met the criterion. The end of the winnowing process marked the end of a recording block. On average, four outliers were discarded per recording block. For each subject, there was one recording block per surface. A set of null recordings was also obtained in the same experimental session as the set of textured surface recordings for which it served as a control. There were 2–3 blocks per session, one or two with textured surfaces, and one with the null surface. Null recordings were also winnowed.
In separate recording blocks, we measured the force subjects exerted on the surfaces by placing a load transducer (Model 13/ 2446-06, Sensotec, Columbus, OH) under the surface holder (Fig. 2). We computed the correlation between load and spatial period for the two subjects who participated in these calibration experiments and found the correlations to be non-significant at the 0.05 level; both subjects applied approximately the same amount of force regardless of which surface was presented. The mean load was 11 g.
Figure 2.

Mean scanning force as a function of spatial period for subjects S and M (bars show standard error of the mean). Subjects appeared to apply approximately the same amount of force regardless of which surface was presented.
Data analysis
The data consisted of 20 recordings from each of the 7 textured surfaces for each of the 3 subjects and 4–5 sets of 20 null recordings.
Many factors other than the vibrations produced in the skin by the textured surface might theoretically have contributed to the recorded signal: physiological tremor, inadvertent movement of the finger, noise produced by the moving belt, noise in the amplifier, etc. The low-frequency noise (< 30 Hz), most likely a result of the first three factors, was especially problematic because its amplitude was large compared with the signal produced by the texture-induced vibrations. In order to extract signal from noise, we compared recordings obtained from textured surfaces with those obtained from the null surface. The experimental protocol and sources of noise were identical in both cases.
Since the vibrotactile system is sensitive to vibrations only up to about 1,000 Hz, we deemed it sufficient to examine the binned Fourier spectra of the recordings up to 1,500 Hz. We performed t-tests to compare the mean amplitudes of the 150 bins of the Fourier spectra of the 20 texture records to those of the corresponding bins of the Fourier spectra of the null records. Given the number of tests, we used Bonferroni adjustments to correct for Type-I error (base α-level = 0.01, corrected α-level = 6.67e–5), and because the texture and null spectral components did not have equal variance, we adjusted the degrees of freedom using Sattherwaite's approximation.
There is strong evidence that fine texture perception is mediated by the Pacinian system (Hollins et al., 2001a). Thus, information about the frequency content of texture-induced vibrations, if it is available at all, must be conveyed through this mechanoreceptive channel. Because Pacinian sensitivity is highly frequency dependent, the ability of a given frequency component to entrain Pacinian neurons is a function of both its amplitude and frequency. We thus wished to express the frequency content of the vibrations in terms of the spectral profile of the Pacinian system. To this end, we divided the noise-corrected spectra by Pacinian threshold (obtained from Bolanowski et al.'s (1988) psychophysical thresholds and extrapolated linearly to 1,500 Hz) so the magnitudes of the spectral components were expressed in terms of their relative ability to stimulate this system.
Results
Figure 3 shows raw records obtained from the 124 and 416 μm surfaces. Both records show a clear periodicity; the vibrations produced by the 124 μm surface are higher in frequency and lower in amplitude than those produced by the 416 μm surface.
Figure 3.

Records obtained from the 124 and 416 μm surfaces (subject S). The peak-to-peak amplitudes of the vibrations are approximately 4 and 11 μm for the 124 and 416 μm records, respectively.
Figure 4 shows the mean difference in amplitude between the Fourier spectra of each of six textured surfaces and those of the null surface, divided by Pacinian threshold, for one of the subjects (the data for the 16 μm surface are not shown and will be considered in the Discussion). The other two subjects showed the same pattern of results. For purposes of clarity, only significant positive differences in mean are reported (see Data analysis).2 The figure indicates that, as spatial period increases, the frequency of the largest spectral components systematically decreases.
Figure 4.

Significant differences between the mean Fourier spectrum of six of the textured surfaces and the null spectrum, divided by Pacinian threshold (arbitrary units). Data for subject M are shown. The frequency of the largest spectral components tends to decrease as the spatial period of the surface increases. Note that, since the peak amplitudes tended to increase with spatial period, the ordinates are scaled accordingly. Arrowheads denote the natural frequencies of the surfaces.
We examined quantitatively how “peak frequency” varied as a function of spatial period. The peak frequency corresponding to a given surface was the frequency of the largest Fourier component after subtraction of the null spectrum and Pacinian weighting. The peak frequency of each surface was then compared with its natural frequency, i.e., to the rate at which surface elements will be scanned under a given point on the skin. Natural frequency is proportional to belt speed and inversely related to spatial period:
| (1) |
where F is the natural frequency, vbelt is the velocity of the belt, and Ps is the spatial period.
As can be seen in Fig. 5, the values of the observed peak frequencies coincide with the natural frequencies (denoted by arrowheads in Fig. 4) for all but the finest texture. The only deviations occur for the 16 μm surface, for which peak frequencies are substantially lower than the natural frequency (1,250 Hz). In all other cases, the observed peak frequencies are within 5% of their expected value.
Figure 5.

Peak frequency vs spatial period. Peak frequency tends to decrease as spatial period increases: for all but the finest surfaces, the observed peak frequency coincided with the natural frequency. Some evidence suggests that the exceptions are due to low signal-to-noise ratios for the finest surfaces. (The missing data correspond to conditions in which there were no significant differences between the texture spectra and the null spectra. The signal-to-noise ratio was too low for the differences between the two sets of spectra to be resolved by means of statistical inference.)
Discussion
The main result of Experiment 1 was that the peak frequency for each surface was consistent from subject to subject and coincided with the natural frequency for all but the finest texture. Results obtained from that texture, namely the 16 μm surface, were not consistent across subjects as shown from the variability in peak frequencies observed in Fig. 5. Two factors may have contributed to this lack of agreement. First, the amplitude of the peak frequency component for this surface was very small (the height of the pyramids was only 4 μm). This component may thus have not been large enough to be resolved using inference testing. Secondly, because the natural frequency of this surface was 1,250 Hz, the peak frequencies observed in single recordings were expected to range from 1,187.5 to 1,312.5 Hz as the motor speed fluctuated by as much as 5%. So not only was the amplitude small, but the spectral power of this component was spread over 125 Hz—or 12 frequency bins—across recordings. These factors may also have contributed to the fact that we did not observe any significant differences between the 40 μm and the null surface for subject M.
We found, then, that the frequency content of the recordings obtained from the six textured surfaces tended to vary systematically with spatial period; for all but the finest surface, the observed peak frequency coincided with the natural frequency computed from the speed of the belt and the spatial period of the surface (Equation (1)). Information about texture may therefore be conveyed via the frequency content of the vibrations produced as the surface is run across the finger: the greater the spatial period, the lower the peak frequency of the elicited vibrations.
One cannot conclude, however, that texture perception relies on a temporal code; the intensity of the texture-induced vibrations also tends to increase with spatial period (see Figs. 3 and 4). Because spatial period and element size increase in proportion, one might expect that it should be so. However, since recordings from different surfaces were obtained in separate sessions, we could not quantitatively compare the intensity of the vibrations produced by one surface with those produced by another; the position of the magnet probably differed slightly from session to session, as did the distance between the magnet and the HET.
In the second experiment, we obtained recordings from all eight surfaces in a single recording block so that the position of the magnet on the finger and the distance between the magnet and the HET were held constant across stimuli. The experimental procedure allowed us to more accurately observe how the intensity of the vibrations grew as spatial period increased. We adopted power as a measure of stimulus intensity as it is well suited to characterize complex waveforms along the intensive dimension (Marks, 1979; Makous et al., 1995). We also obtained psychophysical measurements of roughness to examine how perceived roughness varied with spatial period.
The primary objective of Experiment 2 was to evaluate the viability of an intensive theory of roughness perception for finely textured surfaces. Our approach consisted of measuring how vibratory power and perceived roughness each varied as a function of spatial period, and then evaluating whether the effect of spatial period on roughness could be explained in terms of its effect on power. According to an intensive theory of roughness perception, the effect of spatial period on roughness should be mediated by its effect on power for textures in the vibrotactile range.
EXPERIMENT 2
Materials and methods
Subjects
The subjects were the three subjects who participated in Experiment 1 and two (naive) female university students aged 27 and 30 years old who were paid for their participation. These five subjects also participated in Experiment 3.
Recording
The recording protocol was similar to that in Experiment 1, except that all the surfaces were presented within each recording block. Each recording trial proceeded as in Experiment 1. Five recordings were obtained consecutively from each surface in each block. The surfaces were presented in pseudo-random order. For each subject, there were a total of 5 recording blocks, yielding 25 recordings for each of the 8 surfaces. No winnowing was effected on these sets of recordings.
Psychophysics
Surfaces were presented using the same procedure and apparatus as in the recording experiments, excluding the magnet and the HET. Subjects wore goggles covered with lens paper to eliminate visual cues of surface texture while allowing them to orient themselves during the psychophysical task. They also were presented pink noise through earphones to eliminate auditory cues of surface texture. They were instructed to produce numbers proportional to the perceived roughness of the surfaces. There were six blocks of trials per subject, each consisting of one presentation of each of the eight surfaces in pseudo-random order. The first block was a practice block and was not included in the analysis. Inter-trial periods lasted between 15 and 25 s.
Data analysis
We have previously found that roughness perception for fine textures is mediated by the Pacinian system (Hollins et al., 2001a). We therefore wished to express the intensity of the texture-induced vibrations in terms of their efficacy in exciting this receptor system. There is evidence to suggest that the Pacinian channel is analogous to a critical band in the auditory system (Marks, 1979; Makous et al., 1995). According to the critical band hypothesis, the Pacinian channel integrates stimulus power over time. The relative power of each Fourier component in a complex stimulus is weighted according to the spectral sensitivity of the Pacinian system at that component's frequency. The total power of the stimulus is computed by summing all the elements in the resulting weighted power spectrum (Makous et al., 1995).
Working within the framework advanced by Makous et al. (1995), the power spectrum of the vibrations was first multiplied by a filter that mirrored the spectral sensitivity of the Pacinian system. To compute the relative power spectrum of each recorded vibration, we squared each element Fi of its Fourier spectrum and multiplied it by the square of its frequency . The filter, Hi, was obtained by taking the inverse of Pacinian threshold power at each frequency and setting the maximum sensitivity to 1 by multiplying the inverted threshold power spectrum by the lowest threshold power (cf. Makous et al., 1995):
| (2) |
where Ti is the Pacinian threshold at frequency fi = 2i (each frequency bin is 2 Hz wide) interpolated from Bolanowski et al. (1988) and extrapolated linearly to 1,500 Hz.3 We then summed the elements of the resulting weighted power spectrum for frequencies up to 1,500 Hz. Frequencies above 1,500 Hz were eliminated as they fall outside the range of sensitivity of the vibrotactile system. Pacinian-weighted power, PPC, was then given by
| (3) |
where Fi is the amplitude of the Fourier component at frequency fi. PPC was computed for each of the 25 recordings obtained from each surface. Relative stimulus power was normalized within each recording block by dividing PPC for each recording by the median power across all surfaces for that block. The power of the vibrations obtained in the null condition corresponded to baseline noise that was not associated with surface roughness. We thus subtracted the median null power for each recording block from the corresponding median power obtained from each surface to obtain an adjusted measure of Pacinian-weighted power, Padj. We report medians rather than means because the data contained a few outliers that would have substantially skewed the results.
Psychophysical ratings were normalized within subjects by dividing by the mean roughness rating across surfaces.
Results
Figure 6 shows that the Pacinian-weighted power of the texture-induced vibrations tends to increase with spatial period up to 184 μm; power then decreases slightly for the 276 μm surface and increases again for the 416 μm surface. (The slight decrease in power at 276 μm was observed in the data obtained from each of the five subjects.) For the fine surfaces (spatial period < 200 μm), there are no systematic deviations from monotonicity in the individual functions relating power to spatial period.
Figure 6.
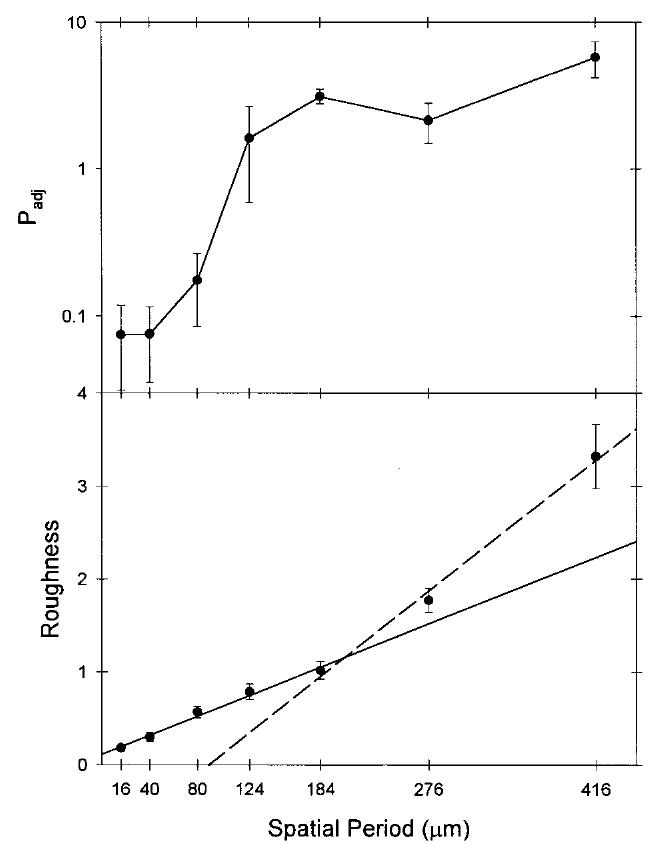
Median power and mean roughness vs spatial period. Power was normalized and corrected for baseline noise as described in the text. Power is plotted on a logarithmic scale and roughness on a linear scale because we find roughness to increase with the log of power (see General discussion).
Figure 6 shows that roughness increases as spatial period increases across the range of textures. Roughness appears to be a two-branched function of spatial period with the transition around 200 μm. The slope for roughness is approximately twice as steep in the coarse range (> 200 μm) as it is in the fine range (< 200 μm).
Mean roughness ratings for the “null” surface were not significantly different from zero for any subject (and in fact were equal to zero for three of the five).
Discussion
Based on results obtained in a previous study (Hollins and Risner, 2000), we had predicted the transition between vibrotaction-mediated and SA I-mediated roughness perception to occur for surfaces with spatial periods around 200 μm. Hollins and Risner (2000) found that the function relating roughness to particle size was flat for particle sizes up to 100 μm when movement between finger and surface was eliminated; in other words, when texture-induced vibrations were abolished, sandpapers with particle sizes up to 100 μm were perceived as equally rough (or smooth). Hollins and Risner (2000) concluded that roughness perception for these fine surfaces relies on vibrotaction. Gamzu and Ahissar (personal communication) inspected a subset of the sandpapers used by Hollins and Risner under a microscope and estimated their median spatial frequencies. Based on their findings, we estimate that a sandpaper with 100 μm particle size—the value at which the transition between vibrotaction- and SA I-mediated vibrotaction occurred in Hollins and Risner's study—would have a median spatial period of approximately 200 μm. In Experiment 2, we found an inflection in the function relating roughness to spatial period at around 200 μm. This inflection point may also correspond to the transition between vibrotaction- and SA I-mediated roughness perception.
Yoshioka et al. (2001) found that a spatial code for roughness—specifically spatial variation in SA I afferent firing rates—was viable for gratings with spatial periods as low as 100 μm. However, only one surface in their study had a spatial period of less than 200 μm. It is an open question, therefore, whether the spatial code they propose can distinguish between textures in the vibrotactile range.
We found that power increased monotonically with spatial period for spatial periods up to 184 μm. Since roughness was also found to increase with spatial period, power is a viable code for roughness for surfaces with spatial periods up to about this value. As discussed above, this corresponds to the vibrotaction-mediated range of textures as specified in Hollins and Risner (2000).
However, results from Experiment 1 are consistent with the idea that roughness might be a function of the frequency content of the vibrations. In the first experiment, we found that peak frequency decreased as spatial period increased; the increase in roughness with spatial period observed in Experiment 2 may thus be due to the concomitant decrease in frequency. Experiments 1 and 2 thus fail to discriminate between two alternative theories of fine texture perception, one temporal, the other intensive. Specifically:
The perceived roughness of a (fine) texture might be a function of the frequency of the vibrations that it induces in the skin as the finger moves across it. The lower the frequency of the vibrations, the rougher the percept of the surface (Experiment 1).
Alternatively, the perceived roughness of a (fine) surface might be a function of the intensity of the vibrations it induces in the skin as the finger moves across it. The higher the intensity of the vibrations, the rougher the percept of the surface (Experiment 2).
The objective of the third experiment was to distinguish between these two possibilities.
EXPERIMENT 3
In order to discriminate between temporal and intensive theories of fine roughness perception, we varied the conditions of stimulus presentation so that two experimental conditions produced contrasting effects on the temporal and intensive characteristics of the vibrations. Specifically, we presented two surfaces at two scanning velocities (by varying belt speed) and observed how this manipulation affected (1) the perceived roughness of the surfaces and (2) the relative power of the vibrations they elicited.
In Experiment 1, we found that the observed peak frequency in the Fourier spectra of all but the finest textures coincided with the natural frequency of the surface (Fig. 5). Results from Experiment 1 are consistent with the idea that both natural frequency and observed peak frequency were linear functions of belt speed (Equation (1)). According to a temporal theory of roughness perception, then, increasing the scanning velocity should result in a decrease in perceived roughness because it leads to an increase in peak frequency (see Fig. 5).
In contrast, the intensive theory predicts—based on the frequency profile of the Pacinian system—that the perceived roughness of the coarser surface (spatial period = 184 μm) would increase as belt speed doubled, while that of the fine surface (spatial period = 80 μm) would decrease. The natural frequency of the 184 μm surface is about 108 Hz at 2 cm/s and about 216 Hz at 4 cm/s. The PC channel is almost 16 times more sensitive at 216 Hz than it is at 108 Hz (Bolanowski et al., 1988). Thus, unless the amplitude of the natural frequency component decreased more than fourfold (and thus its power decreased more than 16-fold) at 4 cm/s, the Pacinian-weighted power of the vibrations would increase as belt speed increased. The natural frequency of the 80 μm surface increases from 250 to 500 Hz when belt speed doubles from 2 to 4 cm/s. The PC channel is more than three times as sensitive at 250 Hz than it is at 500 Hz. We thus expected the Pacinian-weighted power of the vibrations produced by this surface tobe lower at 4 cm/s than at 2 cm/s. In statistical terms, the temporal hypothesis thus predicted a main effect of speed, while the intensive hypothesis predicted a surface×speed interaction. Figure 7 summarizes the predictions of the two hypotheses.
Figure 7.
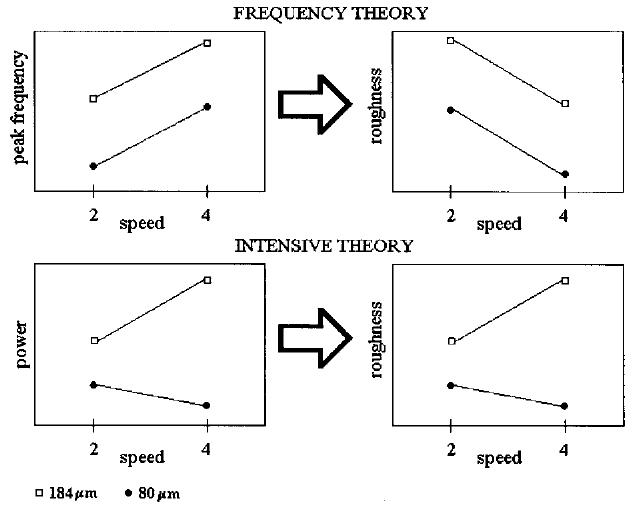
Predictions derived from the frequency and intensive theories of roughness perception. The frequency theory predicts that the roughness of both surfaces will decrease as speed is doubled. The intensive theory predicts that the roughness of the coarse surface will increase while that of the fine surface will decrease as belt speed is doubled. In statistical terms, the frequency theory predicts a main effect of speed while the intensive theory predicts a surface×speed interaction.
Previous studies using coarse surfaces have shown that varying scanning velocity has a negligible effect on perceived roughness (Lederman, 1974, 1983; but see Cascio and Sathian, 2001). If we obtained a similar result with fine surfaces, we would be forced to revise our theories of vibrotactile roughness perception.
In Experiment 3, two surfaces were presented at two belt speeds. Roughness ratings were obtained for both surfaces in both velocity conditions, as were recordings of the vibrations elicited in the finger by the surfaces. The objective of the experiment was to ascertain whether perceived roughness varied with the temporal characteristics of the texture-induced vibrations (i.e., with peak frequency) or with their intensive characteristics (i.e., with relative power). A third possibility, of course, was that roughness was a function of both frequency and intensity.
Materials and methods
Recording
The recording protocol was identical to that in Experiment 2, except that only two surfaces, with spatial periods 80 and 184 μm, were presented in each recording block. Each surface was scanned across the finger at two velocities, 2 and 4 cm/s. An experimental block consisted of five recordings from each surface at each scanning velocity. There were five blocks per subject. In addition, 25 recordings were obtained from the null surface in each velocity condition, in separate recording blocks, as a baseline measure of noise.
Psychophysics
The psychophysical procedure was the same as that employed in Experiment 2. The subject was presented with either the 80 or the 184 μm surface at either 2 or 4 cm/s and was instructed to produce a number proportional to the perceived roughness of the surface. Subjects produced six ratings for each surface in each velocity condition. The first set of ratings was for practice and was not included in the analysis.
Data analysis
The surfaces in Experiment 3 were chosen so that they excited primarily the Pacinian system. Again, we expressed the intensity of the vibrations produced by these surfaces in terms of their efficacy in exciting this receptor system (see Equations (2) and (3)). Values of PPC for each recording were normalized within block by dividing each PPC by the median power for the recording block.
In the absence of texture, experimental noise, as indexed by PPC obtained from the null surface, was greater in the fast condition than in the slow condition. Our estimate of stimulus intensity for each [surface, velocity] condition was the median difference between the value of PPC obtained in that condition and the value of PPC obtained in the corresponding null condition.
Since the null recordings were obtained in separate blocks from the surface recordings, we could not meaningfully pair surface recordings with null recordings. So, for each subject, we computed the difference between each of 25 values of PPC from each surface condition with each of 25 values of PPC from the null condition at the corresponding speed to produce 625 adjusted measures of Pacinian-weighted power, Padj.4 The values of Padj were then normalized within subjects by dividing by the grand median across surface and velocity conditions. The medians of median values of Padj obtained from the five subjects are reported in Fig. 8.
Figure 8.

Experiment 3 results. Median power and mean roughness vs belt speed.
In order to avoid making undue assumptions about the distributions of Padj (see Appendix), we used a bootstrapping approach (Efron and Tibshirani, 1993) to test the reliability of the main effects of surface (80 vs 184 μm) and speed (2 vs 4 cm/s) and their interaction on relative power. Treating all 3,125 observations (625×5) in each [surface, velocity] condition as sampled from the same population, we generated empirical sampling distributions of the median of Padj (N = 25) and derived the number of times the median in one condition (say, 4 cm/s for each surface) was higher than that in the other (2 cm/s for each surface). If two conditions yielded identical distributions, the proportion of times that the median was greater in one condition than in the other would be 0.5. The closer to 0 or 1 this proportion was, the larger the effect, i.e., the more reliably different the medians were. A similar approach was used to test the reliability of the surface×speed interaction. The method is described in detail in the Appendix.
The mean of the five magnitude estimates of roughness was computed for each [surface, velocity] condition. A subject×surface×velocity (5×2×2) ANOVA was performed to test the significance of the main effects of surface and speed and their interaction while accounting for individual differences.
Results
Figure 8 shows relative power and magnitude estimates of roughness obtained in the four [surface, velocity] pairs (median values of Padj and mean psychophysical ratings). Power and roughness are consistently greater for the 184 μm surface than for the 80 μm surface. Inference testing by bootstrapping reveals that the main effect of surface on Padj is reliable while the ANOVA shows that the main effect of surface on roughness is highly significant (see Table 1).
Table 1.
p-Values for the two main effects and the interaction obtained from the ANOVA on the psychophysical data and analogous values derived for our measure of Pacinian-weighted power, Padj, using the bootstrapping approach described in the Appendix
| Surface | Speed | Interaction | |
|---|---|---|---|
| Roughness | 0.011 | 0.32 | 0.020 |
| Power | 0.0015 | 0.43 | 0.019 |
The bootstrapping procedure reveals that the effect of speed on Padj is not reliable; correspondingly, the main effect of speed on roughness is not significant. The surface×speed interaction is, however, reliable in both the recording and the psychophysical data.
Contrary to the predictions of the temporal hypothesis, then, we did not find a main effect of speed on power. However, when belt speed was doubled, both power and roughness tended to decrease for the fine surface and increase for the coarse surface, as predicted by the intensive hypothesis (see Fig. 7). This surface×speed interaction was statistically reliable in both the power and roughness data. The results from Experiment 3 are thus incompatible with the temporal hypothesis and support the intensive hypothesis.
Discussion
In Experiment 1, we found that peak frequency is inversely proportional to spatial period. In Experiment 2, we found that the roughness of the fine surfaces increases with spatial period. According to the temporal theory of roughness, then, the roughness of both the 80 and 184 μm surfaces should substantially decrease when the speed at which the surface is scanned across the finger is doubled (see Fig. 7). Results from Experiment 3 do not support the frequency hypothesis, as we observed no main effect of speed on roughness. On the other hand, the effect of belt speed on roughness conformed with the predictions of the intensive theory (Fig. 7) and matched the effect of speed on power. The results from Experiment 3 thus strongly support an intensive theory of vibrotaction-mediated roughness perception.
General discussion
The combined results of Experiments 1 and 2 suggested two alternative theories of roughness perception for fine textures. Roughness could either be a function of the frequency content of the texture-induced vibrations, or it could be determined by the intensity of these vibrations. In Experiment 3, we found that the frequency hypothesis did not hold because increasing the belt speed did not result in a consistent decrease in roughness. On the other hand, the effect of speed on Pacinian-weighted power mirrored that on roughness.
Figure 9 shows a plot of roughness vs power, each measure normalized within subjects, using data from Experiments 2 and 3 (only data from surfaces with spatial periods < 200 μm are included from the results of Experiment 2). We found that perceived roughness increased monotonically with Pacinian-weighted power. Specifically, a logarithmic model relating roughness to power accounted for 72% of the variance in the data (F=94.52, p< 0.001). The strong relation between roughness and power further supports the intensive theory.
Figure 9.
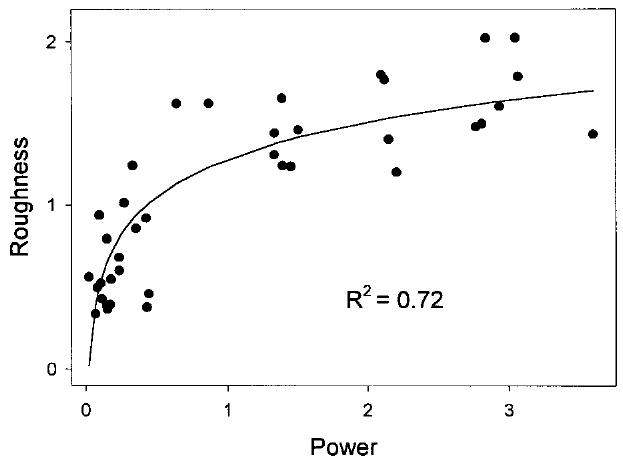
Roughness vs Padj from Experiments 2 and 3. Only data from surfaces with spatial periods<200 μm are included from the results of Experiment 2. The model (roughness = 1.3+0.76·log(Padj)) accounts for 72% of the variance in the data (F=94.52, p<0.001).
The Pacinian system has been unequivocally implicated in roughness perception for fine textures: high-frequency adaptation abolishes the ability to discriminate the roughness of fine surfaces while low-frequency adaptation has no measurable effect on performance using the same surfaces (Hollins et al., 2001a). Padj expresses the intensity of vibrations in terms of their efficacy in exciting the Pacinian system; the firing rate of Pacinian afferents increases as Pacinian-weighted power increases. In fact, when we converted Bolanowski and Zwislocki's (1984) plots relating Pacinian firing rates to stimulus amplitude into plots of firing rates vs Pacinian-weighted power, we found that firing rates increased as a logarithmic function of power. Because roughness was also found to increase as a logarithmic function of Pacinian-weighted power, we propose that roughness increases as a linear function of Pacinian firing rates.
The results of the present study suggest, then, that Pacinian firing rates should increase linearly with spatial period up to about 200 μm. For coarser surfaces, the relation between Pacinian activity and roughness breaks down. Indeed, previous studies have shown that there is no relation between Pacinian firing rates and the perceived roughness of coarse surfaces (Connor et al., 1990; Yoshioka et al., 2001).
We propose that the roughness of fine textures is a function of the power of the vibrations they elicit in the skin. As power increases, firing rates of Pacinian afferents increase, leading to increasingly rough percepts. For coarser textures (spatial period >200 μm), roughness becomes a function of spatial variation in SA I afferent firing (cf. Connor et al., 1990; Connor and Johnson, 1992; Blake et al., 1997; Yoshioka et al., 2001). The psychophysical function relating roughness to spatial period shows a point of inflection around 200 μm, further supporting the hypothesis that this texture scale marks a transition between the operative range of two perceptual mechanisms (cf. Hollins and Risner, 2000).
Conclusions
Most everyday textures comprise both micro- and macro-elements. According to the duplex theory of texture perception (Hollins et al., 1998), textures are perceived at two grains, each mediated by a distinct receptor system. For surfaces comprising coarse textural features, roughness is primarily determined by the spatial variation elicited in SA I afferent firing (Connor et al., 1990; Connor and Johnson, 1992; Blake et al., 1997; Yoshioka et al., 2001). The present results suggest that Pacinian-mediated roughness perception—i.e., roughness perception for surfaces consisting primarily of fine textural elements—relies on intensive rather than frequency information:
Increasing the scanning velocity did not result in an overall decrease in roughness predicted by a frequency theory. Rather, the effect of speed on roughness matched that on power (Fig. 8).
Roughness appears to increase as a logarithmic function of Pacinian-weighted power. As Pacinian firing rates seem to also increase logarithmically with Pacinian-weighted power, we propose that roughness may increase linearly with Pacinian firing rates (Fig. 9).
Furthermore, results from Experiment 2 provide further information as to the operative ranges of the two perceptual mechanisms involved in roughness perception. Our data suggest that the transition between vibrotaction-mediated and SA I-mediated roughness perception occurs for surfaces with spatial period around 200 μm. We hope that situating the transition region will help guide future research contrasting the two mechanisms.
Acknowledgments
This work was supported by NIDCR grant DE-07509. We wish to thank Marcus Johnson for his assistance in data collection and Kerry LeDoux for careful reading of the manuscript.
Appendix
Given the skewness of the distribution of Padj, we used medians rather than means as estimates of centrality for our power measure. We generated empirical sampling distributions of the median of Padj and found that these deviated substantially from the Normal distribution. Thus, in order to obtain statistical measures of the strength of the main effects of surface (80 vs 184 μm) and speed (2 vs 4 cm/s) and their interaction without making unsound assumptions about the distribution of Padj, we invoked a bootstrapping approach to inference testing (Efron and Tibshirani, 1993):
For each subject, we exhaustively combined each of 25 values of PPC obtained in each [surface, velocity] condition with each of 25 values of PPC obtained from the null surface in the corresponding speed condition, yielding a total of 625 observations of the adjusted Pacinian-weighted power Padj.
We then generated sampling distributions of the median Padj for each [surface, velocity] pairs by randomly sampling 25 of the 3125 (625 × 5) values of Padj obtained from the 5 subjects and computing the median of that sample.5 One million such medians were computed for each of the four [surface, velocity] pairs.
We tallied the number of times the sampled median for each surface at 4 cm/s was greater than the sampled median for that surface at 2 cm/s. From the combined tally for both surfaces, we derived a statistical estimate (defined below) of the strength of the main effect of speed.
We tallied the number of times the sampled median for one surface was greater than the sampled median for the other surface at the same speed. From the combined tally for both belt speeds, we derived a statistical estimate of the strength of the main effect of surface.
We tallied the number of times the difference between the sampled median of [80 μm, 4 cm/s] and that of [80 μm, 2 cm/s] was greater than the difference between the sampled median of [184 μm, 4 cm/s] and that of [184 μm, 2 cm/s]. From this tally, we obtained a statistical estimate of the strength of the surface×velocity interaction.
The statistical measure we obtain for each main effect is the probability that the median (of sample size 25) of one experimental group is greater, given our data, than that of another. If two groups are identical, then the proportion of times one group median will be greater than the other will be around 0.5. If one measure is always greater than the other, that proportion will be 0 or 1. A measure of the interaction is simply the proportion of times the difference between the sampled median of [80 μm, 4 cm/s] and that of [80 μm, 2 cm/s] was greater than the difference between the sampled median of [184 μm, 4 cm/s] and that of [184 μm, 2 cm/s]. If there is no interaction, that proportion should be around 0.5. If there is a strong interaction, it should be either near 0 or near 1, depending on the direction of the interaction. These statistical estimates are comparable to p-values in standard inference tests in that they reflect the reliability of the effects being tested. The measure of the reliability of the main effect of speed is given by
| (A1) |
where is the median Pacinian-weighted power of surface x at speed y (sample size = 25). The measure of the reliability of the main effect of surface is given by
| (A2) |
And the measure of the reliability of the interaction is given by
| (A3) |
or
| (A4) |
whichever is less. A numerically equivalent measure of the reliability of the interaction is given by
| (A5) |
or
| (A6) |
Footnotes
We focus on roughness as it is one of the better characterized dimensions in texture perception. In a set of ongoing experiments, we are investigating the relation between vibrations and other aspects of texture, such as stickiness, hardness, etc.
There were usually no significant negative differences between surface and null spectra. In a few cases, one or more low-frequency components (<30 Hz) were significantly larger in the null than in the surface spectra.
Rather than deriving an individual threshold–frequency function for each subject, we used Bolanowski et al.'s (1988) psychophysical function for all five subjects. We carried out the same analyses using other threshold functions to ensure that our results were not an artifact of that particular threshold curve and obtained equivalent results.
In order to express the noise and surface recordings in the same metric, we multiplied the surface values of PPC—normalized within block—by the grand median across surface and velocity conditions. Similarly, the noise values of PPC were normalized within block and multiplied by the grand median noise power.
We used a sample size of 25 because there were 25 values of PPC in each condition for each subject. In the absence of a noise adjustment, then, each cell would have contained 25 samples.
References
- Blake DT, Hsiao SS, Johnson KO. Neural coding mechanisms in tactile pattern recognition: the relative contributions of slowly and rapidly adapting mechanoreceptors to perceived roughness. J Neurosci. 1997;17:7480–7489. doi: 10.1523/JNEUROSCI.17-19-07480.1997. [DOI] [PMC free article] [PubMed] [Google Scholar]
- Bolanowski SJ, Gescheider GA, Verrillo RT, Checkosky CM. Four channels mediate the mechanical aspects of touch. J Acoust Soc Am. 1988;84:1680–1694. doi: 10.1121/1.397184. [DOI] [PubMed] [Google Scholar]
- Bolanowski SJ, Zwislocki JJ. Intensity and frequency characteristics of pacinian corpuscles. I. Action potentials. J Neurophysiol. 1984;51:793–811. doi: 10.1152/jn.1984.51.4.793. [DOI] [PubMed] [Google Scholar]
- Cascio CJ, Sathian K. Temporal cues contribute to tactile perception of roughness. J Neurosci. 2001;21:5289–5296. doi: 10.1523/JNEUROSCI.21-14-05289.2001. [DOI] [PMC free article] [PubMed] [Google Scholar]
- Connor CE, Hsiao SS, Phillips JR, Johnson KO. Tactile roughness: neural codes that account for psychophysical magnitude estimates. J Neurosci. 1990;10:3823–3836. doi: 10.1523/JNEUROSCI.10-12-03823.1990. [DOI] [PMC free article] [PubMed] [Google Scholar]
- Connor CE, Johnson KO. Neural coding of tactile texture: comparison of spatial and temporal mechanisms for roughness perception. J Neurosci. 1992;12:3414–3426. doi: 10.1523/JNEUROSCI.12-09-03414.1992. [DOI] [PMC free article] [PubMed] [Google Scholar]
- Efron B, Tibshirani RJ. An Introduction to the Bootstrap. Chapman & Hall; New York: 1993. [Google Scholar]
- Gamzu E, Ahissar E. 2000. Personal communication. [DOI] [PMC free article] [PubMed]
- Gamzu E, Ahissar E. Importance of temporal cues for tactile spatial-frequency discrimination. J Neurosci. 2001;21:7416–7427. doi: 10.1523/JNEUROSCI.21-18-07416.2001. [DOI] [PMC free article] [PubMed] [Google Scholar]
- Hollins M, Bensmaïa SJ, Risner SR. The duplex theory of tactile texture perception. In: Grondin S, Lacouture Y, editors. Fechner Day 98. Proceedings of the Fourteenth Annual Meeting of the International Society for Psychophysics. International Society for Psychophysics; Quebec, Canada: 1998. pp. 115–120. [Google Scholar]
- Hollins M, Bensmaïa SJ, Washburn S. Vibrotactile adaptation impairs discrimination of fine, but not coarse, textures. Somatosens Mot Res. 2001;18:253–262. doi: 10.1080/01421590120089640. [DOI] [PubMed] [Google Scholar]
- Hollins M, Fox A, Bishop C. Imposed vibration influences perceived tactile smoothness. Perception. 2001;29:1455–1465. doi: 10.1068/p3044. [DOI] [PubMed] [Google Scholar]
- Hollins M, Risner SR. Evidence for the duplex theory of tactile texture perception. Percept Psychophys. 2000;62:695–705. doi: 10.3758/bf03206916. [DOI] [PubMed] [Google Scholar]
- Lederman SJ. Tactile roughness of grooved surfaces: the touching process and effects of macro- and microsurface features. Percept Psychophys. 1974;16:385–395. [Google Scholar]
- Lederman SJ. Tactual roughness perception: spatial and temporal determinants. Can J Psychol. 1983;37:498–511. [Google Scholar]
- Lederman SJ, Taylor MM. Fingertip force, surface geometry, and the perception of roughness by active touch. Percept Psychophys. 1972;12:401–408. [Google Scholar]
- Makous JC, Friedman RM, Vierck CJ., Jr A critical band filter in touch. J Neurosci. 1995;15:2808–2818. doi: 10.1523/JNEUROSCI.15-04-02808.1995. [DOI] [PMC free article] [PubMed] [Google Scholar]
- Marks LE. Summation of vibrotactile intensity: an analog to auditory critical bands. Sens Processes. 1979;3:188–203. [PubMed] [Google Scholar]
- Miyaoka T, Mano T, Ohka M. Mechanisms of fine-surface-texture discrimination in human tactile sensation. J Acoust Soc Am. 1999;105:2485–2492. doi: 10.1121/1.426852. [DOI] [PubMed] [Google Scholar]
- Taylor MM, Lederman SJ. Tactile roughness of grooved surfaces: a model and the effect of friction. Percept Psychophys. 1975;17:23–36. [Google Scholar]
- Yoshioka T, Gibb B, Dorsch AK, Hsiao SS, Johnson KO. Neural coding mechanisms underlying perceived roughness of finely textured surfaces. J Neurosci. 2001;21:6905–6916. doi: 10.1523/JNEUROSCI.21-17-06905.2001. [DOI] [PMC free article] [PubMed] [Google Scholar]