

Abstract
Relative neuronal vulnerability is a universal yet poorly understood feature of neurodegenerative diseases. In Parkinson's disease, dopaminergic (DA) neurons in the substantia nigra (SN) (A9) are particularly vulnerable, whereas adjacent DA neurons within the ventral tegmental area (A10) are essentially spared. Our previous laser capture microdissection and microarray study (Chung et al., 2005) demonstrated that molecular differences between these DA neurons may underlie their differential vulnerability. Here we show that G-substrate, an endogenous inhibitor of Ser/Thr protein phosphatases, exhibits higher expression in A10 compared with A9 DA neurons in both rodent and human midbrain. Overexpression of G-substrate protected dopaminergic BE(2)-M17 cells against toxins, including 6-OHDA and MG-132 (carbobenzoxy-l-leucyl- l-leucyl-l-leucinal), whereas RNA interference (RNAi)-mediated knockdown of endogenous G-substrate increased their vulnerability to these toxins. G-substrate reduced 6-OHDA-mediated protein phosphatase 2A (PP2A) activation in vitro and increased phosphorylated levels of PP2A targets including Akt, glycogen synthase kinase 3β, and extracellular signal-regulated kinase 2 but not p38. RNAi to Akt diminished the protective effect of G-substrate against 6-OHDA. In vivo, lentiviral delivery of G-substrate to the rat SN increased baseline levels of phosphorylated Akt and protected A9 DA neurons from 6-OHDA-induced toxicity. These results suggest that inherent differences in the levels of G-substrate contribute to the differential vulnerability of DA neurons and that enhancing G-substrate levels may be a neuroprotective strategy for the vulnerable A9 (SN) DA neurons in Parkinson's disease.
Keywords: protein phosphatase 2A, G-substrate, Akt, differential vulnerability, selective vulnerability, A9, A10, 6-hydroxydopamine, neuroprotection, Parkinson's disease, substantia nigra, ventral tegmental area
Introduction
Selective or relative neuronal vulnerability is a common feature of neurodegenerative diseases. The different susceptibilities to degeneration of A9 and A10 dopaminergic (DA) neurons in the midbrain of Parkinson's disease (PD) is a striking example of this phenomenon. Regardless of specific etiology, DA neurons in the A9 region [substantia nigra (SN)] are considerably more vulnerable than DA neurons in the adjacent A10 region [ventral tegmental area (VTA)] (Hirsch et al., 1988). A similar pattern of vulnerability is observed in animal models of PD (German et al., 1988; Rodriguez et al., 2001), indicating that such differential vulnerability between A9 and A10 DA neuronal populations may be conserved between species. Recently, we and others have demonstrated that rodent A9 and A10 DA neurons have distinct gene expression profiles despite their many similarities (Grimm et al., 2004; Chung et al., 2005; Greene et al., 2005). Such inherent baseline gene expression differences may underlie differential vulnerability to pathophysiological processes.
G-substrate was first identified as an endogenous substrate for the cGMP-dependent protein kinase (PKG) (Aswad and Greengard, 1981) and subsequently shown to be an inhibitor of Ser/Thr phosphatases protein phosphatase 2A (PP2A) and protein phosphatase 1 (PP1) in in vitro cell-free experiments (Endo et al., 1999; Hall et al., 1999). A9 and A10 neurons exhibit prominent differences in G-substrate expression with approximately threefold higher mRNA expression levels in the A10 group (Grimm et al., 2004; Chung et al., 2005). Intriguingly, two isoforms of the PP2A regulatory subunit B (B56) are expressed higher in the vulnerable A9 DA neurons (Chung et al., 2005), indicating that PP2A activity toward certain targets may be elevated in A9 neurons. These observations raised the possibility that PP2A activity is differentially regulated in A9 and A10 DA neurons and made G-substrate an interesting candidate to examine with respect to relative vulnerability.
Interestingly, recent studies have indicated that some PD-related pathological challenges increase PP2A activity, at least on certain targets. For example, 6-OHDA exposure in a DA cell line decreases phosphorylated Akt (pAkt) and glycogen synthase kinase 3β (GSK3β) levels, an effect blocked by a PP2A inhibitor, okadaic acid (Chen et al., 2004), and overexpression of α-synuclein increases PP2A activity in MN9D cells (Peng et al., 2005). Intriguingly, the PP2A target Akt has also been implicated in DA neuron protection (Ries et al., 2006). Ser/Thr phosphatases might thus play an important role in PD pathophysiology. The relationship of PP2A activity to cell survival, however, is complex, variably proapoptotic or antiapoptotic depending on the molecular target. A delicate balance of intracellular phosphorylation states may be critical for cell survival against toxic stimuli.
We thus hypothesized that elevated G-substrate expression in A10 DA neurons may contribute to their reduced vulnerability to PD-related toxins and, conversely, that elevated expression of this molecule in A9 DA neurons could confer neuroprotection. In this study, we show that, in both in vitro and in vivo PD models, G-substrate is protective and that G-substrate may mediate this action, at least in part, via modulation of Akt. Our findings suggest that differential activity of G-substrate is one of the determinants of differential DA neuron vulnerability in PD.
Materials and Methods
Laser capture microdissection in mouse and human midbrain
Tissue preparation.
Adult C57BL/6 mice (Jackson ImmunoResearch, West Grove, PA) were anesthetized with intraperitoneal sodium pentobarbital (300 mg/kg) and decapitated. The brain was removed and snap frozen in dry ice-cooled 2-methylbutane. Fresh frozen human midbrain blocks were obtained from Harvard Brain Tissue Resource Center. Brains were cut using a cryostat with 10 μm (for mouse) or 18 μm (for human) thickness, mounted on laser capture microdissection (LCM) slides (Arcturus Bioscience, Mountain View, CA), and immediately stored at −70°C.
Quick tyrosine hydroxylase immunostaining and LCM.
A quick tyrosine hydroxylase (TH) immunostaining and LCM was performed accordingly to the previous protocol (Chung et al., 2005). Briefly, the tissue sections were fixed in cold acetone for 5 min, washed with PBS, incubated with rabbit anti-TH (1:25; Pel-Freez Biologicals, Rogers, AR) for 4 min, washed in PBS, and exposed to biotinylated anti-rabbit antibody (1:25; Vector Laboratories, Burlingame, CA) for 4 min. The slides were washed in PBS, incubated in ABC–horseradish peroxidase enzyme complex (Vectastain; Vector Laboratories) for 4 min, and the staining was detected with the substrate diaminobenzidine. Sections were subsequently dehydrated in graded ethanol solution (30 s each in water, 70% ethanol, 95% ethanol, 100% ethanol, and twice for 5 min in xylene). For LCM, the PixCell II System (Arcturus Bioscience) was used to capture ∼100–200 neurons. RNA was isolated using PicoPure RNA isolation kit (Arcturus Bioscience).
Real-time PCR for validation
Real-time PCR was performed according to the previous protocol (Chung et al., 2005). Briefly, RNA samples from A9 and A10 DA neurons were reverse transcribed into cDNA using Sensiscript reverse transcriptase (Qiagen, Valencia, CA) and oligo-dT as the primer. PCR reactions were set up in 25 μl reaction volume using SYBR Green PCR Master Mix (Applied Biosystems, Foster City, CA) with 250 nm final concentrations of primers. For each primer pair, triplicates of three to five independently collected A9 and A10 samples were compared to quantify relative gene expression differences between these cells using the 2−ΔΔCT method (Livak and Schmittgen, 2001). β-Actin was used as an internal control gene.
Lentivirus cloning
Construction of lentiviral vectors.
The human wild-type and mutant (T123A) G-substrate cDNAs were cloned into the lentiviral vector pRRL.cPPT.PGK.W.Sin-18 (kindly provided by Drs. R. Zufferey and D. Trono, University of Geneva, Geneva, Switzerland) and confirmed by sequence analyses.
Production of lentiviral vectors and cell transduction.
Lentivirus production was based on the previous protocol (Chung et al., 2005). Briefly, HEK293T cells were transfected with four plasmids (pMDLg/pRRE, pMD.G, pRSV.Rev, and pRRL.cPPT.G-substrate.W.Sin-18) kindly provided by Drs. Zufferey and Trono. Virus supernatants were collected and filtered through a 0.2 μm filter and ultracentrifuged to obtain high concentrations of viral stocks. Virus titers were determined by measuring the viral capsid protein p24 using ELISA. Lower-titer (∼106 pg/ml p24) virus was used for in vitro transduction, and higher-titer (∼108 pg/ml p24) virus was used for in vivo transduction.
In vitro protection analysis
BE(2)-M17 cell culture.
BE(2)-M17 cells were transduced with lentivirus expressing control or G-substrate with a multiplicity of infection of 15. Cells were grown in Optimem (Invitrogen, Carlsbad, CA) supplemented with 10% heat-inactivated fetal calf serum (Hyclone, Logan, UT), nonessential amino acid, and sodium pyruvate. Cells were maintained at 37°C in 5% CO2 humid atmosphere. For the bioassay, cells were plated in 96-well plates at 5000 per well. The next day, cells were treated with various concentrations of 6-OHDA (Sigma, St. Louis, MO), MG-132 (carbobenzoxy-l-leucyl- l-leucyl-l-leucinal; Calbiochem, La Jolla, CA), and 1-methyl-4-phenylpyridinium (MPP+) (Sigma) for 20 h. The supernatant was used to determine cytotoxicity using lactate dehydrogenase (LDH) release assay kit (Roche, Indianapolis, IN), and the cells remaining on the plate was used to determine cell viability using methanethiosulfonate (MTS)-based solution, CellTiter 96 AQueous One solution cell proliferation assay (Promega, Madison, WI).
Small interference RNA transfection.
Three different small interference RNAs (siRNAs) for human G-substrate, negative control siRNA, and a validated Akt siRNA were purchased from Ambion (Austin, TX). Cells were plated in 96-well plates at 5000 per well with siRNAs and siPORT NeoFX transfection agent (Ambion). After 48 h of incubation with siRNAs, 6-OHDA, MG-132, and MPP+ were applied to the cells. Cell viability and cytotoxicity was measured after 20 h of toxin exposure.
PP2A activity assay
PP2A activity was measured using a nonradioactive kit according to the instructions of the manufacturer (Upstate Biotechnologies, Lake Placid, NY). After 50 μm 6-OHDA exposure with various times, cells were harvested in 20 mm imidazole-HCl, 2 mm EDTA, and 2 mm EGTA, pH 7, with a protease inhibitor cocktail (Sigma). Protein concentrations of the lysates were measured using BCA assay (Pierce), and 500 μg of protein was immunoprecipitated using an anti-PP2A catalytic subunit antibody and protein A-Sepharose beads. Immunoprecipitated PP2A was then incubated with phosphopeptide (K-R-pT-I-R-R) for 10 min at 37°C. Dephosphorylation of the phosphopeptide was assayed spectrophotometrically at 650 nm using Malachite Green.
Immunoprecipitation
Control or G-substrate-overexpressing cells were harvested 2 h after 50 μm of 6-OHDA exposure. After cell lysate (50–100 μg) was incubated overnight with 1 μg of the rabbit anti-human G-substrate antibody at 4°C, protein A beads were added to the lysate–antibody complex and incubated 3 additional h. The beads were extensively washed with PBS and denatured by boiling in Laemli's buffer containing β-mercaptoethanol. Immunoprecipitated samples were loaded in 12.5% polyacrylamide gel and probed with mouse monoclonal anti-phospho-G-substrate antibody (Endo et al., 2003). The blot was stripped and reprobed with rabbit anti-G-substrate antibody to determine total G-substrate levels.
Animals
Female Sprague Dawley rats weighing ∼280 g (Charles River Laboratories, Wilmington, MA) were used in all animal experiments. All rat studies were approved by the McLean Hospital Institutional Animal Care and Use Committee.
Stereotaxic surgery
All stereotaxic coordinates were derived from the rat atlas of Paxinos and Watson (1986). For each surgery, animals were deeply anesthetized with ketamine and xylazine (60 and 3 mg/kg, respectively, i.m.).
Substantia nigra lentiviral injection.
Rats received two 2.75 μl stereotaxic injections of lenti-empty vector plus lenti-enhanced green fluorescent protein (eGFP) (n = 19), lenti-G-substrate plus lenti-eGFP (n = 19), or lenti-yellow fluorescent protein (YFP) (n = 14) and delivered at a rate of 0.2 μl/min using microinfusion pumps (Stoelting, Wood Dale, IL) with 10 min wait times after each injection. Lenti-eGFP was added to each condition, excluding the YFP condition, to serve as an exogenous marker for surgical targeting (0.5 μl of the total 5.5 μl volume). SN injection coordinates were as follows (in mm): site 1: anteroposterior (AP) −4.8, mediolateral (ML) −2.0, dorsoventral (DV) −7.2; site 2: AP −5.5, ML −1.8, DV −7.2; with the tooth bar set at −3.3. Virus titers (p24) were as follows: G-substrate, 60 ng/μl; empty vector, 60 ng/μl; eGFP, 83 ng/μl; and YFP, 60 ng/μl.
6-OHDA intrastriatal injection.
Two weeks after lentiviral injection, animals [lenti-empty vector plus lenti-eGFP (n = 9), lenti-G-substrate plus lenti-eGFP (n = 9), or lenti-YFP (n = 14)] received three 2.5 μl stereotaxic injections of 3.0 μg/μl 6-OHDA (total dose, 22.5 μg of 6-OHDA) delivered at a rate of 0.5 μl/min and 5 min wait times after each injection. Striatum injection coordinates were as follows (in mm): site 1: AP +1.3, ML −2.8, DV −4.5; site 2: AP +0.2, ML, −3.0, DV −5.0; site 3: AP −0.6, ML −4.0, DV −5.5; with the tooth bar set at −3.3. The lesion was allowed to progress for 3 weeks, after which animals were killed for postmortem analyses.
Perfusions and tissue handling
Animals were deeply anesthetized with an intraperitoneal injection of sodium pentobarbital and were killed by exsanguination with the aid of ice-cold saline perfusion. For immunohistochemistry, the brains were then fixed with a 4% paraformaldehyde solution. The brains were then removed from the skull, placed in fresh 4% paraformaldehyde solution for 1 h, and equilibrated through 20 and 30% sucrose solutions and refrigerated until cutting for immunohistochemistry. For immunoblotting, brains injected with lenti-empty vector plus lenti-eGFP (n = 10) or lenti-G-substrate plus lenti-eGFP (n = 10) were rapidly removed after saline perfusion and sliced coronally using a tissue chopper set to 1 mm (Campden Instruments, Lafayette, IN). On an inverted glass Petri dish over ice, regions of interest (striatum and substantia nigra region) were dissected from the individual 1 mm tissue slices, frozen on dry ice, and stored at −80°C.
Immunohistochemistry
Brains were cut frozen in the coronal plane at a thickness of 40 μm on a sliding microtome, and six series of sections were stored in cryoprotectant. Two full series of sections were processed for visualization of TH via the biotin-labeled antibody procedure. Briefly, after several washes in a PBS solution containing 0.01% Triton X-100 (PBS-T), endogenous peroxidase was quenched in a 3% hydrogen peroxide solution, and background staining was then inhibited in a 5% normal goat serum solution. Tissue was then incubated with rabbit anti-TH antibody overnight (1:5000; Pel-Freez). After three washes in PBS-T, sections were sequentially incubated in biotinylated goat anti-rabbit IgG (1:500; Vector Laboratories) for 1 h and the Elite avidin–biotin complex (ABC kits; Vector Laboratories) for 1 h separated by three washes in PBS. TH immunostaining was visualized after a reaction with 3,3-diaminobenzidine (Vector Laboratories). Sections were then mounted on glass slides, allowed to dry, dipped into dH20, dehydrated through graded alcohol (70, 95, 100%), cleared in xylenes, and coverslipped with DPX mounting medium. For immunofluorescence staining, sections were washed with PBS-T and blocked with donkey serum. Sections were then incubated with anti-TH (Pel-Freez), anti-G-substrate (Endo et al., 1999), and anti-eGFP (Chemicon, Temecula, CA) antibodies overnight and subsequently incubated in the following fluorophore-conjugated secondary antibodies: Alexa 488 (to visualize eGFP), Alexa 568 (to visualize TH), and Alexa 647 (to visualize G-substrate; Invitrogen). Sections were mounted onto glass slides and visualized using confocal microscopy.
Immunoblotting
Cells and tissue samples were collected from and suspended in lysis buffer containing the following: 50 mm Tris-HCl, 0.15 m NaCl, 0.32 m sucrose, 1.0 mm EDTA, and 1% NP-40. In addition, phosphatase inhibitors I and II (1:100) and protease inhibitors (1:100) were added fresh before cell lysis (P2850, P5276, and P8340, respectively; Sigma). After cell lysis, the homogenate was centrifuged, a portion of the supernatant was reserved for protein determination (BCA Assay; Pierce), and the remaining was stored at −20°C. Twenty micrograms (in vitro cell preparations) and 50 μg (tissue dissections) of solubilized protein were mixed 1:1 with sample buffer and boiled for 5 min. The samples and molecular weight standards were separated using the Criterion precast 10% SDS-polyacrylamide gel system (Bio-Rad, Hercules, CA). After electrophoresis, the proteins were electrically transferred to polyvinylidene difluoride membranes at 100 V for 30 min. After transfer, blots were incubated in Tris-buffered saline with 0.1% Tween 20 containing 5% BSA. Subsequently, blots were incubated with the following antibodies at 4°C overnight (1:1000 unless otherwise stated): phospho-Akt (Ser473), phospho-GSK3β (Ser9), phospho-extracellular signal-regulated kinase 1/2 (Erk1/2), and phospho-p38 (Cell Signaling Technology, Danvers, MA). HRP-conjugated secondary antibodies were then applied, and immunoreactive bands were visualized with chemiluminescence (GE Healthcare, Little Chalfont, UK) and exposed onto film. Immunoblots were then stripped and reprobed for the expression of the total protein (Cell Signaling Technology) and β-actin (1:10,000; Abcam, Cambridge, MA) to serve as a loading control. Optical density analysis (NIH Image) was used to determine the relative abundance of protein in each sample. The optical densities of the phospho epitopes were standardized to their respective total proteins, and this value was used in the statistical analyses.
Cell counting
Estimates of TH-positive neuronal number within the SN were performed using Stereo Investigator software (MBF Bioscience, Williston, VT) and stereologic principles (West and Gundersen, 1990). The anterior and posterior boundaries of the SN included in the analysis were defined according to the area transduced by lenti-eGFP in preliminary experiments [approximately −4.80 mm through −6.00 mm from bregma (according to the rat brain atlas of Paxinos and Watson, 1986)]. Stereology was performed using a Zeiss (Thornwood, NY) Axiovert microscope coupled to an Optronics (Goleta, CA) Microfire digital camera for visualization of tissue sections. The total number of TH-positive neurons, from tissue sections separated by 120 μm, was estimated from coded slides using the optical fractionator method. For each tissue section analyzed, section thickness was assessed empirically, and guard zones of 2 μm thickness were used at the top and bottom of each section. The SN was outlined under low magnification (2.5×), and ∼50% of the outlined region was analyzed using a systematic random sampling design generated with the following stereologic parameters: grid size, 200 × 200 μm; counting frame size, 153 × 140 μm; and dissector height, 16 μm. Neurons were counted under 40× magnification. The coefficients of error were calculated according to the procedure of West (1993), and values <0.10 were accepted.
Results
G-substrate is more highly expressed in A10 DA neurons compared with A9 DA neurons
Recent microarray studies comparing gene expression profiles of A9 and A10 DA neurons have indicated that G-substrate mRNA is elevated in A10 DA neurons compared with A9 DA neurons in rat (Grimm et al., 2004) and mouse (Chung et al., 2005). To verify these results, we collected A9 and A10 DA neurons in mouse and human midbrain by TH staining followed by laser capture microdissection as described previously (Chung et al., 2005) (Fig. 1 a–f). Quantitative PCR results demonstrated that G-substrate mRNA levels were higher in A10 DA neurons compared with A9 DA neurons in both mouse (3.213 ± 0.31-fold) and human (female, 4.03 ± 0.83-fold; male, 3.92 ± 0.14-fold) (Fig. 1 g), validating the previous microarray results. In human midbrain, there was no effect of gender on the differential expression of G-substrate mRNA (Fig. 1 g). In addition, immunostaining for G-substrate and TH indicated that A10 DA neurons have higher G-substrate protein levels than A9 DA neurons (Fig. 2) in both rat and human midbrain. G-substrate staining, however, was not exclusive to TH-positive neurons (Fig. 2 c,g,n).
Figure 1.

G-substrate mRNA levels in mouse and human DA neurons. b–f, DA neurons were labeled using the quick TH staining method in mouse, as described previously (Chung et al., 2005), and human midbrain. d–f, DA neurons were then collected using laser capture microdissection. g, Quantitative PCR results demonstrated that A10 DA neurons showed higher levels of G-substrate mRNA than A9 DA neurons in both rodent and human. Data are shown as mRNA ratios of A10 over A9 DA neurons ± SEM (n = 3 for mouse, n = 4 for male human, and n = 3 for female human; *p < 0.05, two-tailed t test). SNc, Substantia nigra pars compacta.
Figure 2.

G-substrate expression in rat and human midbrain DA neurons. TH (a, b, i, l) and G-substrate (b, f, j, m) were stained in rat (a–g) and human (i–n) midbrain. More intense G-substrate staining was observed in A10 DA neurons (e–g, l–n) compared with A9 DA neurons (a–c, i–k). h, Colocalization of G-substrate and TH was confirmed by the z-stack confocal image.
G-substrate is protective against 6-OHDA and MG-132 toxicity in vitro
To investigate the role of G-substrate in neuroprotection, wild-type and mutant G-substrate were overexpressed using lentivirus-mediated gene delivery into human dopaminergic neuroblastoma BE(2)-M17 cells. Protein overexpression was confirmed by Western blot analysis (Fig. 3 a) and by immunocytochemistry (Fig. 3 b). The mutant G-substrate construct harbors a Thr to Ala point mutation at Thr123 (T123A), a residue at which G-substrate is phosphorylated by PKG (Endo et al., 2003). This phosphorylation increases the inhibitory activity of G-substrate toward Ser/Thr phosphatases, including PP1 and PP2A. Thus, by mutating this site to Ala, G-substrate partially loses its Ser/Thr phosphatase inhibitory activity determined previously by cell-free experiments (Endo et al., 2003). Another putative PKG phosphorylation site, Thr72, did not affect the Ser/Thr phosphatase inhibitory activity of G-substrate (Endo et al., 2003).
Figure 3.
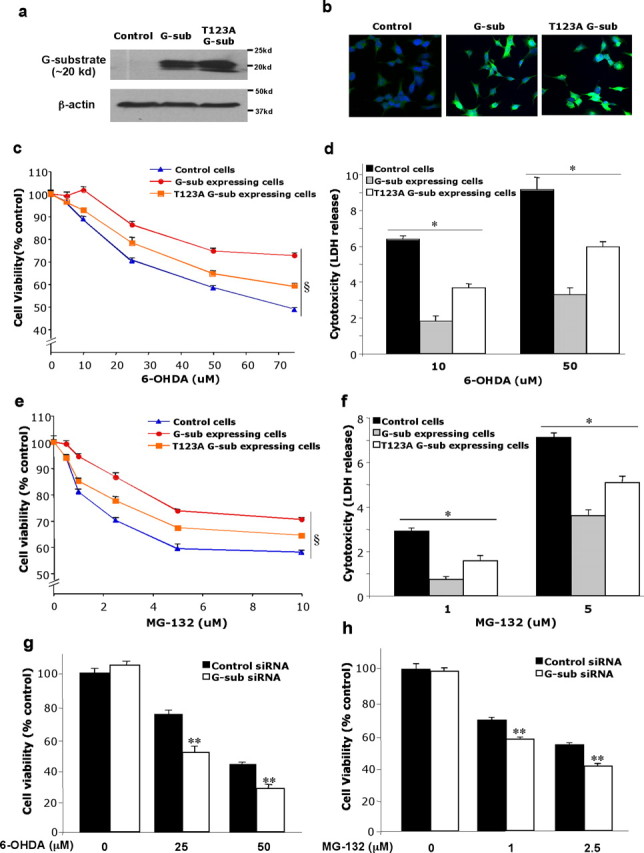
Overexpression of wild-type and mutant (T123A) G-substrate in BE(2)-M17 cells. Lentivirus containing the wild-type and T123A G-substrate gene were transduced to BE(2)-M17 cells with a multiplicity of infection of 15. a, b, Overexpression of the wild-type and T123A G-substrate was confirmed by Western blot (a) and immunocytochemistry (b). c–f, After exposing these cells to 6-OHDA (c, d) or MG-132 (e, f), cell viability was measured using MTS assay (c, e), and cytotoxicity was measured via LDH release (d, f). Overexpression of both the wild-type and T123A G-substrate was protective against 6-OHDA and MG-132 toxicity. There was significantly less protection in T123A G-substrate-expressing cells compared with the wild-type G-substrate-expressing cells. Data are shown as means ± SEM (n = 6–8) and are representatives of three or more experiments with the similar trends (§ p < 0.001, two-way ANOVA; *p < 0.001, not significant, one-way ANOVA, Tukey's test). g, h, Knockdown of the endogenous G-substrate using siRNA: cell viability was measured using the MTS assay, and results are expressed as a percentage of cells exposed to control siRNA without 6-OHDA treatment. The endogenous G-substrate knockdown increased vulnerability of the cells to 6-OHDA toxicity (g) and MG-132 toxicity (h). Data are shown as means ± SEM (n = 6–8) and are representatives of three or more experiments with the similar trends (**p < 0.001, not significant, one-way ANOVA, Tukey's test).
Overexpression of wild-type G-substrate protected BE(2)-M17 cells from toxicity induced by various doses of 6-OHDA and a proteasome inhibitor, MG-132 (Fig. 3 c–f). Although T123A G-substrate expression was also protective compared with the control, the degree of protection conferred was significantly less than in wild-type G-substrate-expressing cells (Fig. 3 c–f). These results suggest that the Ser/Thr phosphatase-inhibitory action of G-substrate is at least partially involved in G-substrate-induced protection.
We next investigated the effect of knocking down endogenous G-substrate using siRNA in our in vitro systems. Although the endogenous G-substrate levels in these cells were very low, G-substrate mRNA levels were clearly detected using quantitative PCR (supplemental Fig. 1, available at www.jneurosci.org as supplemental material). Three different siRNAs, siRNA1, siRNA2, and siRNA3, were transiently transfected into BE(2)-M17 cells, and G-substrate mRNA levels were measured using quantitative PCR (supplemental Fig. 1, available at www.jneurosci.org as supplemental material). Compared with the control siRNA-treated group, all three G-substrate siRNAs reduced endogenous G-substrate mRNA levels (62–73% reduction) (supplemental Fig. 1, available at www.jneurosci.org as supplemental material). siRNA1 and siRNA2 were used for subsequent experiments. siRNA-treated cells were exposed to 6-OHDA and MG-132. Cell viability measurement indicated that cells treated with G-substrate siRNA exhibited increased vulnerability to 6-OHDA toxicity as well as MG-132 toxicity compared with the control siRNA-treated cells (Fig. 3 g,h). The relatively modest effect of G-substrate knockdown is most likely attributable to the low endogenous levels of G-substrate present in these cells.
G-substrate inhibits the 6-OHDA-induced PP2A activity increase in vitro
G-substrate-induced protection against 6-OHDA appears to involve the Ser/Thr phosphatase-inhibitory role of G-substrate (Fig. 3 c,d). Therefore, the role of G-substrate in modulating cellular Ser/Thr phosphatase activity was investigated. Because G-substrate needs to be phosphorylated to inhibit PP2A and PP1 (Endo et al., 1999, 2003; Hall et al., 1999), we first determined the levels of phosphorylated G-substrate in G-substrate-expressing cells in the absence or presence of 6-OHDA treatment. G-substrate overexpression increased not only the total levels (Fig. 3 a) but also the phosphorylated levels of G-substrate under basal conditions (Fig. 4 a). Furthermore, phospho-G-substrate levels were augmented by 6-OHDA exposure (Fig. 4 a). These results suggest that G-substrate-overexpressing cells contain the “active” form of G-substrate for Ser/Thr protein phosphatase inhibition in both basal and 6-OHDA-treated conditions. We then investigated the effect of G-substrate overexpression on total cellular Ser/Thr protein phosphatase activity. Ser/Thr protein phosphatases include PP1, PP2A, PP2B, PP2C, PP4, PP5, PP6, and PP7 (Honkanen and Golden, 2002). Among these, PP2A is prominently involved in several cellular signal transduction pathways and accounts for a significant fraction of Ser/Thr phosphatase activity in neurons (Van Hoof and Goris, 2003). Indeed, we found PP1 activity in the absence and presence of 6-OHDA was considerably lower compared with PP2A activity in BE(2)-M17 cells (data not shown). Therefore, we focused on PP2A as a potential mediator of G-substrate-dependent protection. To determine the time course of PP2A activity after 6-OHDA exposure, activity of this enzyme was measured in control BE(2)-M17 cells at various incubation times (t = 0, 1, 2, 5, and 8 h) after 50 μm 6-OHDA exposure. At all times except t = 5 h, PP2A activity was significantly increased after 6-OHDA exposure compared with basal activity (Fig. 4 b). Control, wild-type, and T123A G-substrate-expressing cells were then exposed to 50 μm 6-OHDA for 2 h before measurement of PP2A activity. Both wild-type and T123A mutant G-substrate stable expression in BE(2)-M17 cells unexpectedly caused an overall increase in total cellular PP2A activity compared with control cells (Fig. 4 c). This contrasted with a general pharmacologic PP2A inhibitor, okadaic acid, which reduced baseline total PP2A activity, indicating that, in a cellular context, G-substrate may not be a general inhibitor of PP2A activity. Strikingly, however, 6-OHDA-induced augmentation of PP2A activity was blocked in G-substrate-overexpressing cells. Thus, whereas PP2A activity was increased by 6-OHDA treatment, cells overexpressing wild-type G-substrate exhibited a decrease in PP2A activity after 6-OHDA treatment (Fig. 4 c). The degree of reduction in PP2A activity was less in T123A G-substrate-expressing cells (Fig. 4 c). Western blot analysis of immunoprecipitated PP2A indicates that the activity changes shown in Figure 4 c were not attributable to alterations of PP2A protein levels (Fig. 4 d).
Figure 4.

Changes in phosphorylated G-substrate and PP2A activity after 6-OHDA exposure. a, G-substrate was immunoprecipitated from control and G-substrate-expressing cells, and phosphorylated and total G-substrate levels were measured in the absence or presence of 6-OHDA treatment. G-substrate overexpression caused an increase in phosphorylated G-substrate levels in the basal conditions, which was further augmented by 6-OHDA exposure. To quantify the levels of phospho-G-substrate, optical densities (OD) of the phospho-G-substrate levels in each condition was normalized with basal (no 6-OHDA) phosphorylated G-substrate in control cells. Statistical comparisons were made against no 6-OHDA control cell conditions (n = 3, *p < 0.01, two-tailed t test). b, PP2A activity was measured at various times (t = 0, 1, 2, 5, and 8 h) on BE(2)-M17 cells after 50 μm 6-OHDA treatment. Exposure to 6-OHDA induced an increase in PP2A activity at all times except t = 5 h. Data are shown as means ± SEM (n = 3). Statistical comparisons were made against baseline control values at t = 0 h (*p < 0.05, two-tailed t test). c, PP2A activity was measured in control, wild-type, and T123A G-substrate-expressing cells after exposing cells to 50 μm 6-OHDA for 2 h. The results are expressed as a percentage of the basal (no 6-OHDA condition) activity of the control cells. Surprisingly, overexpression of the wild-type and T123A G-substrate increased the basal PP2A activity (c). In response to 6-OHDA exposure, the wild-type G-substrate significantly reduced the observed 6-OHDA-induced PP2A activity increase. The degree of reduction in T123A G-substrate-expressing cells was significantly lower than the wild-type-expressing cells. For okadaic acid-treated conditions, 1 nm okadaic acid was applied for 30 min before harvesting the cells for PP2A activity measurement. Data are shown as means ± SEM of five independent experiments (**p < 0.005, two-tailed t test). d, Western blot analysis of immunoprecipitated PP2A indicates that the activity changes shown in b were not attributable to alterations of PP2A protein levels.
G-substrate increases phosphorylation levels of PP2A targets involved in cell survival
Because overexpression of G-substrate blocks the increase in PP2A activity induced by 6-OHDA and also confers protection against 6-OHDA, we investigated whether G-substrate overexpression altered the phosphorylation levels of PP2A targets known to play a critical role in cell survival. Akt, GSK3β, and Erk1/2 are known to promote cell survival when phosphorylated (Chen et al., 2004; Tamura et al., 2004; Ray et al., 2005; Song et al., 2005). In contrast, phosphorylated p38 mediates cell death in dopaminergic neurons exposed to various toxins, including 6-OHDA (Choi et al., 2004; Ou et al., 2006; Ruano et al., 2006). To examine the changes in phosphorylation levels of these proteins, both control and G-substrate-expressing cells were exposed to 50 μm 6-OHDA for various durations (t = 0, 2, 5, and 10 h). The levels of total and phosphorylated forms of PP2A substrates were detected by Western blot analysis (Fig. 5 a,c,e,h). G-substrate overexpression caused a significant increase in basal levels of pAkt as well as at 2, 5, and 10 h after 6-OHDA exposure (Fig. 5 a,b). Basal levels of pGSK3β were also increased in G-substrate-expressing cells (Fig. 5 c,d). Interestingly, pErk2 levels were increased by G-substrate overexpression only after 10 h after 6-OHDA exposure and in the absence of a basal level increase (Fig. 5 e,g). The levels of pErk1 showed a similar trend to pErk2, but this did not reach statistical significance (Fig. 5 e,f). Interestingly, G-substrate overexpression did not alter the level of the proapoptotic pp38 (Fig. 5 h,i). Together, these data show that G-substrate significantly modulates a subset of PP2A substrates known to promote cell survival but, in contrast, does not affect the proapoptotic substrate p38.
Figure 5.
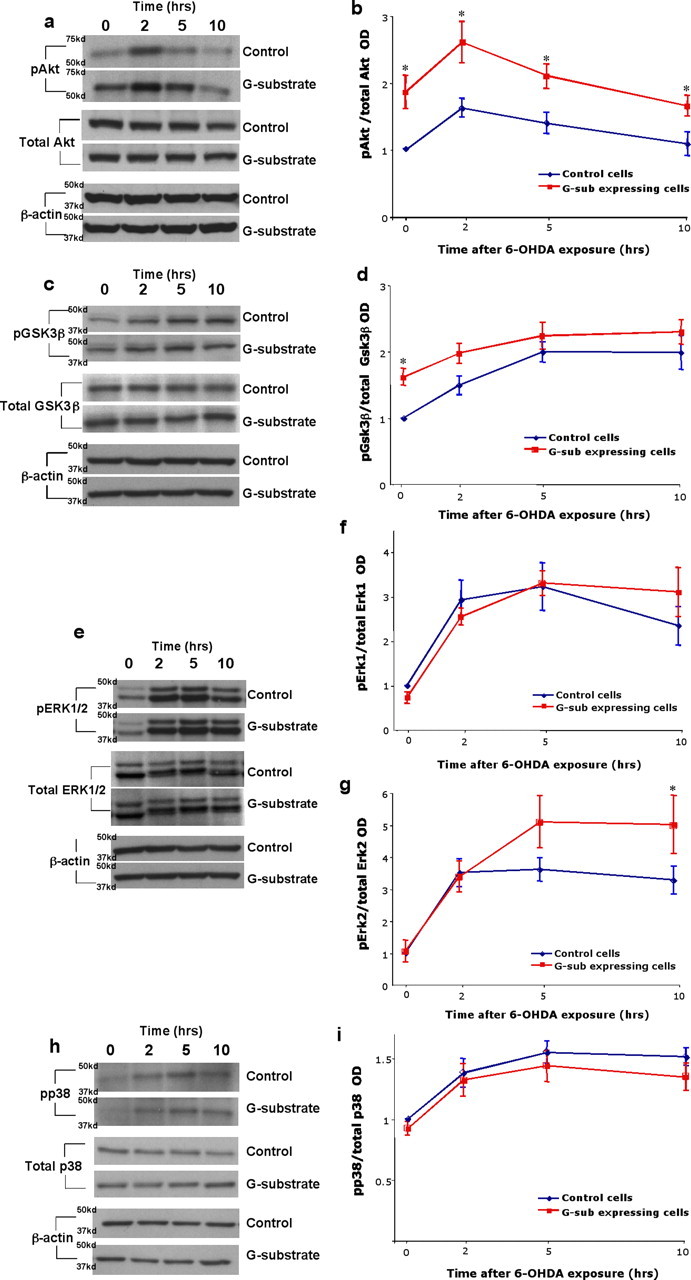
Changes in phosphorylation levels of cellular PP2A substrates. Both control and the wild-type G-substrate-expressing cells were exposed to 50 μm 6-OHDA for various durations (t = 0, 2, 5, and 10 h). a, c, e, h, The levels of total and phosphorylated form of PP2A substrates were detected by Western blot analysis. b, d, f, g, i, The optical densities (OD) of the individual bands were quantified using NIH Image. Optical densities of phosphorylated epitopes were normalized with those of total epitopes as an internal control. These values were normalized with optical densities at time t = 0 of the control cells. a, b, G-substrate overexpression caused an increase in basal levels of pAkt as well as t = 2, 5, and10 h. c, d, The basal pGSK3β levels were increased in G-substrate-expressing cells. pErk2 levels were significantly increased in G-substrate-expressing cells at t = 10 h (e–g), whereas pEkr1 and pp38 levels were not significantly altered by G-substrate expression. Data are shown as means ± SEM of four to five independent experiments (*p < 0.05, Holm–Sidak post hoc test).
Knockdown of endogenous Akt decreases G-substrate-induced protection against 6-OHDA in vitro
Because both basal and 6-OHDA-induced pAkt levels were significantly increased in G-substrate-expressing cells (Fig. 5 a,b), we investigated whether the protection afforded by G-substrate against 6-OHDA required Akt. To examine this, we determined whether the ability of G-substrate to protect against 6-OHDA was reduced by knocking down endogenous Akt levels using siRNA. Efficient, although not complete, knockdown of endogenous Akt was confirmed using Western blot analysis (Fig. 6 a). Cytotoxicity was measured in the presence or absence of 50 μm 6-OHDA after applying control or Akt siRNA to both control and G-substrate-expressing cells (Fig. 6 b). Knockdown of endogenous Akt resulted in a small increase in 6-OHDA-induced toxicity in control cell lines, as measured by the cytotoxicity assays (Fig. 6 b,c). However, the protective effect of G-substrate was considerably diminished when Akt was reduced by siRNA. The G-substrate-induced decrease in cytotoxicity was reduced from 55.6 ± 8.1% with Akt present to 23.1 ± 4.9% with Akt knocked down (Fig. 6 c). These results support a significant role for Akt in mediating G-substrate-induced protection against 6-OHDA toxicity.
Figure 6.

Knockdown of endogenous Akt decreases G-substrate-induced protection against 6-OHDA. a, Western blot analysis confirmed that Akt siRNA application in BE(2)-M17 cells substantially reduced the Akt protein levels. b, Cytotoxicity was measured in the presence or absence of 50 μm 6-OHDA treatment after applying control or Akt siRNA to both control and G-substrate-expressing cells. Data are shown as means ± SEM of four independent experiments (*p < 0.001, one-way ANOVA, Tukey's test). These data were used to generate the percentage decrease in cytotoxicity afforded by G-substrate [(control − G-substrate)/control] in the presence of Akt (55.6 ± 8.1%) or with Akt knocked down (23.1 ± 4.9%; c). Data are shown as means ± SEM of four independent experiments (**p < 0.05, two-tailed t test).
Lentiviral delivery of G-substrate into the substantia nigra protects midbrain dopaminergic neurons in a retrograde 6-OHDA in vivo lesion model
In light of our in vitro data demonstrating a protective role of G-substrate against 6-OHDA (Fig. 3), we examined whether or not vulnerable A9 DA neurons in vivo were protected from the retrograde 6-OHDA lesion by G-substrate overexpression. First, we determined the transduction efficiency of lentivirus encoding G-substrate (lenti-G-substrate) after stereotactic injection immediately dorsal to the rat SN. Lenti-G-substrate transduced TH-positive neurons to varying degrees depending on the anatomical level. The best transduction efficiency was achieved in the rostral and medial SN (Fig. 7 a–f) (supplemental Table 1, available at www.jneurosci.org as supplemental material), whereas very few TH-positive cells were transduced in either caudal or extreme rostral SN. Approximately 22% TH-positive neurons were transduced with lenti-G-substrate injections within the rostral and medial SN, and all of the following analyses were focused within these anatomical boundaries (see Materials and Methods). Importantly, transduction of G-substrate into naive rats did not alter the total number of TH-positive neurons in midbrain compared with GFP-transduced rats (Fig. 7 p). To examine neuroprotection against 6-OHDA-induced toxicity, we injected 6-OHDA into the striatum of rats in which either G-substrate or control genes (empty vector or YFP) had been delivered previously to the midbrain. Retrograde 6-OHDA lesioning within the striatum is a well established method of creating progressive degeneration of A9 DA neurons. In this model, loss of TH immunoreactivity reflects actual loss of DA neurons, confirmed with fluorogold retrograde labeling (Sauer and Oertel, 1994). In our experiments, 6-OHDA induced ∼80% loss of TH-positive neurons in the midbrain (Fig. 7 q) and a near complete loss of TH immunoreactivity in the striatum (data not shown). The severity of the striatal insult in this paradigm precluded our ability to usefully measure protection of striatal nerve terminals. However, despite the severity of the insult, lenti-G-substrate-transduced rats had a significantly higher number of surviving TH-positive neurons than control lentivirus (empty vector or YFP)-injected rats (Fig. 7 m–o,q). Furthermore, most of the surviving TH-positive neurons in lenti-G-substrate-transduced rats were strongly G-substrate positive (Fig. 7 g–l). In fact, considering that only ∼22% of total TH-positive neurons were transduced with G-substrate, the ∼10% DA neuronal protection achieved by G-substrate in vivo indicates that ∼50% of transduced DA neurons were protected from 6-OHDA-induced toxicity. Thus, these data substantially extend our in vitro findings that increased levels of G-substrate decreases the vulnerability of A9 DA neurons in vivo. To further corroborate our in vitro findings in which G-substrate overexpression increased the basal levels of pAkt and pGSK3β in BE(2)-M17 cells (Fig. 5), we examined the levels of these phospho epitopes after in vivo injection of lenti-G-substrate into the A9 area in the absence of the 6-OHDA lesion. In the midbrain, the G-substrate-injected SN showed increased pAkt levels compared with the control virus-injected SN, whereas pGSK3β levels remained unchanged (Fig. 7 r,s). In the striatum, both pAkt and pGSK3β levels were significantly elevated by nigral delivery of lenti-G-substrate (Fig. 7 t,u). These results indicate that the G-substrate-mediated increases in pAkt and pGSK3β levels may contribute to the neuroprotection observed in the in vivo experiments.
Figure 7.

Nigral injection of G-substrate lentivirus protects midbrain dopaminergic neurons in retrograde 6-OHDA lesion model. TH (a, d, g, j) and G-substrate (b, e, h, k) were stained in rat midbrain. a–c, Endogenous G-substrate expression in untransduced midbrain DA neurons. d–f, When lenti-G-substrate was injected directly above nigra, 14–30% of TH-positive cells showed higher levels of G-substrate expression than endogenous levels. Lenti-G-substrate injection (n = 6) did not alter the total number of TH-positive cells compared with the lenti-GFP-injected rat (n = 6) (p) (not significant, two-tailed t test). After 6-OHDA lesion, more TH-positive neurons remained in lenti-G-substrate-injected rats (n = 9) compared with control lentivirus (empty vector, n = 9; or YFP, n = 14) injected nigra (q). Data are shown as means ± SEM (*p < 0.004, **p < 0.001, one-way ANOVA, Tukey's test). j–l, Most of the remaining TH-positive neurons in lenti-G-substrate-injected midbrain were strongly G-substrate-positive r, s, The G-substrate-transduced nigra (n = 10) shows increased levels of pAkt compared with the control (empty vector, n = 10) lentivirus transduced nigra, whereas pGSK3β levels remained unchanged. t, u, Conversely, the striatum of G-substrate-injected rat showed an increase in both pAkt and pGSK3β levels. Data are shown as mean ± SEM [*p < 0.01, **p < 0.001, two-tailed t test, not significant (n.s.)].
Discussion
Regardless of etiology, A9 DA neurons are more vulnerable than the immediately adjacent A10 DA neurons in both PD and animal models of this disease. Inherent biochemical and physiological differences may mediate this differential vulnerability by changing the threshold of the different neuronal groups to neurotoxic insults (Isacson, 1993). Thus, at their physiologic baseline, A10 DA neurons may be better able to maintain their structural and functional integrity against such insults. Here we show that the endogenous level of G-substrate, an inhibitor of Ser/Thr protein phosphatases, is higher in the less vulnerable A10 DA neurons in both rodent and human midbrain. G-substrate reduces susceptibility to PD-relevant neurotoxins in vitro and of A9 DA neurons in an animal model of PD. The protective effect of G-substrate may be, at least in part, mediated by increased pAkt levels. Our results suggest that the relatively higher expression of G-substrate in A10 DA neurons may increase their resistance to pathogenic processes in PD. Augmenting G-substrate levels may thus be a therapeutic strategy in protecting A9 DA neurons.
Mechanism of G-substrate-mediated protection
We explored the potential mechanisms through which G-substrate is protective. Little is known about the function of G-substrate, although, in an in vitro cell-free system, purified PKG-phosphorylated G-substrate inhibits the activities of purified PP1 or PP2A catalytic subunits (Endo et al., 1999; Hall et al., 1999). These findings raised the possibility that G-substrate mediates neuroprotective effects by inhibiting Ser/Thr protein phosphatase activities. In support of this idea, our results show that G-substrate is involved in modulation of cellular PP2A activity. In addition, given that the mutant form of G-substrate with reduced PP2A-inhibitory function exhibited significantly diminished protection, the PP2A inhibitory role of G-substrate is, at least in part, responsible for the protective effect.
Ser/Thr phosphatases are known to play a key role in regulating a variety of intracellular signaling pathways, including cell growth, the DNA damage response, and apoptosis (Garcia et al., 2003; Van Hoof and Goris, 2003; Chatfield and Eastman, 2004). PP2A can be either prosurvival or proapoptotic, depending on the context. Proapoptotic effects are mediated by PP2A when it dephosphorylates and decreases the activity of antiapoptotic molecules (Akt, Erk1, Erk2, and Bcl-2) and, conversely, dephosphorylates and increases the activity of proapoptotic signaling molecules (GSK3β and Bad) (Millward et al., 1999; Van Hoof and Goris, 2003; Chatfield and Eastman, 2004; Chen et al., 2004; Ray et al., 2005). In other contexts, PP2A activation can be prosurvival by decreasing activity of proapoptotic substrates such as p38 (Choi et al., 2004; Ou et al., 2006; Ruano et al., 2006) and p53 (Yan et al., 1997; Messner et al., 2006). It is thus not surprising that broad inhibition of PP2A using okadaic acid, calyculin A, or siRNA can produce inconsistent effects on cell survival (Wolf and Eastman, 1999; Zeevalk et al., 2001; Strack et al., 2004; Jangati et al., 2006). In our culture models, inhibition of PP2A by okadaic acid, calyculin A, or PP2A siRNA did not protect BE(2)-M17 cells from 6-OHDA in contrast to G-substrate, which was protective (supplemental Fig. 2, available at www.jneurosci.org as supplemental material). When total cellular PP2A activity was measured using immunoprecipitated PP2A catalytic subunit (PP2Ac), G-substrate-overexpressing cells surprisingly had slightly higher PP2A activity than control cells, despite the presence of phosphorylated active G-substrate in these cells. This differed from okadaic acid, which dramatically (∼80%) reduced PP2A activity. The increased cellular PP2A activity in G-substrate-expressing cells might be a compensatory response against overexpression of this endogenous PP2A inhibitor. Interestingly, the increase at baseline PP2A activity was not reflected in a reduction of the phosphorylation levels of any of the PP2A targets examined. In fact, the baseline phosphorylation levels of pAkt and pGSK3β were increased in G-substrate-overexpressing cells, corresponding with the increased phosphorylated G-substrate levels in these cells.
In line with dramatically reducing cellular PP2A activity, okadaic acid or calyculin A have been shown to alter basal levels of pAkt, pGSK3β, pErk1/2, and p38 without discrimination (Chatfield and Eastman, 2004; Alvarado-Kristensson and Andersson, 2005). In contrast, G-substrate overexpression altered the basal levels of certain PP2A substrates, including pAkt and pGSK3β, but not others, including pErk1/2 and p38. When exposed to 6-OHDA, pAkt, pGSK3β, and pErk2 were elevated in G-substrate-overexpressing cells compared with control cells, whereas the proapoptotic PP2A substrate p38 was not affected by G-substrate overexpression. In addition, the phosphorylation levels of two other PP2A substrates, TH and p53, were not altered by G-substrate overexpression (C. Y. Chung and J. B. Koprich, unpublished observation). One intriguing explanation is that G-substrate may inhibit PP2A in a substrate-specific manner. In a cellular environment, PP2Ac interacts with various regulatory subunits and interacting molecules, which determine the substrate specificity and subcellular distribution of this enzyme (Lechward et al., 2001). G-substrate may bind at sites other than the active site of the catalytic subunit, which may regulate substrate specificity and subcellular localization, as has been proposed for other phosphatase inhibitors (Kwon et al., 1997; Hall et al., 1999). Establishing a direct relationship between the change in phosphoprotein levels and PP2A inhibition by G-substrate, however, is inherently difficult in a cellular context. For example, RNAi to PP2A changes the baseline phosphorylation levels of PP2A targets, making the interpretation of findings ambiguous. Indeed, although our data offer support for a PP2A-dependent mechanism, the changes in the phosphoproteins described in this study may be related to as yet unknown functions of G-substrate, independent of PP2A inhibition.
G-substrate phosphorylation and its subsequent activity is dependent on the activity of cellular kinases, including PKG, which may be altered by stimuli given to cells. Our results show that, after 6-OHDA exposure, there is an increase in phosphorylated G-substrate levels, corresponding to a reduction of PP2A activity in G-substrate-expressing cells exposed to 6-OHDA. These results indicate that cellular response against 6-OHDA may activate kinases that can phosphorylate G-substrate. This response may constitute a protective cellular response. Such protection may be facilitated by having higher endogenous levels of G-substrate at physiological baseline, as is the case in A10 compared with A9 DA neurons.
G-substrate-mediated neuroprotection in vivo
Because our in vitro data demonstrated that G-substrate is protective, we investigated the effect of increased G-substrate expression levels in A9 DA neurons with or without 6-OHDA lesioning in vivo. At baseline, in the absence of a 6-OHDA lesion, we found that lentiviral delivery of G-substrate into the A9 area resulted in elevated basal levels of pAkt in the midbrain and of pAkt and pGSK3β in the striatum, corroborating the effects observed in the in vitro experiments. Furthermore, with an average transduction efficiency of 22%, G-substrate rescued 10% of the total number of TH-positive A9 neurons against the lesion induced by the striatal infusion of 6-OHDA. Given the transduction efficiency, these data indicate that 50% of G-substrate-transduced A9 DA neurons were protected against 6-OHDA toxicity in vivo. Therefore, it is reasonable to assume that increased transduction efficiency would confer even greater protection. It is also worth noting that the retrograde 6-OHDA lesion was extremely severe in our paradigm, inducing almost an 80% loss of TH-positive neurons in the midbrain and a near complete loss of TH-positive striatal terminals. The ability of G-substrate to protect A9 DA neurons under such severe lesion conditions is thus all the more impressive.
Selective or relative neuronal vulnerability is a common feature of neurodegenerative diseases. The different susceptibilities to degeneration of A9 and A10 DA neurons in PD is a striking example of this phenomenon. In this study, using data from the transcriptional profiling of A9 and A10 DA neurons, the results show that modulating the expression level of a single molecule, G-substrate, can alter susceptibility to PD-relevant neurotoxins in vitro and of DA neurons in an in vivo model of PD. In these experiments, the protective effect mediated by G-substrate is associated with altering the activity of PP2A and key cell survival regulators, including Akt, underscoring the importance of these signaling pathways in DA neuron survival (Chen et al., 2004; Yang et al., 2005; Ries et al., 2006). In a broader perspective, these findings illustrate that the analysis of proteins differentially expressed in subsets of DA neurons can give clues to pathophysiological processes for PD and provide new strategies for developing neuroprotective therapies relevant to this disease.
Footnotes
This work was supported by funds from the National Institutes of Health/National Institute of Neurological Disorders and Stroke P50 Parkinson's Disease Udall Research Centers of Excellence to McLean/Harvard Medical School, the Michael Stern Foundation for Parkinson's Disease Research, and the Consolidated Anti-Aging Foundation (O. I.), and was conducted at McLean Hospital and in part at the facilities and collaborative network provided by the Harvard Center for Neurodegeneration and Repair. We thank Dr. Vikram Khurana for discussion and critical reading of this manuscript and Casper Reske-Nielsen, Kari Ording, Michaela Patterson, Yalda Sadeghi, Prabhakar Mithal, Masako Suzuki, and Moe Hein Aung for their excellent technical assistance. We are grateful to Dr. Anne Cataldo for providing technical guidance in staining of human tissue and Dr. Mel Feany for helpful discussion. We also thank Dr. Mark Cookson for kindly providing BE(2)-M17 cells.
References
- Alvarado-Kristensson M, Andersson T. Protein phosphatase 2A regulates apoptosis in neutrophils by dephosphorylating both p38 MAPK and its substrate caspase 3. J Biol Chem. 2005;280:6238–6244. doi: 10.1074/jbc.M409718200. [DOI] [PubMed] [Google Scholar]
- Aswad DW, Greengard P. A specific substrate from rabbit cerebellum for guanosine 3′:5′-monophosphate-dependent protein kinase. I. Purification and characterization. J Biol Chem. 1981;256:3487–3493. [PubMed] [Google Scholar]
- Chatfield K, Eastman A. Inhibitors of protein phosphatases 1 and 2A differentially prevent intrinsic and extrinsic apoptosis pathways. Biochem Biophys Res Commun. 2004;323:1313–1320. doi: 10.1016/j.bbrc.2004.09.003. [DOI] [PubMed] [Google Scholar]
- Chen G, Bower KA, Ma C, Fang S, Thiele CJ, Luo J. Glycogen synthase kinase 3beta (GSK3beta) mediates 6-hydroxydopamine-induced neuronal death. FASEB J. 2004;18:1162–1164. doi: 10.1096/fj.04-1551fje. [DOI] [PubMed] [Google Scholar]
- Choi WS, Eom DS, Han BS, Kim WK, Han BH, Choi EJ, Oh TH, Markelonis GJ, Cho JW, Oh YJ. Phosphorylation of p38 MAPK induced by oxidative stress is linked to activation of both caspase-8- and -9-mediated apoptotic pathways in dopaminergic neurons. J Biol Chem. 2004;279:20451–20460. doi: 10.1074/jbc.M311164200. [DOI] [PubMed] [Google Scholar]
- Chung CY, Seo H, Sonntag KC, Brooks A, Lin L, Isacson O. Cell type-specific gene expression of midbrain dopaminergic neurons reveals molecules involved in their vulnerability and protection. Hum Mol Genet. 2005;14:1709–1725. doi: 10.1093/hmg/ddi178. [DOI] [PMC free article] [PubMed] [Google Scholar]
- Endo S, Suzuki M, Sumi M, Nairn AC, Morita R, Yamakawa K, Greengard P, Ito M. Molecular identification of human G-substrate, a possible downstream component of the cGMP-dependent protein kinase cascade in cerebellar Purkinje cells. Proc Natl Acad Sci USA. 1999;96:2467–2472. doi: 10.1073/pnas.96.5.2467. [DOI] [PMC free article] [PubMed] [Google Scholar]
- Endo S, Nairn AC, Greengard P, Ito M. Thr123 of rat G-substrate contributes to its action as a protein phosphatase inhibitor. Neurosci Res. 2003;45:79–89. doi: 10.1016/s0168-0102(02)00199-2. [DOI] [PubMed] [Google Scholar]
- Garcia A, Cayla X, Guergnon J, Dessauge F, Hospital V, Rebollo MP, Fleischer A, Rebollo A. Serine/threonine protein phosphatases PP1 and PP2A are key players in apoptosis. Biochimie. 2003;85:721–726. doi: 10.1016/j.biochi.2003.09.004. [DOI] [PubMed] [Google Scholar]
- German DC, Dubach M, Askari S, Speciale SG, Bowden DM. 1-Methyl-4-phenyl-1,2,3,6-tetrahydropyridine-induced parkinsonian syndrome in Macaca fascicularis: which midbrain dopaminergic neurons are lost? Neuroscience. 1988;24:161–174. doi: 10.1016/0306-4522(88)90320-x. [DOI] [PubMed] [Google Scholar]
- Greene JG, Dingledine R, Greenamyre JT. Gene expression profiling of rat midbrain dopamine neurons: implications for selective vulnerability in parkinsonism. Neurobiol Dis. 2005;18:19–31. doi: 10.1016/j.nbd.2004.10.003. [DOI] [PubMed] [Google Scholar]
- Grimm J, Mueller A, Hefti F, Rosenthal A. Molecular basis for catecholaminergic neuron diversity. Proc Natl Acad Sci USA. 2004;101:13891–13896. doi: 10.1073/pnas.0405340101. [DOI] [PMC free article] [PubMed] [Google Scholar]
- Hall KU, Collins SP, Gamm DM, Massa E, DePaoli-Roach AA, Uhler MD. Phosphorylation-dependent inhibition of protein phosphatase-1 by G-substrate. A Purkinje cell substrate of the cyclic GMP-dependent protein kinase. J Biol Chem. 1999;274:3485–3495. doi: 10.1074/jbc.274.6.3485. [DOI] [PubMed] [Google Scholar]
- Hirsch E, Graybiel AM, Agid YA. Melanized dopaminergic neurons are differentially susceptible to degeneration in Parkinson's disease. Nature. 1988;334:345–348. doi: 10.1038/334345a0. [DOI] [PubMed] [Google Scholar]
- Honkanen RE, Golden T. Regulators of serine/threonine protein phosphatases at the dawn of a clinical era? Curr Med Chem. 2002;9:2055–2075. doi: 10.2174/0929867023368836. [DOI] [PubMed] [Google Scholar]
- Isacson O. On neuronal health. Trends Neurosci. 1993;16:306–308. doi: 10.1016/0166-2236(93)90104-t. [DOI] [PubMed] [Google Scholar]
- Jangati GR, Veluthakal R, Kowluru A. siRNA-mediated depletion of endogenous protein phosphatase 2Acalpha markedly attenuates ceramide-activated protein phosphatase activity in insulin-secreting INS-832/13 cells. Biochem Biophys Res Commun. 2006;348:649–652. doi: 10.1016/j.bbrc.2006.07.100. [DOI] [PubMed] [Google Scholar]
- Kwon YG, Huang HB, Desdouits F, Girault JA, Greengard P, Nairn AC. Characterization of the interaction between DARPP-32 and protein phosphatase 1 (PP-1): DARPP-32 peptides antagonize the interaction of PP-1 with binding proteins. Proc Natl Acad Sci USA. 1997;94:3536–3541. doi: 10.1073/pnas.94.8.3536. [DOI] [PMC free article] [PubMed] [Google Scholar]
- Lechward K, Awotunde OS, Swiatek W, Muszynska G. Protein phosphatase 2A: variety of forms and diversity of functions. Acta Biochim Pol. 2001;48:921–933. [PubMed] [Google Scholar]
- Livak KJ, Schmittgen TD. Analysis of relative gene expression data using real-time quantitative PCR and the 2(-Delta Delta C(T)) method. Methods. 2001;25:402–408. doi: 10.1006/meth.2001.1262. [DOI] [PubMed] [Google Scholar]
- Messner DJ, Romeo C, Boynton A, Rossie S. Inhibition of PP2A, but not PP5, mediates p53 activation by low levels of okadaic acid in rat liver epithelial cells. J Cell Biochem. 2006;99:241–255. doi: 10.1002/jcb.20919. [DOI] [PubMed] [Google Scholar]
- Millward TA, Zolnierowicz S, Hemmings BA. Regulation of protein kinase cascades by protein phosphatase 2A. Trends Biochem Sci. 1999;24:186–191. doi: 10.1016/s0968-0004(99)01375-4. [DOI] [PubMed] [Google Scholar]
- Ou XM, Chen K, Shih JC. Monoamine oxidase A and repressor R1 are involved in apoptotic signaling pathway. Proc Natl Acad Sci USA. 2006;103:10923–10928. doi: 10.1073/pnas.0601515103. [DOI] [PMC free article] [PubMed] [Google Scholar]
- Paxinos G, Watson C. Ed 2. San Diego: Academic; 1986. The rat brain in stereotaxic coordinates. [DOI] [PubMed] [Google Scholar]
- Peng X, Tehranian R, Dietrich P, Stefanis L, Perez RG. Alpha-synuclein activation of protein phosphatase 2A reduces tyrosine hydroxylase phosphorylation in dopaminergic cells. J Cell Sci. 2005;118:3523–3530. doi: 10.1242/jcs.02481. [DOI] [PubMed] [Google Scholar]
- Ray RM, Bhattacharya S, Johnson LR. Protein phosphatase 2A regulates apoptosis in intestinal epithelial cells. J Biol Chem. 2005;280:31091–31100. doi: 10.1074/jbc.M503041200. [DOI] [PubMed] [Google Scholar]
- Ries V, Henchcliffe C, Kareva T, Rzhetskaya M, Bland R, During MJ, Kholodilov N, Burke RE. Oncoprotein Akt/PKB induces trophic effects in murine models of Parkinson's disease. Proc Natl Acad Sci USA. 2006;103:18757–18762. doi: 10.1073/pnas.0606401103. [DOI] [PMC free article] [PubMed] [Google Scholar]
- Rodriguez M, Barroso-Chinea P, Abdala P, Obeso J, Gonzalez-Hernandez T. Dopamine cell degeneration induced by intraventricular administration of 6-hydroxydopamine in the rat: similarities with cell loss in Parkinson's disease. Exp Neurol. 2001;169:163–181. doi: 10.1006/exnr.2000.7624. [DOI] [PubMed] [Google Scholar]
- Ruano D, Revilla E, Gavilan MP, Vizuete ML, Pintado C, Vitorica J, Castano A. Role of p38 and inducible nitric oxide synthase in the in vivo dopaminergic cells' degeneration induced by inflammatory processes after lipopolysaccharide injection. Neuroscience. 2006;140:1157–1168. doi: 10.1016/j.neuroscience.2006.02.073. [DOI] [PubMed] [Google Scholar]
- Sauer H, Oertel WH. Progressive degeneration of nigrostriatal dopamine neurons following intrastriatal terminal lesions with 6-hydroxydopamine: a combined retrograde tracing and immunocytochemical study in the rat. Neuroscience. 1994;59:401–415. doi: 10.1016/0306-4522(94)90605-x. [DOI] [PubMed] [Google Scholar]
- Song G, Ouyang G, Bao S. The activation of Akt/PKB signaling pathway and cell survival. J Cell Mol Med. 2005;9:59–71. doi: 10.1111/j.1582-4934.2005.tb00337.x. [DOI] [PMC free article] [PubMed] [Google Scholar]
- Strack S, Cribbs JT, Gomez L. Critical role for protein phosphatase 2A heterotrimers in mammalian cell survival. J Biol Chem. 2004;279:47732–47739. doi: 10.1074/jbc.M408015200. [DOI] [PubMed] [Google Scholar]
- Tamura Y, Simizu S, Osada H. The phosphorylation status and anti-apoptotic activity of Bcl-2 are regulated by ERK and protein phosphatase 2A on the mitochondria. FEBS Lett. 2004;569:249–255. doi: 10.1016/j.febslet.2004.06.003. [DOI] [PubMed] [Google Scholar]
- Van Hoof C, Goris J. Phosphatases in apoptosis: to be or not to be, PP2A is in the heart of the question. Biochim Biophys Acta. 2003;1640:97–104. doi: 10.1016/s0167-4889(03)00029-6. [DOI] [PubMed] [Google Scholar]
- West MJ. New stereological methods for counting neurons. Neurobiol Aging. 1993;14:275–285. doi: 10.1016/0197-4580(93)90112-o. [DOI] [PubMed] [Google Scholar]
- West MJ, Gundersen HJ. Unbiased stereological estimation of the number of neurons in the human hippocampus. J Comp Neurol. 1990;296:1–22. doi: 10.1002/cne.902960102. [DOI] [PubMed] [Google Scholar]
- Wolf CM, Eastman A. The temporal relationship between protein phosphatase, mitochondrial cytochrome c release, and caspase activation in apoptosis. Exp Cell Res. 1999;247:505–513. doi: 10.1006/excr.1998.4380. [DOI] [PubMed] [Google Scholar]
- Yan Y, Shay JW, Wright WE, Mumby MC. Inhibition of protein phosphatase activity induces p53-dependent apoptosis in the absence of p53 transactivation. J Biol Chem. 1997;272:15220–15226. doi: 10.1074/jbc.272.24.15220. [DOI] [PubMed] [Google Scholar]
- Yang Y, Gehrke S, Haque ME, Imai Y, Kosek J, Yang L, Beal MF, Nishimura I, Wakamatsu K, Ito S, Takahashi R, Lu B. Inactivation of Drosophila DJ-1 leads to impairments of oxidative stress response and phosphatidylinositol 3-kinase/Akt signaling. Proc Natl Acad Sci USA. 2005;102:13670–13675. doi: 10.1073/pnas.0504610102. [DOI] [PMC free article] [PubMed] [Google Scholar]
- Zeevalk GD, Bernard LP, Manzino L, Sonsalla PK. Differential sensitivity of mesencephalic neurons to inhibition of phosphatase 2A. J Pharmacol Exp Ther. 2001;298:925–933. [PubMed] [Google Scholar]