

Abstract
Pseudomonas aeruginosa is an opportunistic pathogen that causes serious respiratory disease in the immune compromised host. Using an aerosol infection model, eleven inbred mouse strains (129/Sv, A/J, BALB/c, C3H/HeN, C57BL/6, DBA/2, FVB, B10.D2/oSnJ, B10.D2/nSnJ, AKR/J and SWR/J) were tested for increased susceptibility to P. aeruginosa lung colonizations. DBA/2 was the only mouse strain that had increased bacterial counts in the lung within 6h post infection. This deficiency incited a marked inflammatory response with reduced bacterial lung clearance and a mortality rate of 96.7%. DBA/2 displayed progressive deterioration of lung pathology with extensive alveolar exudate and edema formation at 48-72h post infection. The neutrophil-specific myeloperoxidase activity remained elevated throughout infection, suggesting that the increased leukocyte infiltrations into alveoli caused acute inflammatory lung injury. DBA/2 lacks the hemolytic complement; however, three additional mouse strains (AKR/J, SWR/J and A/J) with the same defect effectively cleared the infection, indicating other host factors are involved in the defense. Bone marrow derived macrophages of DBA/2 showed an initial increase in phagocytosis, while their bactericidal activity was reduced compared to that of C57BL/6 macrophages. Comparison of pulmonary cytokine profiles of DBA/2 vs. C57BL/6 or C3H/HeN indicated DBA/2 had a similar increase in TNFα, KC, and IL-1a as C3H/HeN but showed specific induction of IL-17, MCP-1, and VEGF. Together, DBA/2 mice have a defect in the initial lung defense against P. aeruginosa colonization, which causes the host to produce a greater, but damaging, inflammatory response. Such a response may originate from the reduced antimicrobial activity of DBA/2 macrophages.
Keywords: Lung, Inflammation, Neutrophil, Macrophage, Cytokines
Introduction
Immunocompromised patients, including cancer and burn patients, those hospitalized in intensive care units, and those with human immunodeficiency virus (HIV) are at a higher risk for respiratory colonization and developing pneumonia with various bacterial pathogens. Respiratory diseases accounted for 11% of patients hospitalized in the United States in 2003, with a 37% diagnosis of pneumonia (DeFrances et al., 2005). A recent survey of nosocomial pneumonia identified P. aeruginosa as the number one isolated bacteria with the second highest mortality rate (Lee et al., 2005). P. aeruginosa is a ubiquitous microorganism in nature that rarely causes disease in healthy individuals. However, it is capable of targeting immune compromised individuals, and is a predominant airway pathogen in bacterial pneumonia. It remains unclear how this pathogen establishes its initial colonization within its hosts. There are also host factors that play significant roles in susceptibility. Acute pneumonias often begin with the inhalation and/or aspiration of the bacteria-laden droplets produced from the upper respiratory tracts (Ramphal, 2001). Subsequent colonization of these microorganisms deep into the lungs results in the clinical manifestations of lung disease.
To simulate a natural route for acquiring deep-lung infections in mice, we used a bacterial aerosol delivery technology (Orme & Collins, 1994) for the deposition of airborne pathogens into the alveoli of the mouse lungs, causing acute airway colonizations (Yu et al., 1998a; Yu et al., 2000; Yu & Head, 2002). To better understand the etiology of bacterial lung infections in conjunction with host genetic factors, we examined eleven inbred mouse strains for the initial phase of lung colonization caused by P. aeruginosa aerosols. We report that an inbred mouse strain, DBA/2, is highly susceptible to bacterial airway colonizations by P. aeruginosa compared to other inbred strains. Also, we characterize the infection-specific phenotype in DBA/2 mice in terms of lung histopathology, neutrophil recruitment as measured with a neutrophil-specific marker (myeloperoxidase), macrophage phagocytosis and killing, and cytokine production. The infection mouse model described here displays many symptoms similar to the acute inflammatory lung injury as seen in humans. We conclude that the increased susceptibility in DBA/2 mice is associated with exaggerated neutrophilic inflammation and defects in the killing ability of naïve macrophages.
Materials and Methods
Mice
All mice in this study were 6-8 wks old at the inception of the experiment. They were purchased from Charles River Laboratories (Wilmington, MA) and The Jackson Laboratory (Bar Harbor, ME). All mice used throughout this study were males except for the lung colonization which was determined with both DBA/2 males and females (Fig. 1A). The mice were housed under the conventional facility within the Division of Animal Resources (DAR) at the Marshall University School of Medicine, which is AAALAC accredited. The DAR routinely monitors for bacteriological and viral contamination which were found negative throughout this study. All manipulations with live animals were performed in compliance with NIH Guidelines for the Care and Use of Laboratory Animals. DBA/2 = D2, C57BL/6 = B6 and C3H/HeN = C3.
Figure 1. Differential susceptibility to lung colonization by P. aeruginosa in inbred mouse strains.

(A). Mice were exposed to P. aeruginosa aerosols. Shown is the box plot of viable counts 6 h post exposure from the right lung (line within each box is the median, upper and lower lines of the box: 75 and 25 percentiles, respectively; upper and lower black circles: 95 and 5 percentiles, respectively). Three strains of P. aeruginosa were used: PAO1, CF149 and 311058. The number below each bacterial strain is the log of the average combined initial delivery dosage to the mouse lungs from 8 separate trials for P. aeruginosa PAO1, and 1 trial each for CF149 and 311058, normalized based on the lung weight. The number below each box indicates the number of mice used. D2M and D2F indicate D2 males and females, respectively. * = p<0.01 (one-way ANOVA and Mann-Whitney rank sum test). (B). Lung clearance kinetics after respiratory exposure to P. aeruginosa PAO1. The initial deposition of PAO1 is shown on the y axis at time 0, which was determined with five B6 mice sacrificed immediately after exposure. CFUs were determined at each time point using five exposed mice per strain. Due to mortality from the exposed D2 mice, only 4 mice were used for CFU counts at time = 48 and 72 h (* = p<0.05 D2 vs. B6, # = p<0.05 D2 vs. C3, and † = p<0.05 B6 vs. C3).
Bacterial strains and lung infection model
The reference strains of P. aeruginosa PAO1 (Stover et al., 2000) and P. aeruginosa pMRP-1, a GFP labeled isogenic strain of PAO1, were used throughout this study unless stated otherwise. P. aeruginosa pMRP-1 contains the GFP expression vector pMRP9-1 (Davies et al., 1998) and constitutively expresses GFP. P. aeruginosa strains CF149 and 311058, both of clinical origin, were as previously described (Head & Yu, 2004). P. aeruginosa strain PA14 was provided by Dr. F. Ausubel from Harvard Medical School.
The model is based on a bacterial aerosol induced lung infection (Head & Yu, 2004; Yu et al., 1998b; Yu & Head, 2002) with the following modifications. To prepare the infection dose for nebulization, 125 ml of LB (Lennox Broth, BD Difco, Franklin Lakes, NJ) culture for each bacterial strain was grown for 13-15 h with aeration at 37°C. The cells were pelleted by centrifugation at 5,800 × g for 15 minutes at 4°C and resuspended in 7-10 ml of PBS, pH 7.4 in 1% Proteose Peptone (BD Difco, PPBS). The wet cell mass of the bacterial pellet was weighed, and viable counts of the suspension were determined to ensure that a uniform amount of bacteria was used for nebulization. Five milliliters of bacterial suspension were dispensed into the nebulizer-Venturi unit of the Inhalation Exposure System (Glas-Col, Terre Haute, IN) and aerosolized for 30 minutes (compressed air control = 15-20, vacuum control = 50) followed by cloud decay for 25 minutes and ultraviolet light decontamination for 5 minutes. Five B6 mice were sacrificed immediately post exposure at time = 0 to determine the initial deposition dose in the lung. Each group of tested mice was terminated at time = 6, 12, 24, 48 or 72 h for the kinetics of lung clearance. Mice were terminated by carbon dioxide inhalation. Whole lungs were removed in bloc with the right lung homogenized in 1 ml PPBS using a motorized Ultra-Turrax T8 Homogenizer (IKA-WERKE, Germany). The lung homogenates were assayed for viable bacteria via 10-fold serial dilutions in PPBS with plate counts on LB agar. The viable bacterial counts recovered from the mouse lungs were normalized based on the lung mass. The remaining lung homogenate samples were stored at -80°C for cytokine and myeloperoxidase activity analysis. The left lungs were used for histology.
Histopathology
Left lungs were inflated in situ with 2% paraformaldehyde in PBS, and fixed at room temperature for at least one week before changing to a fresh paraformaldehyde solution and stored at 4°C. The tissue was transferred to 10% neutral formalin and processed in a Tissue-Tek II Tissue Processor (Sakura Finetechnical Co., Ltd, Japan) for histology. After the sample was processed, it was embedded in paraffin, sectioned at 4 microns, and stained with H&E. The tissue slides were examined under an Olympus BX51 System Microscope attached to a DP70 Microscope Digital Camera. The captured images were analyzed with Image-Pro Plus software (v. 5.1, Media Cybernetics, Inc., Silver Spring, MD) on a Dell Optiplex GX280 computer.
MPO activity assay
The lung tissue-associated myeloperoxidase (MPO) activity was measured using an assay based on the oxidation of o-dianisidine hydrochloride (Bradley et al., 1982). The homogenized lung samples were diluted in 10 mM EDTA and 10% hexadecyltrimethylammonium bromide in 100 mM potassium phosphate (pH 6.0). Samples were vortexed and centrifuged at 14,000 × g for 10 minutes at room temperature. Diluents were allowed to react with a solution of o-dianisidine hydrochloride (0.167 mg/ml in 50 mM potassium phosphate, pH 6.0) and 0.006% H2O2. Samples were assayed in triplicate. Changes in absorbance at 450 nm were recorded for the initial 5 minutes of reaction. The extinction coefficient of the oxidized product of o-dianisidine is 11.3 mM-1cm-1, which was used to calculate the moles of H2O2 degraded. One unit of MPO activity is defined as the degradation of 1 μmol of H2O2/min/mg lung tissue at room temperature. Purified human MPO (BioDesign International, Saco, ME) was used as a positive and internal control for the assay accuracy (>99%).
Isolation of naïve macrophage
Bone marrow derived macrophages were produced from progenitor cells as described previously (Fortier & Falk, 2005) with some adjustments (Davies & Gordon, 2005). Briefly, bone marrow plugs were flushed from femurs and tibias with RPMI 1640. Cells (1-3×10⁷) were cultured in 10 ml RPMI medium supplemented with 10% FBS/15% L-cell conditioned medium/20% WEHI-3B conditioned medium in a 25 cm2 flask and kept at 37°C and 5% CO2. The following day the cell suspension was transferred to a 75 cm2 flask and on day 2 and 4 10 ml of supplemented medium was added. Cells were harvested after 7 days total using a cell scraper and plated on untreated plates in RPMI medium containing 10% FBS/15% L-cell conditioned medium. Cells were used the following day for the killing assay and within 7 days for flow cytometry and phagocytosis assays. This protocol yielded macrophages ≥80% enriched with contaminating monocyte precursors.
Epifluorescent microscopy
Macrophages were cultured on cell culture treated coverslips which were transferred to fresh macrophage culture medium and inoculated with a saturated overnight culture of P. aeruginosa pMRP-1 (1:75) and incubated at 37°C for 20 minutes. Cells were washed twice in RPMI and incubated in 5.0 μM ER-Tracker™ Blue-White DPX (Invitrogen) in macrophage culture medium at 37°C for 30 minutes. Cells were then placed in 1:1 PBS and RPMI medium containing 20 μg/ml ethidium bromide at room temperature for 5 minutes, washed twice in RPMI and wet-mounted in PBS. Cells were immediately visualized using the same system as in the phagocytosis assay with appropriate filters for epifluorescent analysis.
Phagocytosis assay
Macrophages were cultured from bone marrow isolated from the femurs and tibias of B6 and D2 mice, and were used to determine the degree of phagocytosis by each mouse strain. The assay was adapted from a protocol described previously (Campbell et al., 2005). Briefly, 5×10⁵ macrophages were mixed together with 1 ×10⁷ P. aeruginosa pMRP-1, a 1:20 ratio, in 500 μl of RPMI and 5% FBS. The mixture was tumbled end over end in a Labquake shaker model 400110 (Barnstead Int., Dubuque, Iowa) for 20 minutes at 37°C. Next, the macrophages were pelleted by centrifugation at 250 × g for 8 minutes at 4°C and washed twice with 500 μl of RPMI and 5% FBS to remove the majority of the extracellular bacteria and then resuspended in 150 μl of PBS. To distinguish between internalized and any remaining extracellular bacteria, ethidium bromide was added to a working concentration of 50 μg/ml. Ethidium bromide will turn any extracellular bacteria red while internalized bacteria will remain green. Macrophages were visualized on an Olympus BX51 epifluorescent microscope under 1000× magnification equipped with an X-Cite™ 120 fluorescence illumination system, Olympus DP70 Camera and associated software (DP Controller and DP manager) version 1.2.1.108. The phagocytosed bacteria were counted in 50 individual macrophages per mouse strain within 15 minutes from the addition of ethidium bromide. The phagocytotic index was calculated by taking the average number of bacteria, in macrophages containing bacteria, multiplied by the percentage of macrophages positive for bacteria.
Flow cytometry
Macrophages suspended in 500 μl of 5% FBS/RPMI medium were inoculated with 3×10⁶ P. aeruginosa pMRP9-1 (1:20) and incubated for 20, 60 or 120 minutes at 37°C while being rotated end over end on a Labquake shaker. Each time point was performed in triplicate with a mock infected control. After exposure to bacteria, cells were immediately placed on ice and analyzed on a Beckman Coulter Epics Altra Cytometer (Beckman Coulter, Fullerton, CA). Fifty thousand events were recorded and the data was analyzed using EXPO32 v1.2 software.
Bacterial killing assay
B6 or D2 macrophages were mixed in a 1:5 ratio (1.0 × 10⁵ macrophages per 100 μl of RPMI and 5% FBS with a total volume of 1 ml) with P. aeruginosa PAO1 grown overnight at 37°C from a single isolated colony. A control without macrophages was used to account for extracellular bacterial growth. Aliquots from the test samples and control were taken immediately after (time = 0) and at time = 20, 60, 90, 120, 150, 180, 240, and 300 minutes. The samples were tumbled at 37°C between time points. Colony forming units (CFUs) were determined by serial dilution and plating on LB agar plates. The aliquots for CFU determination at each time point were diluted in water and incubated at room temperature for 5 minutes to lyse the macrophages. The bacteria were pelleted by centrifugation at 10,000 × g for 1 minute and resuspended in PPBS to inhibit bacteria binding to plastics. All of the remaining dilutions used PPBS. The amount of killing was determined by plate count of surviving bacteria.
Cytokine assays
Assays were performed using the Beadlyte Mouse 21-Plex Cytokine Detection System (Upstate Biotechnology, Lake Placid, NY) according to the manufacturer’s instruction. Briefly, 50 μl of lung homogenate was incubated for 2 h with the Beadlyte Mouse 21-Plex Multi-Cytokine Beads in individual wells of a 96 well plate. Each sample was plated in duplicate. Next, 25 μl Beadlyte Mouse 21-Plex Multi-Cytokine biotin was added to each well and the plate was incubated for 1.5 h. Diluted Beadlyte Streptavidin-Phycoerythrin was added to the wells (25 μl per well) and the plate was incubated for 30 minutes. The plate was then read on a Luminex xMAP 100 (Upstate Biotechnology, Lake Placid, NY). The concentration of cytokine was then extrapolated from a standard curve using BeadView Data Analysis Software (Upstate Biotechnology, Lake Placid, NY). For construction of the dendrograms, log ratios of D2:B6 or D2:C3 at each time point for each cytokine were exported into Multiple Array Viewer Software (The Institute for Genomic Research, Rockville, MD). Hierarchical clustering was performed on the cytokines using Average Linkage and Euclidean Distance Metric. Clusters were cut at a distance threshold of 2.8 to produce the clusters.
Statistical analysis
Analysis of lung colonization (Fig. 1A) was done with one-way ANOVA followed by all pairwise multiple comparisons with the Tukey test. Mann-Whitney rank sum test was used to compare the medians of percent viable bacterial counts remaining in the lungs 6 h post infection. Analysis of the lung kinetic clearance (Fig. 1B) and the MPO activity (Fig. 3) was carried out with one-way repeated measure ANOVA and with Fisher’s protected least significant difference. Survival (Fig. 4) was analyzed by a log rank test followed by all pairwise multiple comparisons using the Holm-Sidak method. The data from the phagocytosis assay (Fig. 5C) was determined to not be normally distributed according to the empirical distribution function. The Kolmogorov-Smirnov non-parametric test was used to determine p-values since log transformation was not possible given elements with 0 values were present. The confidence level for all significance was set at 95%. For flow cytometry data (Fig. 5G), Overton analysis was performed on GFP+ events using a mock infected control as the reference, followed by a Student’s t test. p-values were corrected for multiple comparisons using the Tukey-Kramer method. ANOVA was performed on the data sets for each time-point for the killing assay (Fig. 5H). Those showing significance were tested using a Student’s t test assuming unequal variances and corrected for multiple comparisons using the Holm’s method. Single tailed t tests were used in comparisons with the control, while two tailed t tests were used in comparing D2 to B6. Significance between cytokine expression levels (Fig. 6) was calculated using a two tailed t test assuming unequal variances at each time point. All analyses were conducted with SigmaStat (v. 3.1, Systat Software, Inc., Richmond, CA) and SigmaPlot (v. 9.0, Systat Software, Inc.) software.
Figure 3. Elevated levels of MPO activity in D2 lungs.

B6, C3 and D2 mice were infected at the same time with P. aeruginosa PAO1 aerosols, in the same fashion as in Fig. 1B. The lung homogenates were used to measure the MPO activity as described in Materials and Methods. Each time point represents the average MPO activity from five mice with SD (* = p<0.05 D2 vs. B6, # = p<0.05 D2 vs. C3, and †= p<0.05 B6 vs. C3)
Figure 4. C5-deficient inbred mouse strains display a differential susceptibility to lung infection by P. aeruginosa.
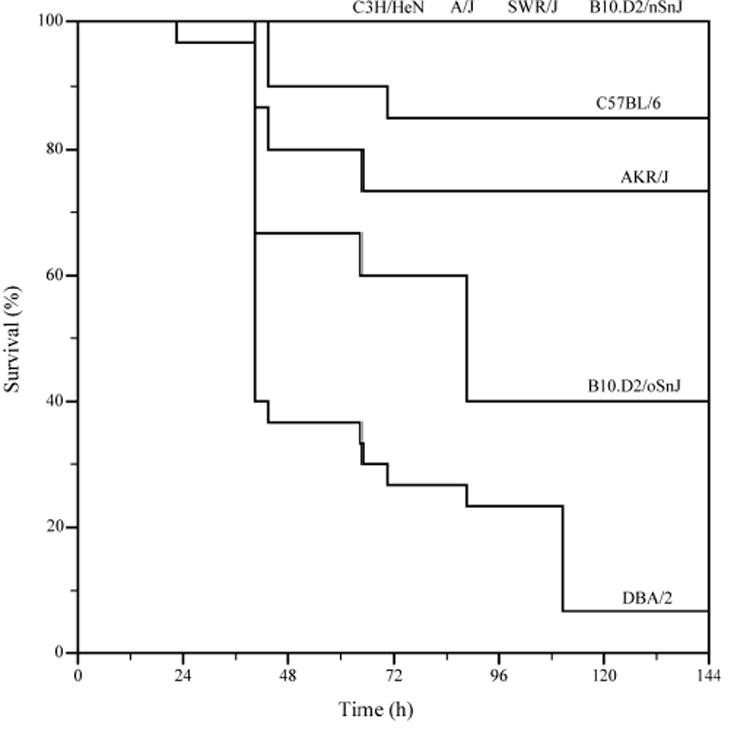
Log-rank survival test of the inbred mouse strains after exposure to P. aeruginosa PAO1. Mouse lungs of A/J, SWR/J, B10.D2/nSnJ, B6, AKR/J, B10.D2/oSnJ, C3 and D2 strains were infected with PAO1 to monitor the mortality. A/J, SWR/J, B10.D2/oSnJ, and DBA/2 mice are C5-deficient.
Figure 5. D2 naive macrophages have different phagocytotic and bactericidal activity compared to B6.
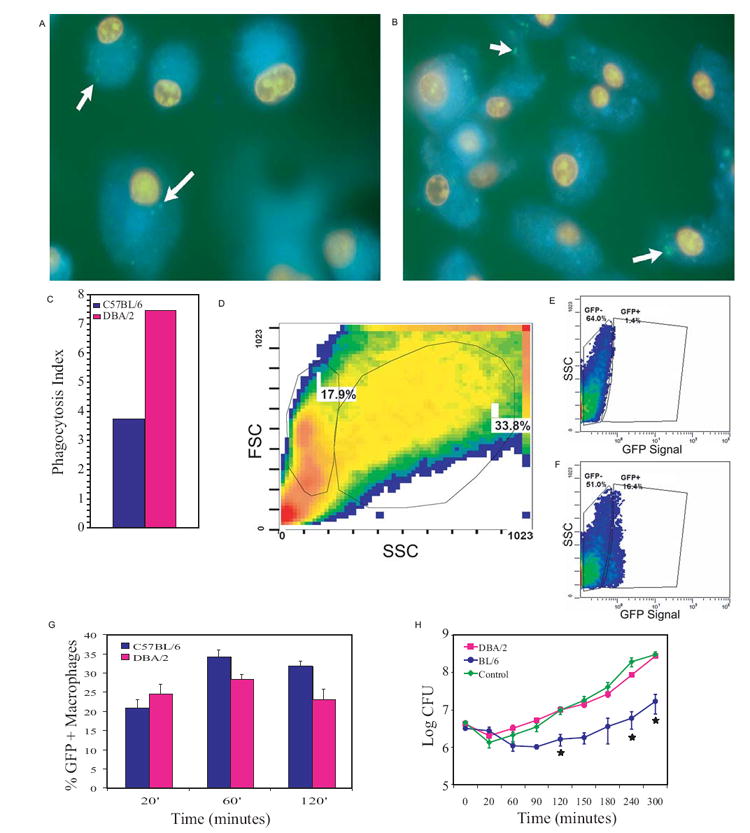
Epifluorescent images of naïve macrophages produced from bone marrow progenitor cells harvested from (A) B6 and (B) D2 mice after a 20 minute exposure to P. aeruginosa pMRP-1. The nuclei are stained red with ethidium bromide, while the endoplasmic reticulum is stained blue with ER-Tracker™ Blue-White DPX and the bacteria appear green due to GFP expression (white arrows). (C) After a 20 minute exposure there was a qualitative difference between D2 and B6 macrophage phagocytosis. This difference was quantified by determination of the phagocytotic index (percent macrophages with bacteria × average number of bacteria per macrophage containing bacteria) by microscopic examination. The experimental data was statistically different on two replicates (p<0.05, Kolmogorov-Smirnov) with the values shown being a representative trial (n=50). (D-F) Naïve macrophages were first separated from monocyte precursors and multiple cell aggregates by forward-scatter (FSC) and side-scatter (SSC) characteristics (monocytes have lower SSC values) and analyzed for GFP levels. (D) FSC and SSC of cultured naïve macrophages are shown with the population on the right being the subject of analysis. (E) Unexposed macrophages were used as a negative control in gating. (F) GFP+ macrophages exposed to GFP expressing P. aeruginosa. (G) Percent macrophages that are GFP+ are shown after 20, 60, and 120 minutes of exposure to bacteria. Comparisons between strains at each time point were significantly different (p<0.05, Overton analysis, Student’s t test, Holm’s method). Data shown represent the mean ± SD (n=6). (H) Data from bacterial killing assays plotted on a logarithmic scale indicates B6 macrophages are able to control P. aeruginosa growth significantly better (* = p<0.05, ANOVA, Student’s t test, Holm’s method) than D2 macrophages for up to five hours of exposure. The control represents medium inoculated with bacteria in the absence of macrophages. Data plotted is the mean of three experiments.
Figure 6. Time course production of inflammatory markers in D2 lungs in comparison with B6 and C3.
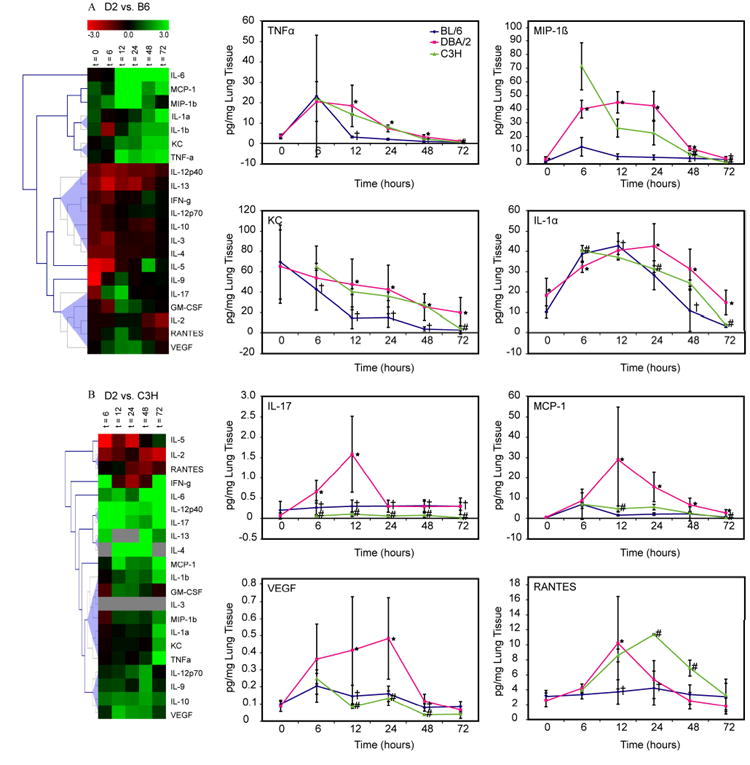
(A). Hierarchical clusters of cytokine levels monitored over a period of 72 h in the exposed mouse lungs. The cluster analysis was based on two separate P. aeruginosa PAO1 aerosol exposures with each square depicting means from 8 lung samples. Shown are the D2 vs. B6 log ratios of 21 chemokine and cytokine levels from the mouse lungs. (B). Cluster analysis for C3 was based on one P. aeruginosa PAO1 aerosol exposures with each square depicting means from 2 lung samples. Shown are the D2 (see 6A) vs. C3 log ratios of 21 chemokine and cytokine levels from the mouse lungs. Colors correspond to the differential protein levels for each target. D2 and B6 mice were infected at the same time with the exposure P. aeruginosa PAO1 as in Fig. 1B and the lung homogenates were used for assaying the chemokines and cytokines. Beadlyte mouse 21-plex monoclonal antibody based detection system was used for measuring cytokines in the mouse lungs as described in Materials and Methods. The cytokine levels were normalized according to the weight of lung tissues.
Results
D2 lungs are deficient in the initial defense against P. aeruginosa colonization
Using an aerosol infection mouse model (Yu et al., 1998a; Yu & Head, 2002), we compared eleven inbred mouse strains, 129/Sv, A/J, BALB/c, C3H/HeN, C57BL/6, DBA/2, FVB, B10.D2/oSnJ, B10.D2/nSnJ, AKR/J and SWR/J for their susceptibility status to lung colonization by P. aeruginosa PAO1. Six hours after the exposure, viable counts from the right lungs were determined (Fig. 1A). Increased P. aeruginosa PAO1 loads were noted in D2 mice in comparison to the other inbred strains and to the initial deposition. The percent of viable bacterial counts in the lungs was calculated using the ratio of CFUs 6 h post infection to the mean of initial input of bacteria. At 6 h, the median of P. aeruginosa PAO1 recovered from B6 lungs was 6.1% of the initial input (ranges: 2.6-31%, n = 39) while that from D2 lungs was 287% (ranges: 61-1,146%, n = 26) (p<0.001). Male and female D2 mice showed equivalent levels of bacterial counts. These results suggest that in our aerosol model, among the strains of mice studied, D2 mice are uniquely susceptible to infection as has been shown previously in other models (Cerquetti et al., 1986; Larsen et al., 1982; Morissette et al., 1995).
A similar pattern of increased bacterial retention in D2 lungs was seen 6 h post infection with two clinical isolates, P. aeruginosa CF149 and 311058 (Head & Yu, 2004) compared to the resistant B6 and C3 mice (Fig. 1A). The genome sizes of these two clinical strains are known to be significantly larger than that of PAO1 (Head & Yu, 2004). At 6 h post infection with CF149, the number of CFUs in B6 and D2 lungs was 3% (n = 10) and 250% (n = 11) of the initial input (p<0.001), respectively. Similarly, 6 h post infection with 311058, the number of CFUs in B6 and D2 lungs was 8% (n = 11) and 171% (n = 5) of the initial input (p=0.02), respectively. Furthermore, D2 lungs were more sensitive to colonization with these two clinical isolates than C3 (p<0.001). While the resistant mice, including B6 and C3, showed a decrease in colonization compared to the initial delivery dose, D2 lungs displayed an increase of CFUs within the first 6 h after respiratory colonization, indicating that D2 lungs are deficient in removing the initial colonizing clinical isolates of P. aeruginosa.
Next, we compared the kinetic lung clearance of P. aeruginosa PAO1 in B6, C3 and D2 mice. After exposure, viable counts were measured over a period of 72 h (Fig. 1B). Overall, all three mouse strains displayed a reduction in bacterial counts throughout the 72 h. However, bacterial loads in D2 lungs remained significantly higher than the levels in B6 or C3 lungs at each time point (p<0.001). To ensure that the bacterial droplets inhaled by mice were distributed evenly among the entire lung, we compared viable counts and lung histopathology between the left and right lungs over a period of 24 h after infection with P. aeruginosa PAO1. No difference was seen in CFUs between left and right lungs, and histopathology was also similar (data not shown), indicating this aerosol procedure can be used to simulate whole lung infections. Taken together, this data indicates that D2 mice are unable to resolve P. aeruginosa lung colonizations as well as other inbred mouse strains.
Lung infection with P. aeruginosa PAO1 causes high and rapid mortality in D2 mice
While testing the kinetic lung clearance of P. aeruginosa PAO1, we noted that a few D2 mice succumbed to infection after 24 h, while none of the B6 or C3 mice died. To examine the mortality more fully, the mortality of D2 mice relative to other mice was then monitored over a period of 144 h. A mortality of 96.7% was noted in D2 (number dead/number tested = 58/60) and 5.6% in B6 (2/36). The mean survival times for D2 females and males were 36.5 ± 2.2 (mean ± SE) and 53.7 ± 3.7 h, respectively (p<0.0001) (data not shown). While the mean survival times for the other inbred strains of mice were greater than 138 h without differences among them (p=0.858).
P. aeruginosa PAO1 causes extensive lung inflammation and injury in D2 mice
To examine pathological changes in the mouse lungs, the left lobes were processed for histology at each time point (Fig. 2). Perivascular and peribronchiolar infiltrates were noted in all lung sections of three mouse strains. At 24 h, D2 mice showed more diffuse and patchy accumulations of inflammatory cells within the alveolar space than B6. At 48 h, while the infiltrates appear to subside in B6 mice, they remain abundantly present within the alveoli of D2 mice coupled with edema. At 72 h, improved lung histology was seen in B6 and C3 while D2 lungs were still heavily inflamed. An exudate was noted in the alveoli of D2 at 24 h, which increased over time along with infiltrations of inflammatory cells. At 72 h, the alveolar septae in D2 mice were disrupted. This and the extensive exudate formation caused a significant reduction in alveoli space. Along with interstitial and alveolar edema formation, this response is similar to what is seen with acute inflammatory lung injury. While the exudate was also detected in the early sections of B6 mice (up to 24 h post infection), it disappeared after 48 h. Overall, the lung histopathology shows that D2 mice have a more robust, but detrimental, response to P. aeruginosa PAO1 compared to B6 and C3 mice. This response is coupled with a greater influx of inflammatory cells, extensive production of exudate, and tissue damage.
Figure 2. Progressive, increased lung inflammation and injury in D2 mice.

B6, C3, and D2 mice were exposed at the same time to P. aeruginosa PAO1 aerosols as in Fig. 1B, and lung tissues were harvested at time = 0, 6, 12, 24, 48 and 72 h. Processing of mouse lungs for histology and light microscopy of H&E-stained infected lung sections were carried out as described in Materials and Methods. Magnification is 40× or 600× as indicated. Sections are representative of five mice studied at each time point per group.
To see whether bacteremia was playing a role in death of D2 mice, we measured the viable bacterial counts in blood and spleens of D2 and B6 mice. Viable bacteria were detected within 24 h after exposure, but there was no difference in the blood and spleen samples between the mouse strains (data not shown). No bacteria were isolated from the blood or spleen in either mouse strain at 48 or 72 h (data not shown). While there was a transient systematic presence of bacteria in B6 and D2 mice, the death of D2 mice appears to be primarily due to the complication in the lungs, indicating that the D2, compared to the other strains of mice tested, are unable to overcome the increased and prolonged inflammatory response.
Since neutrophils are directly involved in killing invading bacteria and histopathology indicates that there is recruitment of inflammatory cells, we examined the activity of neutrophils in lung tissues by measuring MPO levels in B6, C3 and D2 mice after exposure to P. aeruginosa PAO1 (Fig. 3). MPO is abundantly present in neutrophils, and is an accepted marker for neutrophil infiltration (Haddad el et al., 2002). At 6 h post exposure, there was no significant difference in MPO activity among three strains of mice. From 6 to 12 h, MPO activity continued to rise in C3 and D2 mice, while activity in B6 started to decrease. From 12 to 48 h, MPO activity declined in all three mouse strains, but MPO activity of C3 or D2 was significantly higher at each time point than that of B6 (p=0.01). At 72 h MPO activity in B6 and C3 mice returned to the same level as uninfected or saline-exposed controls (data not shown), but it remained elevated in D2 (p=0.01). These results indicate that D2 mice have increased neutrophil activity after exposure to PAO1 throughout the infection.
Other host factors besides complement 5 are involved in the increased susceptibility to lung infection
Due to a mutation, D2 mice are deficient in the production of complement 5 (C5). The split product C5a acts as an anaphylatoxin to recruit neutrophils to sites of infection. Several papers have cited this defect as a cause for D2 susceptibility to P. aeruginosa (Cerquetti et al., 1986; Larsen et al., 1982; Morissette et al., 1995). To determine if the C5 deficiency is responsible for D2 mice susceptibility in our aerosol model, several C5 deficient strains were compared. A varied response of susceptibly was found when these C5 deficient strains were exposed to aerosolized P. aeruginosa PAO1 (Fig. 4). While B6, C3 and B10.D2/nSnJ are C5 sufficient, D2, SWR/J, AKR/J, A/J and B10.D2oSnJ are C5 deficient and display varying degrees of susceptibility to aerosolized PAO1. D2 mice are the most susceptible (3% survival), followed by B10.D2/oSnJ and AKR/J with 42% and 76% survival, respectively, while both SWR/J and A/J had 100% survival. Even though these mouse strains are C5 deficient, several displayed resistance to infection with regards to survival. This indicates that there are additional deficiencies in D2 mice that cause them to have a phenotype of high susceptibility.
D2 macrophages have reduced ability to eliminate P. aeruginosa
In addition to neutrophils, macrophages are a major immune cell involved in innate immunity. Studies have shown that there are four distinct types of monocyte lineages in the lung that have different biological functions (Lohmann-Matthes et al., 1994; Sibille & Reynolds, 1990). In addition, macrophages display complex activation characteristics and heterogeneity due to micro-environmental influences (Gordon, 2003; Hume et al., 2002; Rauh et al., 2005). These influences can have large effects on the morphology of macrophages (Porcheray et al., 2005). In order to determine if there is an autonomous difference between D2 and B6 macrophages, rather than a difference as a result of the differentiation of the macrophages in the respective in vivo environments, naïve macrophages were produced by expansion of myeloid progenitors isolated from bone marrow.
Examination of live cultured macrophages exposed for 20 minutes to P. aeruginosa pMRP-1 revealed that D2 macrophages have increased initial phagocytosis ability, p<0.05 (Fig. 5A-C). The phagocytosis index of D2 macrophages was two-fold higher than that of B6 (based on two independent trials). To verify these results and monitor phagocytosis over an extended time, flow cytometry was conducted to analyze the phagocytosis of P. aeruginosa pMRP-1 by macrophages. D2 and B6 naïve macrophages were found to be significantly different (p<0.05) in percent of macrophages that were GFP+ at 20, 60, and 120 minutes of exposure (Fig. 5G). Results at 20 minutes were consistent with microscopy data, in that D2 macrophages had a higher level of phagocytosis. However, the difference (5%) was more subtle than the two-fold difference seen with microscopy (Fig. 5C), most likely due to the sensitivity of flow cytometry compared to microscopy in these assays. After 60 minutes of exposure, B6 macrophages had a significant increase (p<0.05) in phagocytosis compared to D2 macrophages. This increase was maintained up to 120 minutes of exposure. Therefore, while the initial phagocytosis of bacteria by the susceptible D2 strain may be superior, B6 macrophages are able to respond over time with even higher phagocytosis activity. Conversely, D2 macrophage phagocytosis remains constant, without an increase in response, for up to 2 h of exposure.
To determine if the difference in phagocytosis is relevant to the ability of these macrophages to control bacterial growth, an ex vivo P. aeruginosa killing assay was performed (Fig. 5H). In this assay the number of surviving bacteria was significantly lower (p<0.05) when exposed to B6 macrophages in comparison to D2 macrophages after four and five hours of exposure. There is no significant difference between bacterial proliferation in the control (no macrophages) versus D2 macrophages at any time point. However, after two hours the B6 macrophages displayed significantly reduced bacterial proliferation from the control as well as D2 macrophages. Variation increased in the data when the bacterial population entered the logarithmic growth phase (time = 150 and 180 minutes) such that after correction for multiple comparisons differences were no longer significant. However, all time points after 180 minutes showed significant differences between D2 and B6 macrophages. Thus, D2 macrophages are not able to control P. aeruginosa PAO1 proliferation as well as B6 macrophages. This timeframe is consistent with the 6 h time point identified in our exposure assay that shows a difference between these two strains. Since PA14 is known to be more virulent than PAO1 with the presence of pathogenicity islands containing various types of novel virulence factors (Lee et al., 2006), we tested whether D2 macrophages are also deficient in killing PA14. Similar to what was seen with PAO1 (Fig. 5H), D2 macrophages were less efficient in containing the growth of PA14 than B6 (data not shown). This indicates that D2 macrophages lack the necessary elements to control Pseudomonas bacterial growth after internalization, and both P. aeruginosa PAO1 and PA14 have common genetic elements which allow them to survive intracellularly.
Elevation of proinflammatory and immunoregulatory markers in D2 lungs
Cytokines and chemokines are important mediators and signaling molecules in the innate immune system. After exposure to P. aeruginosa PAO1, we measured the levels of pulmonary cytokines from B6, C3 and D2 mice. Figs. 6A and 6B show two comparisons of 21 cytokines from aerosol exposures over a 72 h time frame. The cluster tree indicates cytokines that have similar expression profiles based on the log ratio of D2 vs. B6 or D2 vs. C3. Overall, comparison between D2 and B6 revealed D2 had higher levels of inflammatory cytokines including: TNF-α, MIP-1β, KC, IL-1α, and MCP-1. IL-17 and RANTES spiked at 12 h and VEGF (vascular endothelial growth factor) had a higher level from 12 to 24 h in D2 mice. Comparison between D2 and C3 indicates that the levels of TNF-α, MIP-1β, KC, and IL-1α were similarly elevated up to 48h post infection. However, these cytokines in C3 mice returned to the uninfected level at 72 h. D2 mice had increased levels of MCP-1 and VEGF at 12h and 12-48h, respectively. IL-17 was elevated in D2 mice throughout the infection. Based on these pro-inflammatory cytokine profiles, D2 mice have a persistent, increased inflammatory response to lung colonization with P. aeruginosa PAO1 compared to B6 mice and unlike C3 mice, the lung inflammation in D2 mice was unable to be completely resolved.
Discussion
The overall finding of this study is that D2 mice are not effective in mounting a robust lung clearance against P. aeruginosa. Attempt to correct this deficiency results in a larger influx of inflammatory cells to the lung tissues. While an increase in the number of recruited neutrophils helped to reduce bacterial loads, an excessive inflammatory response results, as was verified by lung pathology, MPO activity and the elevated production of pro-inflammatory chemokines and cytokines. The acute inflammatory lung injury was the chief cause of the rapid mortality achieving a rate of 96.7% in D2 mice. Naïve D2 macrophages showed an initial increase in bacterial phagocytosis, but were unable to restrict P. aeruginosa growth as compared to those of the resistant B6 mice. This inability to rapidly clear the respiratory colonization with P. aeruginosa may stem from the reduced antimicrobial activity of macrophages in D2 mice. This loss of antimicrobial activity is also accompanied by the failure of D2 macrophages to elevate phagocytic activity relative to resistant B6 macrophages. These results suggest that there are multiple deficiencies in D2 mice that affect the innate resistance to lung infection.
Innate immunity against respiratory colonization with P. aeruginosa is a dynamic process which requires participation of many host factors. B6, C3 and D2 mice showed a clear difference in the initial colonization in the lungs which is neutrophil-independent. Although, at the 12 h time point correlation of increased MPO activities with a decrease in bacterial counts suggests that neutrophils help eliminate P. aeruginosa from the D2 lungs (Figs. 1B and 3). This early counter-colonization defense in D2 mice is not sufficient to withstand the bacterial insults, which leads to an intense inflammatory response in the host. While the lung inflammation resolved in resistant B6 mice, increased inflammation was seen with a slower decline in MPO activity and increased lung pathology in D2 (Figs. 2 and 3). The enhanced MPO activity in D2 and C3 mice suggest that the role of neutrophils is important in the lung defense against P. aeruginosa. It has been shown that neutropenic mice are highly susceptible to P. aeruginosa lung infection (Priebe et al., 2003). However, the complete lack of early bactericidal activity before the peak of MPO activity (Figs. 1B and 3) suggests that the resident defense factors such as macrophages in the lungs are also important in the defense. Additionally, D2 macrophages are deficient in their ability to control bacterial growth and D2 mice produce an enhanced pro-inflammatory cytokine profile compared to B6 (Figs. 5H and 6). This supports the notion that a defect in macrophages and/or de-regulation of chemokine and cytokine networks in D2 mice may affect the effective removal of the invading bacteria. The resulting intense neutrophilic inflammation caused damage to the alveolar septa with the production edema fluid during the later stage of infection (Fig. 2). The extensive exudate formation within alveoli could further exacerbate the activity of neutrophils and macrophages (Keicho & Kudoh, 2002; Tsuda et al., 2004). The significant pathology characterized with excessive and directed neutrophil infiltrations as well as interstitial and alveolar edema indicates that this acute lung infection model with D2 mice displays the symptoms similar to acute lung injury (ALI), a major debilitating illness that has high incidence in hospital settings (Rubenfeld et al., 2005).
Increased susceptibility to lung infection in D2 mice has been previously seen with intratracheal instillation of P. aeruginosa embedded in agar beads (Morissette et al., 1995; Morissette et al., 1996). This defect was also seen with other bacterial species, Staphylococcus aureus (Cerquetti et al., 1983; Wilson & Yu), Klebsiella pneumonia (Wilson & Yu), and Streptococcus pneumonia (Wilson & Yu). The early lung defense defect with D2 mice seems not to be bacteria-specific while the underlying mechanisms remain unknown. A previous report showed that lung macrophages displayed similar in vitro phagocytic and bactericidal activities between BALB/c and D2 mice (Morissette et al., 1996). Lung macrophages are known to be heterogenous. Each population of lung macrophages has distinct patterns of gene expression and function (Laskin et al., 2001). Because of the macrophage heterogenicity, the role of alveolar macrophages in defense against P. aeruginosa is still unclear. The depletion of alveolar macrophages has been shown to cause a decrease in cytokine production (Fujimoto et al., 2002), while alveolar macrophages have been shown to have only a marginal role in the defense of lung against P. aeruginosa (Cheung et al., 2000). Part of the reason that no early difference was seen in these previous reports could be due to the macrophage heterogeneity in the lungs. However, our system accounts for possible micro-environmental influences by eliminating them as a variable, instead concentrating on cell autonomous factors. In the current study naïve D2 macrophages are initially more phagocytic than B6 macrophages; however, they are defective in clearing or controlling bacterial colonization as effectively as the B6 macrophages. This finding suggests that the initial bacterial killing defect between the resistant and susceptible mice could be attributed to subsets of lung macrophages, some of which may have reduced antibacterial activity. The increased phagocytosis could be due to increased expression of P. aeruginosa receptors on D2 naive macrophage. Alternatively, this could be caused by attenuated activation of macrophages with the reduced production of INF-γ and/or the decreased production of reactive oxygen species (Daniel et al., 2006). Increased phagocytosis in macrophages could also evoke signals in the forms of increased cytokine and chemokine production to set off a cascade of increased inflammatory host responses.
D2 mice are one of several C5 deficient inbred mouse strains (Cinader et al., 1966; Wetsel et al., 1990). The absence of C5a would predict a reduction in neutrophil recruitment to the lung tissues. However, a larger-than-normal influx of inflammatory leukocytes to D2 lungs suggests that the loss of C5a may be compensated for by the host through increasing the production of TNF-α and KC as redundant/alternative neutrophil chemotactic factors. Increased infiltrations of leukocytes in D2 mice are consistent with persistently high levels of IL-1, TNF-α, MIP-1β, MCP-1, RANTES, and KC (Fig. 6). KC is the functional equivalent of IL-8, which has the strong activity for neutrophil recruitment and activation. IL-1, TNF-α, and LPS are all known inducers of this chemokine. MCP-1, RANTES, and MIP-1β also possess specific chemotactic activity for neutrophils and monocytes. These results are congruent with severe lung pathology seen during the later stages of infections in D2 mice. The classical method to induce ALI in mouse is the intratracheal injection of IgG immune complex. Recently it has been demonstrated that the immune complex alone can not effectively induce ALI in C5 deficient mice (Huber-Lang et al., 2006). However, in the current study, the use of live P. aeruginosa caused a massive influx of neutrophils in D2 lungs causing an inflammatory damage to alveoli. Therefore, it is possible that ALI could be caused by different inducing agents such as immune complex and/or bacteria. In the presence of C5, the immune complex plays a key role in the formation of ALI. In the absence of C5, as in the case of our present study, P. aeruginosa may activate an alternative host defensive mechanism leading to ALI. In particular, two cytokines, MIP-1β and IL-17 (Fig. 6) had a marked increase after exposure to P. aeruginosa. MIP-1β has been linked with development of acute lung injury in rats (Bless et al., 2000) while IL-17 has recently been implicated as a major biomarker for a distinct lineage of CD4 T cells that up-regulates tissue inflammation (Park et al., 2005). Furthermore, IL-23 and IL-17 have been shown to be critical for maintaining the normal graunlopoiesis in the tissues (Stark et al., 2005). The divergence in the production of these biomarkers could be linked with deregulation of neutrophils trafficking into tissues.
In summary, we have demonstrated that D2 mice are hyper-susceptible to lung colonizations by P. aeruginosa leading to rapid development of fatal pneumonia. The inability to mount an effective early lung defense correlates with the lack of initial bactericidal activity in D2 macrophages, indicating that lung macrophages are an important factor in the first line of defense against the initial colonization. Additionally, in response to P. aeruginosa lung infections, D2 mice are capable of recruiting an increased number of neutrophils to the lungs, but fail to resolve the neutrophilic inflammation. These combining factors lead to an increased susceptibility as seen with increased lung colonization, neutrophil recruitment and mortality in D2 mice. The infection model presented here shows similarity to what is seen with bacterial pneumonia and acute inflammatory lung injury in humans. This model could possibly be used to study host genetic factors that predispose certain individuals to acute lung injury or lung colonization.
Acknowledgments
K.R.W. was a pre-doctoral studentship recipient from the Cystic Fibrosis Foundation (CFF) (SKOLNI03H0). We thank Jon Alley for his help with the mouse exposures. This work was supported by a grant YU04I0 from CFF and by a Public Health Service grant DK58128 from the National Institutes of Health.
References
- 1.Bless NM, Huber-Lang M, Guo RF et al. Role of CC chemokines (macrophage inflammatory protein-1 beta, monocyte chemoattractant protein-1, RANTES) in acute lung injury in rats. J Immunol. 2000;164:2650–2659. doi: 10.4049/jimmunol.164.5.2650. [DOI] [PubMed] [Google Scholar]
- 2.Bradley PP, Priebat DA, Christensen RD, Rothstein G. Measurement of cutaneous inflammation: estimation of neutrophil content with an enzyme marker. J Invest Dermatol. 1982;78:206–209. doi: 10.1111/1523-1747.ep12506462. [DOI] [PubMed] [Google Scholar]
- 3.Campbell PA, Canono BP, Drevets DA. Measurement of Bacterial Ingestion and Killing by Macrophages. In: Coligan JE, Bierer B, Kruisbeek AM, Margulies DH, Shevach EM, Strober W, editors. Current Protocols in Immunology. USA: John Wiley & Sons, Inc; 2005. pp. 14.16.11–14.16.13. [Google Scholar]
- 4.Cerquetti MC, Sordelli DO, Ortegon RA, Bellanti JA. Impaired lung defenses against Staphylococcus aureus in mice with hereditary deficiency of the fifth component of complement. Infect Immun. 1983;41:1071–1076. doi: 10.1128/iai.41.3.1071-1076.1983. [DOI] [PMC free article] [PubMed] [Google Scholar]
- 5.Cerquetti MC, Sordelli DO, Bellanti JA, Hooke AM. Lung defenses against Pseudomonas aeruginosa in C5-deficient mice with different genetic backgrounds. Infect Immun. 1986;52:853–857. doi: 10.1128/iai.52.3.853-857.1986. [DOI] [PMC free article] [PubMed] [Google Scholar]
- 6.Cheung DO, Halsey K, Speert DP. Role of pulmonary alveolar macrophages in defense of the lung against Pseudomonas aeruginosa. Infect Immun. 2000;68:4585–4592. doi: 10.1128/iai.68.8.4585-4592.2000. [DOI] [PMC free article] [PubMed] [Google Scholar]
- 7.Cinader B, Dubiski S, Wardlaw AC. Genetics of MuB1 and of a complement defect in inbred strains of mice. Genet Res. 1966;7:32–43. doi: 10.1017/s0016672300009459. [DOI] [PubMed] [Google Scholar]
- 8.Daniel DS, Dai G, Singh CR, Lindsey DR, Smith AK, Dhandayuthapani S, Hunter RL, Jr, Jagannath C. The reduced bactericidal function of complement C5-deficient murine macrophages is associated with defects in the synthesis and delivery of reactive oxygen radicals to mycobacterial phagosomes. J Immunol. 2006;177:4688–4698. doi: 10.4049/jimmunol.177.7.4688. [DOI] [PubMed] [Google Scholar]
- 9.Davies DG, Parsek MR, Pearson JP, Iglewski BH, Costerton JW, Greenberg EP. The involvement of cell-to-cell signals in the development of a bacterial biofilm. Science. 1998;280:295–298. doi: 10.1126/science.280.5361.295. [DOI] [PubMed] [Google Scholar]
- 10.Davies JQ, Gordon S. Isolation and culture of murine macrophages. In: Helgason CD, Miller CL, editors. Basic Cell Culture Protocols. Totowa NJ: Humana Press; 2005. pp. 91–104. [DOI] [PubMed] [Google Scholar]
- 11.DeFrances CJ, Hall MJ, Podgornik MN. 2003 National Hospital Discharge Survey. Advance Data-CDC. 2005;359:1–20. [PubMed] [Google Scholar]
- 12.Fortier AH, Falk LA. Isolation of Murine Macrophages. In: Coligan JE, Bierer B, Kruisbeek AM, Margulies DH, Shevach EM, Strober W, editors. Current Protocols in Immunology. USA: John Wiley & Sons, Inc; 2005. pp. 14.11.11–14.11.19. [DOI] [PubMed] [Google Scholar]
- 13.Fujimoto J, Wiener-Kronish JP, Hashimoto S, Sawa T. Effects of Cl2MDP-encapsulating liposomes in a murine model of Pseudomonas aeruginosa-induced sepsis. Journal of liposome research. 2002;12:239–257. doi: 10.1081/lpr-120014760. [DOI] [PubMed] [Google Scholar]
- 14.Gordon S. Alternative activation of macrophages. Nat Rev Immunol. 2003;3:23–35. doi: 10.1038/nri978. [DOI] [PubMed] [Google Scholar]
- 15.Haddad el B, McCluskie K, Birrell MA, et al. Differential effects of ebselen on neutrophil recruitment, chemokine, and inflammatory mediator expression in a rat model of lipopolysaccharide-induced pulmonary inflammation. J Immunol. 2002;169:974–982. doi: 10.4049/jimmunol.169.2.974. [DOI] [PubMed] [Google Scholar]
- 16.Head NE, Yu H. Cross-Sectional Analysis of Clinical and Environmental Isolates of Pseudomonas aeruginosa: Biofilm Formation, Virulence, and Genome Diversity. Infect Immun. 2004;72:133–144. doi: 10.1128/IAI.72.1.133-144.2004. [DOI] [PMC free article] [PubMed] [Google Scholar]
- 17.Huber-Lang M, Sarma JV, Zetoune FS, et al. Generation of C5a in the absence of C3: a new complement activation pathway. Nat Med. 2006;12:682–687. doi: 10.1038/nm1419. [DOI] [PubMed] [Google Scholar]
- 18.Hume DA, Ross IL, Himes SR, Sasmono RT, Wells CA, Ravasi T. The mononuclear phagocyte system revisited. J Leukoc Biol. 2002;72:621–627. [PubMed] [Google Scholar]
- 19.Keicho N, Kudoh S. Diffuse panbronchiolitis: role of macrolides in therapy. Am J Respir Med. 2002;1:119–131. doi: 10.1007/BF03256601. [DOI] [PubMed] [Google Scholar]
- 20.Larsen GL, Mitchell BC, Harper TB, Henson PM. The pulmonary response of C5 sufficient and deficient mice to Pseudomonas aeruginosa. Am Rev Respir Dis. 1982;126:306–311. doi: 10.1164/arrd.1982.126.2.306. [DOI] [PubMed] [Google Scholar]
- 21.Laskin DL, Weinberger B, Laskin JD. Functional heterogeneity in liver and lung macrophages. J Leukoc Biol. 2001;70:163–170. [PubMed] [Google Scholar]
- 22.Lee DG, Urbach JM, Wu G et al. Genomic analysis reveals that Pseudomonas aeruginosa virulence is combinatorial. Genome Biol. 2006;7:R90. doi: 10.1186/gb-2006-7-10-r90. [DOI] [PMC free article] [PubMed] [Google Scholar]
- 23.Lee SC, Hua CC, Yu TJ, Shieh WB, See LC. Risk factors of mortality for nosocomial pneumonia: importance of initial anti-microbial therapy. Int J Clin Pract. 2005;59:39–45. doi: 10.1111/j.1742-1241.2005.00281.x. [DOI] [PubMed] [Google Scholar]
- 24.Lohmann-Matthes ML, Steinmuller C, Franke-Ullmann G. Pulmonary macrophages. Eur Respir J. 1994;7:1678–1689. [PubMed] [Google Scholar]
- 25.Morissette C, Skamene E, Gervais F. Endobronchial inflammation following Pseudomonas aeruginosa infection in resistant and susceptible strains of mice. Infect Immun. 1995;63:1718–1724. doi: 10.1128/iai.63.5.1718-1724.1995. [DOI] [PMC free article] [PubMed] [Google Scholar]
- 26.Morissette C, Francoeur C, Darmond-Zwaig C, Gervais F. Lung phagocyte bactericidal function in strains of mice resistant and susceptible to Pseudomonas aeruginosa. Infect Immun. 1996;64:4984–4992. doi: 10.1128/iai.64.12.4984-4992.1996. [DOI] [PMC free article] [PubMed] [Google Scholar]
- 27.Orme IM, Collins FM. Mouse model of tuberculosis. In: Bloom BR, editor. Tuberculosis: pathogenesis, protection and control. Washington, DC: ASM Press; 1994. pp. 113–134. [Google Scholar]
- 28.Park H, Li Z, Yang XO et al. A distinct lineage of CD4 T cells regulates tissue inflammation by producing interleukin 17. Nat Immunol. 2005;6:1133–1141. doi: 10.1038/ni1261. [DOI] [PMC free article] [PubMed] [Google Scholar]
- 29.Porcheray F, Viaud S, Rimaniol AC, Leone C, Samah B, Dereuddre-Bosquet N, Dormont D, Gras G. Macrophage activation switching: an asset for the resolution of inflammation. Clin Exp Immunol. 2005;142:481–489. doi: 10.1111/j.1365-2249.2005.02934.x. [DOI] [PMC free article] [PubMed] [Google Scholar]
- 30.Priebe GP, Meluleni GJ, Coleman FT, Goldberg JB, Pier GB. Protection against fatal Pseudomonas aeruginosa pneumonia in mice after nasal immunization with a live, attenuated aroA deletion mutant. Infect Immun. 2003;71:1453–1461. doi: 10.1128/IAI.71.3.1453-1461.2003. [DOI] [PMC free article] [PubMed] [Google Scholar]
- 31.Ramphal R. Pathogenesis of airway colonization. In: Niederman MS, Sarosi GA, Glassroth J, editors. Respiratory Infections. Philadelphia: Lippincott Williams & Wilkins; 2001. pp. 45–58. [Google Scholar]
- 32.Rauh MJ, Ho V, Pereira C et al. SHIP represses the generation of alternatively activated macrophages. Immunity. 2005;23:361–374. doi: 10.1016/j.immuni.2005.09.003. [DOI] [PubMed] [Google Scholar]
- 33.Rubenfeld GD, Caldwell E, Peabody E, Weaver J, Martin DP, Neff M, Stern EJ, Hudson LD. Incidence and outcomes of acute lung injury. N Engl J Med. 2005;353:1685–1693. doi: 10.1056/NEJMoa050333. [DOI] [PubMed] [Google Scholar]
- 34.Sibille Y, Reynolds HY. Macrophages and polymorphonuclear neutrophils in lung defense and injury. Am Rev Respir Dis. 1990;141:471–501. doi: 10.1164/ajrccm/141.2.471. [DOI] [PubMed] [Google Scholar]
- 35.Stark MA, Huo Y, Burcin TL, Morris MA, Olson TS, Ley K. Phagocytosis of apoptotic neutrophils regulates granulopoiesis via IL-23 and IL-17. Immunity. 2005;22:285–294. doi: 10.1016/j.immuni.2005.01.011. [DOI] [PubMed] [Google Scholar]
- 36.Stover CK, Pham XQ, Erwin AL et al. Complete genome sequence of Pseudomonas aeruginosa PA 01, an opportunistic pathogen. Nature. 2000;406:959–964. doi: 10.1038/35023079. [DOI] [PubMed] [Google Scholar]
- 37.Tsuda Y, Takahashi H, Kobayashi M, Hanafusa T, Herndon DN, Suzuki F. Three different neutrophil subsets exhibited in mice with different susceptibilities to infection by methicillin-resistant Staphylococcus aureus. Immunity. 2004;21:215–226. doi: 10.1016/j.immuni.2004.07.006. [DOI] [PubMed] [Google Scholar]
- 38.Wetsel RA, Fleischer DT, Haviland DL. Deficiency of the murine fifth complement component (C5). A 2-base pair gene deletion in a 5’-exon. J Biol Chem. 1990;265:2435–2440. [PubMed] [Google Scholar]
- 39.Wilson KR, Yu HD. Unpublished results. [Google Scholar]
- 40.Yu H, Hanes M, Chrisp CE, Boucher JC, Deretic V. Microbial pathogenesis in cystic fibrosis: pulmonary clearance of mucoid Pseudomonas aeruginosa and inflammation in a mouse model of repeated respiratory challenge. Infect Immun. 1998a;66:280–288. doi: 10.1128/iai.66.1.280-288.1998. [DOI] [PMC free article] [PubMed] [Google Scholar]
- 41.Yu H, Hanes M, Chrisp CE, Boucher JC, Deretic V. Microbial pathogenesis in cystic fibrosis: pulmonary clearance of mucoid Pseudomonas aeruginosa and inflammation in a mouse model of repeated respiratory challenge. Infect Immun. 1998b;66:280–288. doi: 10.1128/iai.66.1.280-288.1998. [DOI] [PMC free article] [PubMed] [Google Scholar]
- 42.Yu H, Nasr SZ, Deretic V. Innate lung defenses and compromised Pseudomonas aeruginosa clearance in the malnourished mouse model of respiratory infections in cystic fibrosis. Infect Immun. 2000;68:2142–2147. doi: 10.1128/iai.68.4.2142-2147.2000. [DOI] [PMC free article] [PubMed] [Google Scholar]
- 43.Yu H, Head NE. Persistent infections and immunity in cystic fibrosis. Front Biosci. 2002;7:D442–457. doi: 10.2741/a787. [DOI] [PubMed] [Google Scholar]