

Abstract
Batch culture experiments with the cyanobacterium Microcystis aeruginosa PCC 7806 were performed in order to test the hypothesis that microcystins (MCYSTs) are produced in response to a relative deficiency of intracellular inorganic carbon (Ci,i). In the first experiment, MCYST production was studied under increased Ci,i deficiency conditions, achieved by restricting sodium-dependent bicarbonate uptake through replacement of sodium bicarbonate in the medium with its potassium analog. The same experimental approach was used in a second experiment to compare the response of the wild-type strain M. aeruginosa PCC 7806 with its mcyB mutant, which lacks the ability to produce MCYSTs. In a third experiment, the impact of varying the Ci,i status on MCYST production was examined without suppressing the sodium-dependent bicarbonate transporter; instead, a detailed investigation of a dark-light cycle was performed. In all experiments, a relative Ci,i deficiency was indicated by an elevated variable fluorescence signal and led to enhanced phycocyanin cell quotas. Higher MCYST cell quotas (in the first and third experiments) and increased total (intracellular plus extracellular) MCYST production (in the first experiment) were detected with increased Ci,i deficiency. Furthermore, the MCYST-producing wild-type strain and its mcyB mutant showed basically the same response to restrained inorganic carbon uptake, with elevated variable fluorescence and phycocyanin cell quotas with increased Ci,i deficiency. The response of the wild type, however, was distinctly stronger and also included elevated chlorophyll a cell quotas. These differences indicate the limited ability of the mutant to adapt to low-Ci,i conditions. We concluded that MCYSTs may be involved in enhancing the efficiency of the adaptation of the photosynthetic apparatus to fluctuating inorganic carbon conditions in cyanobacterial cells.
Cyanobacteria are able to produce several metabolites that have hepatotoxic, neurotoxic, or dermatotoxic effects on humans and animals. Among this multitude of cyanotoxins, the hepatotoxic microcystins (MCYSTs) occur frequently. MCYSTs are cyclic heptapeptides synthesized by different genera of cyanobacteria, and Microcystis is the most prominent producer. So far, more than 70 different MCYST structures are known (5, 49). Many environmental studies have provided evidence that MCYSTs affect different trophic levels in lake ecosystems. Ecological and molecular studies have provided clues to regulation of MCYST production. Effects of nitrogen, phosphorus, trace elements, light, temperature, and pH on the MCYST content have been proposed and tested (23, 33; for an overview, see reference 46). According to other ecological studies, MCYSTs might act as iron-scavenging molecules or siderophores (for a review, see reference 15). Recent investigations have indicated that MCYSTs have a quorum-sensing or signaling function (8) or have a role as transmembrane transporters (35). Since a functional correlation between an MCYST and a mannan-binding lectin was revealed (22), MCYSTs might also contribute to the formation of colonies. However, the ecological function of MCYSTs remained nebulous.
A possible key for understanding the ecological function was the finding by Orr and Jones (35) that MCYST production is related to the rate of cell division. This finding implies that MCYST production should be controlled by internal cell processes related to growth and/or photosynthesis. From this conclusion, in turn, two consequences follow: (i) because growth and photosynthesis depend on a multitude of environmental factors, the presence of complex and multifactorial regulation of MCYST production is reasonable; and (ii) if MCYST production is influenced by growth or photosynthesis-related internal cell processes, one might speculate that MCYSTs are produced as regulative agents in response to particular (adverse) growth or photosynthesis conditions.
Several findings indicate that MCYSTs have a putative role in regulation of photosynthetic processes. The influence of light (53, 54), the diurnal variation of the MCYST cell quota (2, 54), and the finding that MCYST production is largely controlled by pH (14) support such an assumption. Furthermore, differences in pigment content between a Microcystis wild-type strain and a mcyB mutant of this strain which is deficient in MCYST synthesis suggested that there is involvement in light adaptation processes (13). In addition, increased transcription of the mcyB and mcyD genes at high light levels was found (16). These findings are complemented by ultrastructural observations such as the high immunogold labeling densities of MCYSTs within the thylakoids (56) or carboxysomes (12). All these investigations (2, 12, 13, 14, 16, 35, 53, 54, 56) document that a putative function of MCYSTs related to photosynthesis is now more than just speculation. Regulation of photosynthesis is especially important in alkaline freshwater systems with high dynamics of inorganic carbon (Ci) concentrations (24) due to active Ci uptake by photosynthetic organisms.
An important prerequisite for successful growth in alkaline environments is the ability of cyanobacteria to establish a carbon-concentrating mechanism (CCM) that enables them to concentrate Ci more than 1,000-fold inside the cell (52). Cyanobacteria can adapt to fluctuating Ci and O2 conditions (42) by establishing the CCM in order to minimize carbon leakage through photorespiration (6, 29, 32) or exudation (17) in the presence of low CO2/O2 ratios. The CCM itself consists of two functional elements: carbon transport systems and containment of ribulose-1,5-bisphosphate carboxylase/oxygenase (RuBisCO) in carboxysomes. The uptake of Ci occurs via independent transport systems, namely, two CO2 uptake systems and two or more HCO3− transporters. Species occurring in environments with fluctuating Ci conditions exhibit the most complete set of transport systems (1). Most commonly, the dominating carbon species HCO3− is transported by an HCO3− ATP binding cassette (ABC) transporter and an Na+/HCO3− symporter (19). Consequently, Na+ is required for the active transport of Ci (20, 47). Moreover, carbon accumulation is regulated by light (21, 50) and hence also influenced by the diurnal light cycle.
The present study was undertaken to test the hypothesis that processes involved in cyanobacterial adaptation to fluctuating Ci conditions and particularly to increased intracellular inorganic carbon (Ci,i) deficiency are related to MCYST production. This is a novel hypothesis based on investigations cited above and our preliminary work. “Relative Ci,i deficiency” refers to an internal CO2/O2 ratio boosting the oxygenase function of RuBisCO. Photosynthetic pigment concentrations, chlorophyll fluorescence, and pH were measured to characterize the responses of the cells to different degrees of Ci accumulation. Different Ci,i states were obtained by modification of the growth medium or by a diurnal dark-light change in the following ways. In experiments 1 and 2, the Na+ concentration was reduced to a minimum in order to constrain the Ci uptake via the Na+/HCO3− symporter. Consequently, a relative Ci,i deficiency was obtained with this treatment. In experiment 2, the responses to different Ci,i conditions of the MCYST-producing wild-type strain and an MCYST-deficient mutant were compared. A third experiment tested whether the effects of the natural diurnal Ci,i fluctuations on MCYST production resembled the findings obtained in experiments 1 and 2.
MATERIALS AND METHODS
Culture conditions.
Cells of Microcystis aeruginosa strain PCC 7806 were grown in a 3-liter Erlenmeyer flask with 1.5 liters of culture medium at 18.5°C and a light intensity of 105 microeinsteins m−2 s−1 (experiments 1 and 3) or 30 microeinsteins m−2 s−1 (experiment 2). In order to study adaptation following the shift from dark to light, a cycle consisting of 15 h of light and 9 h of darkness was used in experiment 3. Cultures in experiments 1 and 2 were exposed to continuous light to exclude light-induced diurnal effects. Z/4 medium (57) was used as the culture medium in experiment 3 and for the reference treatments in experiments 1 and 2. The concentration of NaHCO3 in these reference treatments was 2 mM (Na medium). To restrict sodium-dependent bicarbonate uptake, this medium was modified for the Ci,i deficiency treatments in experiments 1 and 2 by replacing all the sodium components with the corresponding potassium compounds (K medium). Cells were not washed and experiments were carried out in glass flasks, so a minimum amount of Na+ always remained. Experiment 2 was performed to compare the adaptations to different Ci,i conditions of the wild-type strain M. aeruginosa PCC 7806 and its knockout mutant lacking the ability to produce MCYSTs (9). The mutant was kindly provided by the laboratory of Thomas Börner (Institute of Biology, Genetics, Humboldt University, Berlin, Germany). All experiments were carried out with batch cultures, and the initial cell concentration for all treatments was adjusted to 105 cells ml−1. Each treatment was performed in triplicate.
Sampling and analytical methods.
At least 100 ml of a cell suspension was removed for analysis at each sampling time, and the volume was adjusted to obtain an approximately constant cell number. The pH values in cell suspensions were measured using a pH meter (pH 95; WTW Instruments). Major aliquots of the samples were filtered through several glass microfiber disks (GMF 5; Filtrak). The filters were stored at −18°C, freeze dried, and retained for chlorophyll a (Chl a), carbon, and MCYST analyses. The filtrate was used to analyze the extracellular MCYSTs. A minor volume of the cell suspension (3 ml) was frozen without filtration to analyze phycocyanin. Cell numbers were determined after filtration onto polycarbonate filters (0.22 μm; Osmonics Inc.) by epifluorescence microscopy (Axiophot; Zeiss). The cell diameter was measured using an inverted microscope (Nikon Eclipse TE 2000-S) equipped with a digital camera (JVC TK-1380) and an image-processing system (analySIS 3.1 Build 540; Soft Imaging System GmbH). For Chl a analysis, cells were disrupted using an IKA Ultra TURRAX (T 18 basic; IKA Labortechnik) and extracted in ethanol (90%), and concentrations were determined based on emission at 667 nm using a luminescence spectrometer (LS 50 B; Perkin Elmer) and an excitation wavelength of 434 nm. For phycocyanin analysis cells were disrupted by freezing and ultrasonication (Sonoplus W 70; Bandelin) and extracted in phosphate buffer (pH 7, 12 h, 4°C) (36), and concentrations were determined by measuring the emission at 645 nm using a luminescence spectrometer (LS 50 B; Perkin Elmer) and an excitation wavelength of 625 nm. The purity of phycocyanin was evaluated by using the A620/A280 ratio (30). Absorbance measurements were obtained using a UV/visible light spectrometer (Lambda 12; Perkin Elmer). For carbon analysis, a cell suspension was filtered onto precombusted glass microfiber disks (GMF 5; Filtrak), freeze dried, and analyzed with a carbon analyzer (Leco C 200; Leco Instrumente GmbH). Chlorophyll fluorescence as a measure of relative Ci,i deficiency, which is equivalent to an inverse measure of Ci,i accumulation, was determined with a PAM fluorometer (Walz) using the following procedure. Prior to measurement, cells were dark adapted for 20 min. After a weak pulse-modulated beam was switched on, the initial fluorescence was measured. The maximum fluorescence was determined following a saturating flash after exposure to actinic light. The variable fluorescence was expressed as the difference between the maximum fluorescence and the initial fluorescence (7, 28). To compare variable fluorescence values for various experiments and treatments, the measured values were related to the corresponding cell concentrations. Intracellular MCYSTs were extracted using methanol-1.3 mM acetic acid (67:33, vol/vol). The extracts were preconcentrated by solid-phase extraction (Strata C18; Phenomenex Inc.). In order to analyze extracellular MCYSTs, the solid-phase extraction was performed using polymeric sorbent cartridges (Strata X 33-μm polymeric sorbent; Phenomenex Inc.). Analysis of both intracellular and extracellular MCYSTs was carried out by high-performance liquid chromatography-diode array detector using a Phenomenex Luna C18 column (250 by 4.6 mm; 5 μm). MCYSTs were identified on the basis of their characteristic absorption spectra, and the sum for all MCYST variants detected was calculated (see reference 14 for further analytical details).
Calculation of growth and MCYST parameters and statistics.
The growth parameters of the individual experiments were calculated using the following equation:
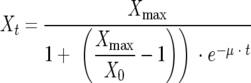 |
where Xmax is the maximum cell yield (capacity), μ is the growth rate, t is time, Xt is the cell number at t > 0, and X0 is the cell number at time zero.
All computations were performed using the R system for statistical computing (39).
RESULTS
MCYST production in relation to different Ci uptake conditions.
Batch culture experiments were performed to investigate MCYST production in relation to relatively low (K medium) and high (Na medium) availability of Ci,i. The variable fluorescence as a measure of Ci,i deficiency within the cells was always higher in K medium (Fig. 1b). The differences in the variable fluorescence indicated that there was a significantly more pronounced Ci,i deficiency in cells grown in K medium than in cells grown in Na medium (Table 1). Modification of the Ci,i availability resulted in changes in key growth parameters. Both the maximum growth rate (μmax) and Xmax were reduced in K medium compared to Na medium (Fig. 1a). Cell sizes, however, were only slightly different for the two treatments (Table 1), thus allowing comparison of MCYST (and pigment) cell quotas. The culture volumetric MCYST concentrations for the two treatments nearly reflected the corresponding growth curve (Fig. 1c). More pronounced Ci,i deficiency in cells grown in K medium resulted in enhanced cell MCYST quotas (Fig. 1e and Table 1). The most obvious finding of this experiment was the higher percentage of extracellular MCYSTs in K medium (Fig. 1d). Thus, the total MCYST production (intracellular plus extracellular) was significantly enhanced under Ci,i deficiency conditions (K medium) (Fig. 1f and Table 1). However, the ratio of MCYST-LR to [d-Asp3]-MCYST-LR was not influenced (Table 1). Besides the elevated MCYST production, a higher phycocyanin content was detected in cells grown in K medium (Table 1). No significant differences were found between the two treatments with respect to the Chl a content of the cells (Table 1).
FIG. 1.

Comparison of the effects of relatively high Ci,i deficiency (K medium) and low Ci,i deficiency (Na medium) on (a) growth, (c) volumetric MCYST concentrations, (e) MCYST cell quotas, (b) relative units of variable fluorescence (Fv, rel), (d) the percentage of extracellular MCYSTs, and (f) the total MCYST production of M. aeruginoa PCC 7806 (growth parameters for Na medium, μmax = 0.4 day−1 and Xmax = 8.7 × 10⁶ cells ml−1; growth parameters for K medium, μmax = 0.22 day−1 and Xmax = 7.6 × 10⁶ cells ml−1). All symbols and bars indicate means, and standard errors of three replicates are indicated by error bars. See Table 1 for statistical tests of differences between treatments.
TABLE 1.
Effects of relatively low deficiency (Na medium) and high deficiency (K medium) of Ci,i on different MCYST values, pigment content, relative units of variable fluorescence, and cell size of M. aeruginosa PCC 7808 in batch experiment 1 (n = 3)a
| Medium | MCYST cell quota (fg cell−1), only intracellularb | MCYST production (fg cell−1 day−1), intracellular + extracellularc | MCYST-LR/[d-Asp3]-MCYST-LR ratiob | % of MCYST extracellularb | Chl a cell quota (fg cell−1)b | Phycocyanin cell quota (pg cell−1)b | Fv,rel (10−4 cell−1)d | Cell diam (μm)b |
|---|---|---|---|---|---|---|---|---|
| Na (high Ci,i) | 18.0 (0.95) | 0.65 (0.3) | 0.25 (0.01) | 0.21 (0.01) | 25.7 (3.5) | 1.20 (0.02) | 2.55 (0.14) | 2.35 (0.01) |
| K (low Ci,i) | 23.7 (0.96) | 2.2 (0.3) | 0.31 (0.03) | 0.47 (0.03) | 29.2 (1.6) | 2.46 (0.16) | 2.64 (0.15) | 2.45 (0.04) |
| P value | 0.01e | 0.0001e | 0.08 | 0.0007e | 0.15 | 0.001e | 0.049e | 0.065 |
See Materials and Methods for an explanation of the treatments. All values are averages for the exponential growth phase. The values in parentheses are standard errors.
Means for exponential growth were tested.
A linear mixed model (38) with MCYST as the dependent variable and medium as the independent variable was used; the intercept was assumed to be constant, and only the slope for each replicate with time as a random effect was tested.
Fv,rel, relative units of variable fluorescence. Data were fitted by using Fv,rel = a · e−b · t and parameter b was tested.
Significant at α = 0.05.
Responses of the wild-type strain and the mcyB mutant to different Ci uptake conditions.
To examine the potential impact of MCYST on photosynthesis and/or growth, the effects of Ci,i availability on cell number (yield), photosynthetic pigments, and variable fluorescence were compared for the MCYST-producing wild-type strain M. aeruginosa PCC 7806 and its mcyB mutant lacking the ability to produce MCYSTs. The effects of modification of the medium on the wild type and mutant were tested by using analysis of variance (Table 2). A significant interaction between the strain (as a proxy for the ability or inability to produce MCYSTs) and the medium (as a proxy for the Ci,i status of the cells) indicates the different responses of the wild type and the mutant to different Ci,i states. As anticipated by theory, the variable fluorescence reflected the Ci,i status of the cells, and no statistically significant strain-medium interaction was found (Table 2). Both wild-type and mutant cells exhibited higher variable fluorescence in response to enhanced Ci,i deficiency (K medium) (Fig. 2c). The two strains also did not respond significantly differently in their phycocyanin contents; both exhibited a significant increase in the phycocyanin content with a more pronounced Ci,i deficiency (K medium) (Fig. 2d and Table 2). Moreover, the response of the wild type to Ci,i deficiency was more explicit than the response of the mutant. However, no interaction effect was found (Table 2). Distinct differences in the responses of the two strains were observed for the cell yield and Chl a content (Table 2). While modification of the Ci,i status of the cells had no influence on the cell yield of the wild type, the yield of the mutant was significantly lower in the low-Ci,i K medium than in the high-Ci,i Na medium (Fig. 2a and Table 2). In contrast to the mutant, the wild type showed a clearly elevated concentration of Chl a with more pronounced Ci,i deficiency (K medium) (Fig. 2b).
TABLE 2.
Results of a two-factor analysis of variance in response to medium as a proxy for relatively high (K medium) and low (Na medium) deficiency of Ci,i and to strain (wild type and mutant) as a proxy for the ability or inability to produce MCYSTs
| Parameter | Variablea | df | Mean squares | F value | P value |
|---|---|---|---|---|---|
| Microcystis concn (cells ml−1) | Strain | 1 | 1.08 × 10¹⁰ | 0.05 | 0.84 |
| Medium | 1 | 1.13 × 10¹² | 4.73 | 0.06 | |
| Strain × medium | 1 | 2.24 × 10¹² | 9.37 | 0.02 | |
| Residuals | 8 | 2.39 × 10¹¹ | |||
| Chl a concn (fg cell−1) | Strain | 1 | 7.47 × 101 | 4.89 | 0.06 |
| Medium | 1 | 1.32 × 10³ | 86.64 | 1.0 × 10⁻⁵ | |
| Strain × medium | 1 | 5.15 × 10² | 33.75 | 4.0 × 10⁻⁴ | |
| Residuals | 8 | 1.53 × 101 | |||
| Phycocyanin concn (fg cell−1) | Strain | 1 | 2.11 × 10⁵ | 3.12 | 0.12 |
| Medium | 1 | 4.15 × 10⁵ | 6.14 | 0.04 | |
| Strain × medium | 1 | 1.25 × 10⁵ | 1.85 | 0.21 | |
| Residuals | 8 | 6.76 × 10⁴ | |||
| Relative units of variable | Strain | 1 | 6.58 × 10⁻¹¹ | 1.97 | 0.20 |
| fluorescence related to | Medium | 1 | 1.85 × 10⁻⁹ | 55.38 | 1.0 × 10⁻⁴ |
| equal cell concn | Strain × medium | 1 | 3.68 × 10⁻¹³ | 0.01 | 0.92 |
| Residuals | 8 | 3.35 × 10⁻¹¹ |
All variables were measured in the exponential growth phase.
FIG. 2.

Comparison of the effects of relatively low Ci,i deficiency (Na medium) and high Ci,i deficiency (K medium) on (a) cell yield, (b) Chl a cell quota, (c) relative units of variable fluorescence (Fv, rel), and (d) phycocyanin cell quota of the MCYST-producing wild-type strain M. aeruginosa PCC 7806 and its mcyB mutant. The box plots show the results for three replicates at the exponential growth phase (batch cultures).
Intracellular MCYSTs during a dark-light change.
One may argue that limiting the Ci,i uptake in the K medium used in the two experiments described above might have represented rather artificial conditions for the Microcystis cells. Therefore, in a third experiment the impact of more natural variation of the Ci,i status on MCYST production was studied without suppressing the sodium-dependent bicarbonate transporter. For this purpose, samples of the culture were obtained at the end of the dark phase and in the following 15-h light phase (Fig. 3). The results for several variables indicate that there were three subphases of cellular response during the light phase (Fig. 3). The Microcystis cells grew exponentially over the entire experimental period (Fig. 3a). No distinct differences in the cell division rates between the three subphases of the experiment were observed (μ was 0.68, 0.63, and 0.56 day−1 in subphases I, II, and III, respectively), which suggests that there was continuous cell division and excludes the possibility that there were large differences in cell size. Thus, an important prerequisite for comparing cell MCYST and pigment quotas was fulfilled. After the light period started, the pH increased distinctly in subphases I and II and remained almost constant during the rest of the experiment (subphase III) (Fig. 3b). The total intracellular carbon concentration decreased in subphase I and remained more or less low during subphases II and III (Fig. 3c). The cell MCYST quotas were variable over the diurnal time scale (Fig. 3f). They remained almost constant during the first 2 h of the light period (subphase I), and this was followed by a progressive increase in subphase II and a tendency toward a slight decrease in subphase III. Extracellular MCYSTs contributed less than 10% and thus contributed only marginally to the total MCYST concentration (data not shown). The variable fluorescence (as a measure of Ci,i deficiency within the cells) rose after the light period started, and it coincided during the rest of the experiment with variations in cell MCYST quotas (compare Fig. 3e and 3f). Coinciding with decreasing variable fluorescence in subphase III, the phycocyanin cell quotas also declined (compare Fig. 3 d and 3e).
FIG. 3.

Dark-light changes in a growing M. aeruginosa PCC 7806 batch culture, including (a) cell concentration (note the logarithmic scale), (b) pH value and pH change (Δ pH) between two consecutive sampling points, (c) total carbon concentration, (d) phycocyanin cell quota, (e) relative units of the variable fluorescence (Fv,rel), and (f) MCYST cell quota. All values are means ± standard errors obtained from three replicates. Fv, variable fluorescence; def., deficiency; invar./decr., invariate/decreasing.
DISCUSSION
The results of all three experiments reported here support our hypothesis that varying Ci,i conditions have an influence on MCYST production. In freshwater cyanobacteria, intracellular accumulation of Ci by the CCM is induced primarily by depletion of the Ci,i pool (55). Photorespiratory metabolites have also been discussed as further elicitors (18, 55). We adjusted the cellular status for relative low or high Ci,i deficiency by using two different media (Na medium and K medium) in experiments 1 and 2 and by the dark-light change in experiment 3. Increased Ci,i deficiency must be assumed for the K medium treatments in the first and second experiments and during subphase II in the third experiment. In all cases, increased Ci,i deficiency was indicated by elevated variable fluorescence and, to a lesser extent, by elevated cell phycocyanin quotas. These findings corroborate results of Mandori and Melis (26), Müller et al. (32), MacKenzie et al. (25), and Burns et al. (3) for phycocyanin (and the phycocyanin/Chl a ratio) and results of Miller and Canvin (28) and Crotty et al. (7) for the variable fluorescence. Remarkably, the mcyB mutant did not differ significantly from the wild type in this respect, indicating that the two strains were affected in the same way by modulating the extent of Ci,i deficiency irrespective of their ability to produce MCYSTs.
In all test designs, experimentally increased Ci,i deficiency led to enhanced MCYST production (higher cell MCYST quotas in the first and third experiments or elevated release of MCYST in the first experiment). A putative function of MCYSTs can be assumed inside or outside the cells. Our results for the relationship between relative Ci,i deficiency and MCYSTs cannot answer this question, as both intra- and extracellular levels of MCYSTs were enhanced under Ci,i-deficient conditions. Based on previous investigations, the occurrence of extracellular MCYSTs is ascribed to culture density or may originate from senescence and cell death at the end of exponential growth (46). In contrast to these hypotheses, the percentage of extracellular MCYSTs in experiment 1 was considerably elevated during exponential growth. The interpretation that the latter finding is a result of directed transport of MCYSTs out of the cells is supported by the fact that an ABC transporter gene is directly linked to the mcy gene cluster (8, 37, 51). Cyanobacterial ABC transporters may be involved in the transport of allocrites, including bicarbonate (34). Furthermore, since nodularin, another cyanotoxin closely related to MCYSTs, can form pores in lipid bilayers (48), MCYSTs were assumed to act as transmembrane transporters (35). A relationship between Ci,i deficiency and extracellular MCYSTs is further supported by the fact that, in general, the amount of extracellular MCYSTs seems to be low in continuous cultures (23, 54) and higher in batch cultures (14, 35, 41, 44). Because exposure to light and the culture regimen have an influence on the extent of Ci,i accumulation, all these findings may be interpreted as an effect of relative Ci,i deficiency.
The assumption that MCYSTs have an extracellular function competes with the finding that the bulk of MCYSTs is localized inside the cells (12). In detail, the bulk of MCYSTs was detected in intracellular inclusions, such as polyphosphate bodies and carboxysomes, without any dependence on the cells' experience with light. Judging from the large amounts of MCYSTs embedded in carboxysomes, the hypothesis that MCYSTs might adjust the synthesis of RuBisCO was supported (12, 14). Other investigations have shown that the highest MCYST content is in the thylakoid area (56). Therefore, it also appears to be likely that MCYSTs may be involved in processes associated with the light reactions of photosynthesis. Regarding a putative specific function for MCYSTs inside the cyanobacterial cell, both implications—the involvement in controlling RuBisCO and the light reactions of photosynthesis—correspond fairly well with our results.
The dynamics of the variable fluorescence and cell phycocyanin quotas as indicators of the Ci,i status of the cells showed that in subphase III of the third experiment distinct Ci,i accumulation must have occurred. This provided the opportunity to compare two phases with low Ci,i deficiency, subphases I and III. However, only in subphase III was the low Ci,i deficiency caused by elevated Ci,i accumulation. Unlike the low Ci,i deficiency in subphase III, in subphase I the Ci,i deficiency was low due to the transition from the dark phase to the light phase. However, cells became increasingly Ci,i deficient due to the proceeding carboxylation. We assumed that the cells sensed the increasing Ci,i deficiency during the transition from subphase I to subphase II and that this triggered MCYST production. As a result, Ci,i deficiency was reduced in subphase III. This postulated mechanism would also explain the diurnal pattern of MCYST cell quotas reported previously for M. aeruginosa in continuous cultures (54) and for Microcystis panniformis in batch cultures (2). Generally, all these experiments were characterized by an increase in the MCYST cell quota two or more hours after the light was switched on (Fig. 4). However, the amplitudes of variation differed in the individual investigations. This was likely due to differences in the culture regimens and cell densities, which may have generated different states of Ci,i deficiency.
FIG. 4.

Synopsis of changes in the MCYST cell quotas in response to diurnal dark-light change determined by different authors. Data were obtained in this study (gray circles), by using continuous cultures of M. aeruginosa PCC 7806 at light intensities of 10 and 40 μmol m−2 s−1 (gray and open squares, respectively) (54), and by using a batch culture of M. panniformis at a light intensity of 75 μmol m−2 s−1 (open triangles) (2). Relative MCYST cell quotas (MCYSTrel) were calculated from the original data by determining the ratio of the MCYST cell quota at any sampling time to the MCYST cell quota at the end of the dark phase.
Chl a quotas reacted differently to increased relative Ci,i deficiency in the MCYST-producing wild-type strain and the mcyB mutant. Whereas in the wild-type strain the Chl a cell quotas increased, the mutant showed no distinct enhancement. In experiments performed by Hesse et al. (13), the same wild-type strain also exhibited a higher Chl a content than the same mutant under light limitation conditions, which was comparable to the relative Ci,i deficiency in K medium in our second experiment (Fig. 2). In contrast to the response of Chl a cell quotas, both the wild type and the mutant showed increased phycocyanin cell quotas with increased Ci,i deficiency. Hence, the ratio of phycocyanin to Chl a remained almost unchanged in only the wild-type cells. Cyanobacteria are known to adapt to varying Ci conditions by adjusting the phycocyanin/Chl a ratio (10, 26). This adaptation to the prevailing Ci,i conditions facilitates energization of Ci uptake (21, 27) and Ci,i accumulation (31), thereby improving the photosynthetic efficiency (11) in the wild-type cells. In contrast to the wild type, this feature seems to be repressed or deactivated in mutant cells. Obviously, for this reason the mcyB mutant in experiment 2 showed lower cell yields with increased Ci,i deficiency compared to Ci,i-sufficient conditions. However, the effect of improving the photosynthetic efficiency and hence the cell yield by adapting the phycocyanin/Chl a ratio to the prevailing Ci,i conditions is light dependent. Under high-light conditions (experiment 1) the capacity of this mechanism was obviously exceeded, so that the cell yield with increased Ci,i deficiency even in the wild-type strain could not be fully compensated for to the same extent as under Ci,i-sufficient conditions (Fig. 1a). On the other hand, under rather low-light conditions (experiment 2) the adaptation of the wild-type cells resulted in very slight differences in cell yields between the two Ci,i variants. Since there was close agreement in all experiments between the ability to adjust the photosynthetic pigments to the Ci,i status and the extent of MCYST production, we concluded that MCYSTs might be involved directly or indirectly in Ci,i accumulation. Furthermore, based on the time pattern seen in experiment 3 it is proposed that MCYST production precedes Ci,i accumulation. As the ratio of the two MCYST variants (MCYST-LR and [d-Asp3]-MCYST-LR) produced by strain PCC 7806 was not influenced by the Ci,i status, the possibility of a specific function of one of these structural variants can be excluded.
All putative functions of MCYSTs should result in a competitive advantage for strains able to produce MCYSTs over nonproducing strains unless the latter have developed compensating mechanisms. These compensating mechanisms may consist of producing other peptides as substitutes for MCYSTs (35, 43, 45) or adapting other physiological properties, leading to the same photosynthetic efficiency (e.g., by modulation of RuBisCO specificity [52]). Nevertheless, our hypothesis that MCYSTs might be involved in the adaptation to varying Ci,i conditions is one of the few existing explanations of the ecophysiological function of MCYSTs which are in accordance with recent insights into the early evolution of MCYST synthesis. As Rantala et al. (40) emphasize, “any model that attempts to explain why cyanobacteria make these peptides must now account for the age of the toxin synthetase genes.” Our experimental findings indicating that MCYSTs have a role in the photosynthetic adaptation to a relative Ci,i deficiency meet this requirement. A relative physiological Ci,i deficiency may have appeared during cyanobacterial evolution parallel to increasing environmental oxygen concentrations (4), causing an increasing oxygenase function of RuBisCO. An enhanced oxygenase function of RuBisCO, in turn, might have provided a competitive advantage for cyanobacteria having the ability to keep the internal CO2/O2 ratio high by an effective CCM, in which MCYSTs might be involved. However, further investigations beyond the scope of this study are necessary to test this hypothesis on the molecular level.
Acknowledgments
We thank Gabriele Egerer, Yvonne Calderelli, and Katharina Memmel for technical assistance and Emily Susko for linguistic improvements. We are particularly indebted to Thomas Börner for providing the mcyB mutant and to Ingrid Chorus for valuable comments on a draft of the manuscript.
This study was supported by the German Science Foundation (DFG grant Be 1671/4-1,3,4).
Footnotes
Published ahead of print on 7 September 2007.
REFERENCES
- 1.Badger, M. R., G. D. Price, B. M. Long, and F. J. Woodger. 2006. The environmental plasticity and ecological genomics of the cyanobacterial CO2 concentrating mechanism. J. Exp. Bot. 57:249-265. [DOI] [PubMed] [Google Scholar]
- 2.Bittencourt-Oliveira, M. D., P. Kujbida, K. Cardozo, K. H. M. Carvalho, V. M. Moura, A. D. Colepicolo, and E. Pinto. 2005. A novel rhythm of microcystin biosynthesis is described in the cyanobacterium Microcystis panniformis Komárek et al. Biochem. Biophys. Res. Commun. 326:687-694. [DOI] [PubMed] [Google Scholar]
- 3.Burns, R. A., C. D. MacDonald, P. J. McGinn, and D. A. Campbell. 2005. Inorganic carbon repletion disrupts photosynthetic acclimation to low temperature in the cyanobacterium Synechococcus elongatus. J. Phycol. 41:322-334. [Google Scholar]
- 4.Cavalier-Smith, T. 2006. Cell evolution and Earth history: stasis and revolution. Phil. Trans. R. Soc. Lond. B 361:969-1006. [DOI] [PMC free article] [PubMed] [Google Scholar]
- 5.Codd, G. A., J. Lindsay, F. M. Young, L. F. Morrison, and J. S. Metcalf. 2005. Harmful cyanobacteria—from mass mortalities to management measures, p. 1-23. In J. Huisman, H. C. Matthijs, and P. M. Visser (ed.), Harmful cyanobacteria, Springer, Berlin, Germany.
- 6.Colman, B. 1989. Photosynthetic carbon assimilation and the suppression of photorespiration in the cyanobacteria. Aquat. Bot. 34:211-231. [Google Scholar]
- 7.Crotty, C. M., P. N. Tyrrell, and G. S. Espie. 1994. Quenching of chlorophyll a fluorescence in response to Na+-dependent HCO3− transport-mediated accumulation of inorganic carbon in the cyanobacterium Synechococcus UTEX 625. Plant Physiol. 104:785-791. [DOI] [PMC free article] [PubMed] [Google Scholar]
- 8.Dittmann, E., M. Erhard, M. Kaebernick, C. Scheler, B. A. Neilan, H. von Döhren, and T. Börner. 2001. Altered expression of two light-dependent genes in a microcystin-lacking mutant of Microcystis aeruginosa PCC 7806. Microbiology 147:3113-3119. [DOI] [PubMed] [Google Scholar]
- 9.Dittmann, E., B. A. Neilan, M. Erhard, H. von Döhren, and T. Börner. 1997. Insertional mutagenesis of a peptide synthetase gene that is responsible for hepatotoxin production in the cyanobacterium Microcystis aeruginosa PCC 7806. Mol. Microbiol. 26:779-787. [DOI] [PubMed] [Google Scholar]
- 10.Eley, J. H. 1971. Effect of carbon dioxide concentration on pigmentation in blue-green alga Anacystis nidulans. Plant Cell Physiol. 12:311-316. [Google Scholar]
- 11.Fujita, Y. 1997. A study on the dynamic features of photosystem stoichiometry: accomplishments and problems for future studies. Photosynth. Res. 53:83-93. [Google Scholar]
- 12.Gerbersdorf, S. U. 2006. An advanced technique for immuno-labelling of microcystins in cryosectioned cells of Microcystis aeruginosa PCC 7806 (cyanobacteria): implementations of an experiment with varying light scenarios and culture densities. Toxicon 47:218-228. [DOI] [PubMed] [Google Scholar]
- 13.Hesse, K., E. Dittmann, and T. Börner. 2001. Consequences of impaired microcystin production for light-dependent growth and pigmentation of Microcystis aeruginosa PCC 7806. FEMS Microbiol. Ecol. 37:39-43. [Google Scholar]
- 14.Jähnichen, S., T. Petzoldt, and J. Benndorf. 2001. Evidence for control of microcystin dynamics in Bautzen Reservoir (Germany) by cyanobacterial population growth rates and dissolved inorganic carbon. Arch. Hydrobiol. 150:177-196. [Google Scholar]
- 15.Kaebernick, M., and B. A. Neilan. 2001. Ecological and molecular investigations of cyanotoxin production. FEMS Microbiol. Ecol. 35:1-9. [DOI] [PubMed] [Google Scholar]
- 16.Kaebernick, M., B. A. Neilan, T. Börner, and E. Dittmann. 2000. Light and the transcriptional response of the microcystin biosynthesis gene cluster. Appl. Environ. Microbiol. 66:3387-3392. [DOI] [PMC free article] [PubMed] [Google Scholar]
- 17.Kamjunke, N. 1998. Bakterielle Produktion und Primärproduktion unter verschiedenen trophischen Bedingungen und ihre Bedeutung als Nahrung für Daphnien in einer biomanipulierten Talsperre. Dissertation. Technische Universität Dresden, Dresden, Germany.
- 18.Kaplan, A., Y. Helman, D. Tchernov, and L. Reinhold. 2001. Acclimation of photosynthetic microorganisms to changing ambient CO2 concentration. Proc. Natl. Acad. Sci. USA 98:4817-4818. [DOI] [PMC free article] [PubMed] [Google Scholar]
- 19.Kaplan, A., R. Schwarz, J. Lieman-Hurwitz, and L. Reinhold. 1991. Physiological and molecular aspects of the inorganic carbon-concentrating mechanism in cyanobacteria. Plant Physiol. 97:851-855. [DOI] [PMC free article] [PubMed] [Google Scholar]
- 20.Kaplan, A., M. Volokita, D. Zenvirth, and L. Reinhold. 1984. An essential role for sodium in the bicarbonate transporting system of the cyanobacterium Anabaena variabilis. FEBS Lett. 176:166-168. [Google Scholar]
- 21.Kaplan, A., D. Zenvirth, Y. Marcus, T. Omata, and T. Ogawa. 1987. Energization and activation of inorganic carbon uptake by light in cyanobacteria. Plant Physiol. 84:210-213. [DOI] [PMC free article] [PubMed] [Google Scholar]
- 22.Kehr, J. C., Y. Zilliges, A. Springer, M. D. Disney, D. D. Ratner, C. Bouchier, P. H. Seeberger, N. T. de Marsac, and E. Dittmann. 2006. A mannan binding lectin is involved in cell-cell attachment in a toxic strain of Microcystis aeruginosa. Mol. Microbiol. 59:893-906. [DOI] [PubMed] [Google Scholar]
- 23.Long, B. M., G. J. Jones, and P. T. Orr. 2001. Cellular microcystin content in N-limited Microcystis aeruginosa can be predicted from growth rate. Appl. Environ. Microbiol. 67:278-283. [DOI] [PMC free article] [PubMed] [Google Scholar]
- 24.Maberly, S. C. 1996. Diel, episodic and seasonal changes in pH and concentrations of inorganic carbon in a productive lake. Freshw. Biol. 35:579-598. [Google Scholar]
- 25.MacKenzie, T. D. B., R. A. Burns, and D. A. Campbell. 2004. Carbon status constrains light acclimation in the cyanobacterium Synechococcus elongatus. Plant Physiol. 136:3301-3312. [DOI] [PMC free article] [PubMed] [Google Scholar]
- 26.Manodori, A., and A. Melis. 1984. Photochemical apparatus organization in Anacystis nidulans (Cyanophyceae)—effect of CO2 concentration during cell growth. Plant Physiol. 74:67-71. [DOI] [PMC free article] [PubMed] [Google Scholar]
- 27.Miller, A. G., G. S. Espie, and D. Bruce. 1996. Characterization of the non-photochemical quenching of chlorophyll fluorescence that occurs during the active accumulation of inorganic carbon in the cyanobacterium Synechococcus PCC 7942. Photosynth. Res. 49:251-262. [DOI] [PubMed] [Google Scholar]
- 28.Miller, A. G., and D. T. Canvin. 1987. The quenching of chlorophyll a fluorescence as a consequence of the transport of inorganic carbon by the cyanobacterium Synechococcus UTEX 625. Biochim. Biophys. Acta 894:407-413. [Google Scholar]
- 29.Miller, A. G., D. H. Turpin, and D. T. Canvin. 1984. Growth and photosynthesis of the cyanobacterium Synechococcus leopoliensis in HCO3−-limited chemostats. Plant Physiol. 75:1064-1070. [DOI] [PMC free article] [PubMed] [Google Scholar]
- 30.Minkova, K. M., A. A. Tchernov, M. I. Tchorbadjieva, S. T. Fournadjieva, R. E. Antova, and M. C. Busheva. 2003. Purification of C-phycocyanin from Spirulina (Arthrospira) fusiformis. J. Biotechnol. 102:55-59. [DOI] [PubMed] [Google Scholar]
- 31.Miyachi, S., J. Bürger, K. Kotzabasis, J. Thielmann, and H. Senger. 1996. Photosynthetic characteristics of three strains of cyanobacteria grown under low- or high-CO2 conditions. Z. Naturforsch. 51:40-46. [Google Scholar]
- 32.Müller, C., W. Reuter, W. Wehrmeyer, H. Dau, and H. Senger. 1993. Adaptation of the photosynthetic apparatus of Anacystis nidulans to irradiance and CO2 concentration. Bot. Acta 106:480-487. [Google Scholar]
- 33.Oh, H.-M., S. J. Lee, M.-H. Jang, and B.-D. Yoon. 2000. Microcystin production of Microcystis aeruginosa in a phosphorus-limited chemostat. Appl. Environ. Microbiol. 66:176-179. [DOI] [PMC free article] [PubMed] [Google Scholar]
- 34.Omata, T., D. Price, M. R. Badger, M. Okamura, S. Gohta, and T. Ogawa. 1999. Identification of an ATP-bindung cassette transporter involved in bicarbonate uptake in the cyanobacterium Synechococcus sp. strain PCC 7942. Proc. Natl. Acad. Sci. USA 96:13571-13576. [DOI] [PMC free article] [PubMed] [Google Scholar]
- 35.Orr, P. T., and G. J. Jones. 1998. Relationship between microcystin production and cell division rates in nitrogen-limited Microcystis aeruginosa cultures. Limnol. Oceanogr. 43:1604-1614. [Google Scholar]
- 36.Otsuki, A., T. Omi, S. Hashimoto, M. Aizaki, and N. Takamura. 1994. HPLC fluorometric-determination of natural phytoplankton phycocyanin and its usefulness as cyanobacterial biomass in highly eutrophic shallow lake. Water Air Soil Pollut. 76:383-396. [Google Scholar]
- 37.Pearson, L. A., M. Hisbergues, T. Börner, E. Dittmann, and B. Neilan. 2004. Inactivation of an ABC transporter gene, mcyH, results in loss of microcystin production in the cyanobacterium Microcystis aeruginosa PCC 7806. Appl. Environ. Microbiol. 70:6370-6378. [DOI] [PMC free article] [PubMed] [Google Scholar]
- 38.Pinheiro, J. C., and D. M. Bates. 2000. Mixed-effects models in S and S-Plus. Springer, New York, NY.
- 39.R Development Core Team. 2003. R: a language and environment for statistical computing. R Foundation for Statistical Computing, Vienna, Austria.
- 40.Rantala, A., D. P. Fewer, M. Hisbergues, L. Rouhiainen, J. Vaitomaa, T. Börner, and K. Sivonen. 2004. Phylogenetic evidence for the early evolution of microcystin synthesis. Proc. Natl. Acad. Sci. USA 101:568-573. [DOI] [PMC free article] [PubMed] [Google Scholar]
- 41.Rapala, J., K. Sivonen, C. Lyra, and S. I. Niemelä. 1997. Variation of microcystins, cyanobacterial hepatotoxins, in Anabaena spp. as a function of growth stimuli. Appl. Environ. Microbiol. 63:2206-2212. [DOI] [PMC free article] [PubMed] [Google Scholar]
- 42.Raven, J. A. 2003. Inorganic carbon concentrating mechanisms in relation to the biology of algae. Photosynth. Res. 77:155-171. [DOI] [PubMed] [Google Scholar]
- 43.Repka, S., M. Koivula, V. Harjunpa, L. Rouhiainen, and K. Sivonen. 2004. Effects of phosphate and light on growth of and bioactive peptide production by the cyanobacterium Anabaena strain 90 and its anabaenopeptilide mutant. Appl. Environ. Microbiol. 70:4551-4560. [DOI] [PMC free article] [PubMed] [Google Scholar]
- 44.Robillot, C., J. Vinh, S. Puiseux-Dao, and M.-C. Hennion. 2000. Hepatotoxin production kinetics of the cyanobacterium Microcystis aeruginosa PCC 7820, as determined by HPLC mass spectrometry and protein phosphatase bioassay. Environ. Sci. Technol. 34:3372-3378. [Google Scholar]
- 45.Rohrlack, T., and H. Utkilen. 2007. Effects of nutrient and light availability on production of bioactive anabaenopeptins and microviridin by the cyanobacterium Planktothrix agardhii. Hydrobiologia 583:231-240. [Google Scholar]
- 46.Sivonen, K., and G. Jones. 1999. Cyanobacterial toxins, p. 41-111. In I. Chorus and J. Bartram (ed.), Toxic cyanobacteria in water. A guide to their public health consequences, monitoring and management. E. & F. N. Spon, London, United Kingdom.
- 47.So, A. K. S., A. Kassam, and G. S. Espie. 1998. Na+-dependent HCO3− transport in the cyanobacterium Synechocystis PCC6803. Can. J. Bot. 76:1084-1091. [Google Scholar]
- 48.Spassova, M. I., A. G. Mellor, K. A. Petrov, K. A. Beattie, G. A. Codd, H. Vais, and P. N. R. Usherwood. 1995. Pores formed in lipid bilayers and in native membranes by nodularin, a cyanobacterial toxin. Eur. Biophys. J. 24:69-76. [DOI] [PubMed] [Google Scholar]
- 49.Spoof, L., P. Vesterkvist, T. Lindholm, and J. Meriluoto. 2003. Screening for cyanobacterial hepatotoxins, microcystins and nodularin in environmental water samples by reversed-phase liquid chromatography-electrospray ionisation mass spectrometry. J. Chromatogr. A 1020:105-119. [DOI] [PubMed] [Google Scholar]
- 50.Tchernov, D., J. Silverman, B. Luz, L. Reinhold, and A. Kaplan. 2003. Massive light-dependent cycling of inorganic carbon between oxygenic photosynthetic microorganisms and their surroundings. Photosynth. Res. 77:95-103. [DOI] [PubMed] [Google Scholar]
- 51.Tillett, D., E. Dittmann, M. Erhard, H. von Döhren, T. Börner, and B. A. Neilan. 2000. Structural organization of microcystin biosynthesis in Microcystis aeruginosa PCC 7806: an integrated peptide-polyketide synthetase system. Chem. Biol. 7:753-764. [DOI] [PubMed] [Google Scholar]
- 52.Tortell, P. D. 2000. Evolutionary and ecological perspective on carbon acquisition in phytoplankton. Limnol. Oceanogr. 45:744-750. [Google Scholar]
- 53.Utkilen, H., and N. Gjølme. 1992. Toxin production by Microcystis aeruginosa as a function of light in continuous cultures and its ecological significance. Appl. Environ. Microbiol. 58:1321-3125. [DOI] [PMC free article] [PubMed] [Google Scholar]
- 54.Wiedner, C., P. M. Visser, J. Fastner, J. S. Metcalf, G. A. Codd, and L. R. Mur. 2003. Effects of light on the microcystin content of Microcystis strain PCC 7806. Appl. Environ. Microbiol. 69:1475-1481. [DOI] [PMC free article] [PubMed] [Google Scholar]
- 55.Woodger, F. J., M. R. Badger, and G. D. Price. 2005. Sensing of inorganic carbon limitation in Synechococcus PCC7942 is correlated with the size of the internal inorganic carbon pool and involves oxygen. Plant Physiol. 139:1959-1969. [DOI] [PMC free article] [PubMed] [Google Scholar]
- 56.Young, F. M., C. Thomson, J. S. Metcalf, J. M. Lucocq, and G. A. Codd. 2005. Immunogold localisation of microcystins in cryosectioned cells of Microcystis. J. Struct. Biol. 151:208-214. [DOI] [PubMed] [Google Scholar]
- 57.Zehnder, A., and P. R. Gorham. 1960. Factors influencing the growth of Microcystis aeruginosa Kütz. emend. Elenkin. Can. J. Microbiol. 6:645-660. [DOI] [PubMed] [Google Scholar]