Abstract
Biofilms are complex and dynamic communities of microorganisms that are studied in many fields due to their abundance and economic impact. Biofilm thickness is an important parameter in biofilm characterization. Current methods of measuring biofilm thicknesses have several limitations, including application, availability, and costs. Here, we present low-load compression testing (LLCT) as a new method for measuring biofilm thickness. With LLCT, biofilm thicknesses are measured during compression by inducing small loads, up to 5 Pa, corresponding to 0.1% deformation, making LLCT essentially a nondestructive technique. Comparison of the thicknesses of various bacterial and yeasts biofilms obtained by LLCT and by using confocal laser scanning microscopy (CLSM) resulted in the conclusion that CLSM underestimates the biofilm thickness due to poor penetration of different fluorescent dyes, especially through the thicker biofilms, whereas LLCT does not suffer from this thickness limitation.
Biofilms are microbial communities consisting of microorganisms surrounded by an extracellular polymeric matrix. Biofilms are a preferred way of microbial existence as they provide protection against existing physical forces and chemical attack, if necessary. Formation of a biofilm is desirable in some cases (wastewater treatment, biochemical production), whereas in other cases it poses severe problems (marine equipment fouling, biomaterial-related infections). Being able to quantitatively describe biofilms, for instance, in terms of volume, wet weight, number of species present, or thickness, allows for better systems engineering and reduction in damage and operational costs. Biofilm thickness is especially important for calculation of heat exchange or diffusion rates of antimicrobials or nutrients through a biofilm (4, 15) and for evaluation of the mechanical properties of a biofilm (9, 10).
Several destructive and nondestructive methods are available for biofilm thickness measurement. Destructive methods, such as scanning electron microscopy (5) and cryoembedding (2), require extensive dehydration or freezing, leaving the biofilm unsuitable for any further measurements. Additionally, dehydration may lead to underestimation of the biofilm thickness due to shrinkage. The nondestructive optical methods available are light microscopy (1), a scanner with an image acquisition system (13), a laser triangulation sensor (14), confocal laser scanning microscopy (CLSM) (16), and two-photon excitation microscopy (17), which uses visible, laser, or infrared light to elucidate the three-dimensional structure of a biofilm. For light microscopy, the refractive index of a biofilm is required, which is mostly assumed to be the refractive index of water (1). However, the accuracy of this method suffers when thick and dense biofilms with low water contents are examined. Application of the scanner method is limited to biofilms that are 100 μm or less thick because it is difficult to obtain reliable measurements for thicker biofilms without destroying them (13). Furthermore, thickness measurements obtained with light microscopic techniques were used to calibrate the scanner method, introducing possible errors. The laser triangulation sensor is a fast and nondestructive instrument to evaluate biofilm thickness, but significant measurement errors are possible due to the presence of a film of water on the biofilm surface, leading to the presence of stray light from the deeper layers of the biofilm. Optical techniques, such as CLSM, requiring staining of the biofilm with fluorescent dyes are limited by the (in)ability of the dyes to penetrate into the biofilm and are subject to a fluorescent bleaching of a sample. Good-quality CLSM images are possible only for biofilms up to about 70 μm thick (7). Two-photon excitation microscopy allows imaging of biofilms that are up to 350 μm thick due to improved spatial localization, deeper sectioning of the samples, and reduced fluorescent bleaching (8). However, two-photon excitation microscopy remains expensive. Magnetic resonance imaging (12) is another nondestructive technique, but it also requires elaborate setup and expertise. Therefore, there is a need for a simple, nondestructive, accurate, and inexpensive method to measure biofilm thickness.
In this study we describe a new mechanical method to measure biofilm thickness nondestructively. The method is based on a principle of uniaxial compression, and the device used is called a low-load compression tester (LLCT). This device is relatively simple and inexpensive and can be assembled in-house. It consists of a linear positioning stage and an electronic analytical balance fixed on a stable granite base and interfaced to a computer for control, signal acquisition, and data analysis. During measurement, the biofilm is kept in its physiological, hydrated state, which is one of the main advantages of the method, and the force induced on the biofilm while it is squeezed during uniaxial compression is recorded by the acquisition system.
We considered a wide variety of yeast and bacterial biofilms to measure thicknesses by the new LLCT method. The thickness values obtained with LLCT were compared with values obtained with CLSM. For CLSM analysis, bacterial and yeast biofilms were stained with LIVE/DEAD BacLight, FUN1, and calcofluor white, and images were obtained over the depth of the biofilm. Images were analyzed with COMSTAT software (7) to determine the biofilm thickness and the maximum depth to which the CLSM technique can be applied.
MATERIALS AND METHODS
Microbial strains, growth conditions, and harvesting.
Streptococcus oralis J22, Pseudomonas aeruginosa SG81, and Enterococcus faecalis BS385 and BS1037 (3, 9, 18) grown on blood agar plates were used to inoculate 10 ml growth medium (Table 1) and were grown for 24 h at 37°C in ambient air. These cultures were used to inoculate 200-ml main cultures, which were grown for 16 h. Cells were harvested by centrifugation and washed twice with sterile buffer (Table 1). S. oralis J22 forms chains and aggregates, and hence these bacteria were sonicated on ice for 30 s at 30 W (model 375 Vibra cell; Sonics and Materials Inc., Danbury, CT). Cooling on ice was used to ensure that the cells did not lyse. Following centrifugation and sonication, bacteria were resuspended in buffer for further use.
TABLE 1.
Growth and harvesting conditions, suspending liquid, and suspension density for the microbial strains used in this study
| Microorganism(s) | Growth medium | Centrifugation | Buffer | Suspension density (cells/ml) |
|---|---|---|---|---|
| S. oralis J22 | Todd-Hewitt broth (Oxoid, Basingstoke, United Kingdom) | 10,000 × g, three times for 5 min, 10°C | Adhesion buffer (3.73 g/liter KCl, 0.174 g/liter K2HPO4, 0.136 g/liter KH2PO4, 0.147 g/liter CaCl2·2H2O; pH 6.8) | 3 × 10⁸ |
| P. aeruginosa SG81 | Pseudomonas isolation broth (20 g/liter Bacto peptone, 10 g/liter K2SO4, 1.4 g/liter MgCl2·6H2O, 0.025 g/liter Triclosan, 25.2 g/liter glycerol; pH 7.0) | 10,000 × g, three times for 5 min, 10°C | 0.14 M NaCl | 2 × 10⁸ |
| E. faecalis BS385 and BS1037 | TSB (Oxoid, Basingstoke, United Kingdom) | 6,500 × g, three times for 5 min, 10°C | 10 mM potassium phosphate buffer (0.87 g/liter K2HPO4, 0.68 g/liter KH2PO4) | 3 × 10⁸ |
| C. albicans SC5314, MB02, and MB10 | TSB (Oxoid, Basingstoke, United Kingdom); for biofilm growth, yeast nitrogen base (Difco) without amino acids (Becton Dickinson, Sparks, MD) | 5,000 × g, once for 10 min, 10°C | Phosphate-buffered saline (8.76 g/liter NaCl, 0.87 g/liter K2HPO4, 0.68 g/liter KH2PO4; pH 7.0) | 1 × 10⁷ |
Candida albicans MB02, MB10 (11), and SC5314 (ATCC MYA-2876) grown on tryptic soy broth (TSB) (Oxoid, Basingstoke, United Kingdom) agar plates were used to inoculate 10-ml batch cultures, which were grown at 30°C for 16 h in ambient air with shaking at 120 rpm. Yeast cells were harvested by centrifugation, washed once with sterile buffer, and resuspended in buffer. The growth medium, buffer, centrifugation details, and resuspension densities are summarized in Table 1.
Biofilm growth.
Biofilms were grown using three different methods. First, S. oralis J22 and P. aeruginosa SG81 biofilms were grown at a solid-liquid interface in a parallel plate flow system under constant shear conditions (3). A parallel plate flow chamber (17.5 by 1.6 by 0.075 cm) was used to grow biofilms on glass slides (Menzel-Glaser, Germany). A microbial suspension was perfused through the system under hydrostatic pressure in order to create a pulse-free flow, as described previously in detail (3). The flow chamber and glass slides were washed with a detergent (2% RBS 35; Omnilabo, Breda, The Netherlands), thoroughly rinsed with tap water and demineralized water, and sterilized by autoclaving. A flow was started by passing adhesion buffer (for S. oralis J22) or 0.14 M NaCl (for P. aeruginosa SG81) for 0.5 h at a shear rate of 7.3 s−1 so that the temperature (37°C) and flow could stabilize. The bacterial suspension was then allowed to pass through the flow chamber until the surface coverage on the bottom glass plate was 1 × 10⁶ cells cm−2. The flow chamber was again rinsed for 0.5 h with adhesion buffer in order to remove nonadhering bacteria. Growth medium was then introduced into the system (10% Todd-Hewitt broth in adhesion buffer for S. oralis J22; 10% pseudomonas isolation broth in 0.14 M NaCl for P. aeruginosa SG81) at the same shear rate (7.3 s−1). The cultures were allowed to grow at 37°C for 36 h (S. oralis) and 64 h (P. aeruginosa) to form biofilms. The flow chambers were rinsed with buffer before the glass slides with biofilms were removed.
As a second way of growing biofilms at the solid-liquid interface, E. faecalis BS385, E. faecalis BS1037, and C. albicans biofilms were grown on polymethylmethacrylate (PMMA) slides (1.5 by 1.5 cm) in six-well tissue culture plates. Before Candida biofilms were grown, the slides were coated with 50% fetal bovine serum for at least 30 min to enhance adhesion (11), washed once with phosphate-buffered saline, and placed into wells. Three milliliters of a microbial suspension was added to each well, and the cells were allowed to adhere at 37°C while the preparations were rotated at 60 rpm. The microbial suspensions were removed after 1.5 h, and the slides were washed with buffer. Biofilms were grown by adding to each well 3 ml of TSB with 0.5% (wt/vol) glucose (E. faecalis) or 3 ml of yeast nitrogen base with 50 mM glucose (pH 7.0) (C. albicans) and incubating the slides at 37°C for 48 h (E. faecalis) or for 16 to 72 h (C. albicans), also with rotation (60 rpm). Afterwards, the medium was discarded, and the biofilms were washed once with buffer.
In the last method used to generate biofilms, P. aeruginosa SG81, E. faecalis BS385, E. faecalis BS1037, and S. oralis J22 biofilms were grown statically at the solid-air interface on a Millipore filter (HTTP04700) with a pore size of 0.45 μm. For P. aeruginosa SG81, 1 ml of a bacterial solution with density of 1 × 10⁸ cells ml−1 was filtered through a sterile filter. The membrane filter covered with bacteria was placed on the surface of a pseudomonas isolation broth agar plate. After incubation for 24 h at 37°C, a confluent and mucoid bacterial lawn was obtained on the surface of the membrane filter. For E. faecalis BS385, E. faecalis BS1037, and S. oralis J22, suspensions were diluted to obtain a concentration of 3 × 10⁸ cells ml−1, and 10 ml was filtered through the membrane filter. The filters covered with bacteria were placed on TSB agar plates and incubated for 72 h at 37°C.
CLSM analysis.
All images were acquired with a Leica TCS SP2 confocal laser scanning microscope (Leica Microsystems Heidelberg GmbH, Heidelberg, Germany) with beam path settings for fluorescein isothiocyanate- and tetramethyl rhodamine isothiocyanate-like labels. Stacks of images were obtained with a 40× water objective lens. For imaging bacterial biofilms, biofilms were stained with LIVE/DEAD BacLight stain (Molecular Probes, Eugene, OR) and incubated at room temperature in the dark for 15 min. Yeast biofilms were stained with FUN1 (Molecular Probes Eugene, OR) viability stain and calcofluor white (Sigma, St. Louis, MO) and incubated at room temperature in the dark for 45 min according to the manufacturer's staining protocol. In addition to FUN1 and calcofluor white, C. albicans SC5314 biofilms were also stained with the LIVE/DEAD BacLight stain. The images were analyzed by using COMSTAT software (7). For COMSTAT analysis, CLSM files were converted into TIF format and manually thresholded by a user in order to convert color images into black and white images, which could be analyzed by COMSTAT software to obtain the mean biofilm thickness from the stacks of images.
LLCT analysis.
Biofilm thicknesses were measured with an LLCT, as schematically shown in Fig. 1. The LLCT apparatus consists of a linear positioning stage (Intellistage M-511.5IM; Physik instrumente, Karlsruhe, Germany) connected to a cylindrical moving upper plate with a diameter of 2.5 mm. A bottom stationary plate is fixed to an automatic force-compensating balance, shown in Fig. 1 as a load cell (SW 50/300; Wipotec, Kaiserslautern, Germany). Both the load cell and the linear positioning stage were interfaced to a personal computer for data acquisition and control using LabVIEW 7.1 software. The movement of the top plate and the force registered by the load cell were stored in a text file for analysis by MS Excel. During measurement, the substratum with a biofilm was carefully placed on the bottom plate and the top plate was moved downward until it touched an area of the substratum from which the biofilm had been removed with a tissue. The resulting height was recorded as the bottom of the biofilm. In the second step, the top plate was moved laterally over an area of the substratum containing biofilm and then moved downward until it touched the biofilm surface, and the resulting height was recorded as well. Subsequently, biofilm thickness was calculated from the difference between the two heights. “Touch” of the biofilm surface was considered to occur during the top plate's downward motion when the load increased above a predefined value. To prevent the biofilms from drying out, thicknesses were measured immediately after growth. Additionally, the apparatus was enclosed in a box to minimize evaporation.
FIG. 1.
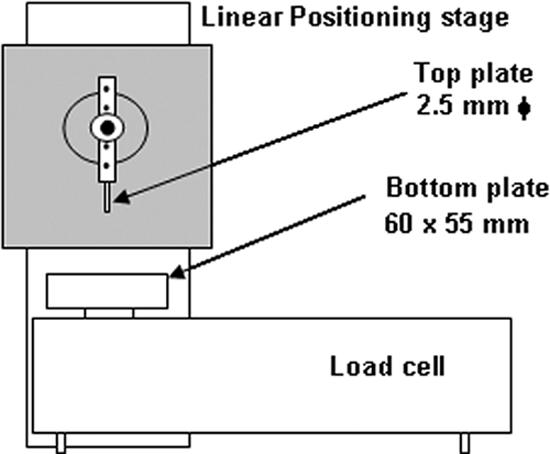
Frontal view of the LLCT, showing the main components of the system.
RESULTS
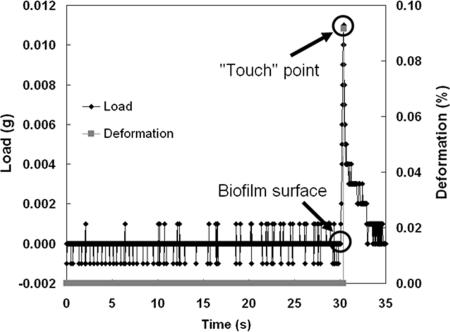
During measurement with the LLCT, the upper cylindrical plate moves toward the bottom stationary plate holding the substratum and biofilm at a speed of 1 μm s−1. During approach, the load on the plate is registered by the force-compensating balance connected to the bottom plate and is essentially zero until the plate touches the biofilm surface, at which point the load starts increasing. As soon as the predefined touch load value, 0.01 g (see below), is registered, movement of the upper cylindrical plate is stopped and the plate is withdrawn to avoid damaging the biofilm. Typical data output for the soft surface of a biofilm are shown in Fig. 2 and include the load measured by the force-compensating balance during the uniaxial compression and deformation inflicted on a biofilm. The biofilm thicknesses derived and their reproducibility depend on correct definition of the touch load value.
FIG. 2.
Example of data output during biofilm thickness measurement, with load and deformation values.
A touch load value of 0.01 g was chosen because at that load interference from the background noise and lateral displacement of water through the biofilm could be avoided and the deformation of the biofilm due to compression (i.e., the fractional change in biofilm thickness from initial contact at the touch load value used) was generally less than 0.l%, as shown in Fig. 2. Moreover, a touch load of 0.01 g yielded good reproducibility of the heights measured, and 10 repeated measurements for the same spot of a cleaned substratum were identical within 0.08 μm. Based on the results described above, a touch load value of 0.01 g was used throughout the remainder of this study for determination of biofilm thickness.
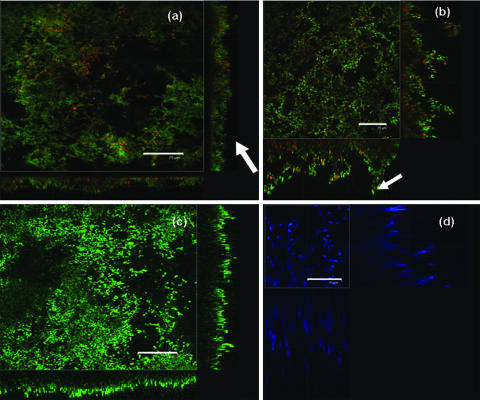
To demonstrate the applicability of LLCT to various types of biofilms, different growth conditions were used. For all conditions, the biofilm thicknesses derived from LLCT as described above were compared with CLSM evaluations of biofilm thickness. Figure 3 shows CLSM images of bacterial and yeast biofilms used in this study. The images show heterogeneities in the surface coverage and thickness of the biofilms grown under different conditions. The biofilm cross sections show that biofilms grown under constant shear conditions were carpet-like (Fig. 3a), whereas biofilms grown with rotation contained mushroom-like structures and flow channels (Fig. 3b). Bacterial biofilms were considerably thinner than yeast biofilms. Dye penetration was complete through bacterial biofilms, as shown in Fig. 3a and 3b, and incomplete through yeast biofilms, as shown by the absence of a defined border between the yeast biofilms and the substratum in Fig. 3c and 3d.
FIG. 3.
Confocal images of biofilms. Scale bars = 75 μm. (a) S. oralis J22 grown in a flow chamber stained with LIVE/DEAD BacLight bacterial viability stain. The arrow indicates carpet-like structures. (b) E. faecalis BS1037 grown on PMMA stained with LIVE/DEAD BacLight bacterial viability stain. The arrow indicates mushroom-like structures. (c) C. albicans SC5314 grown on PMMA stained with FUN1 yeast viability stain. (d) C. albicans SC5314 grown on PMMA stained with calcofluor white, demonstrating the heterogeneous spatial distribution of the biofilms in the x-z and y-z directions and the limited stain penetration in yeast biofilms.
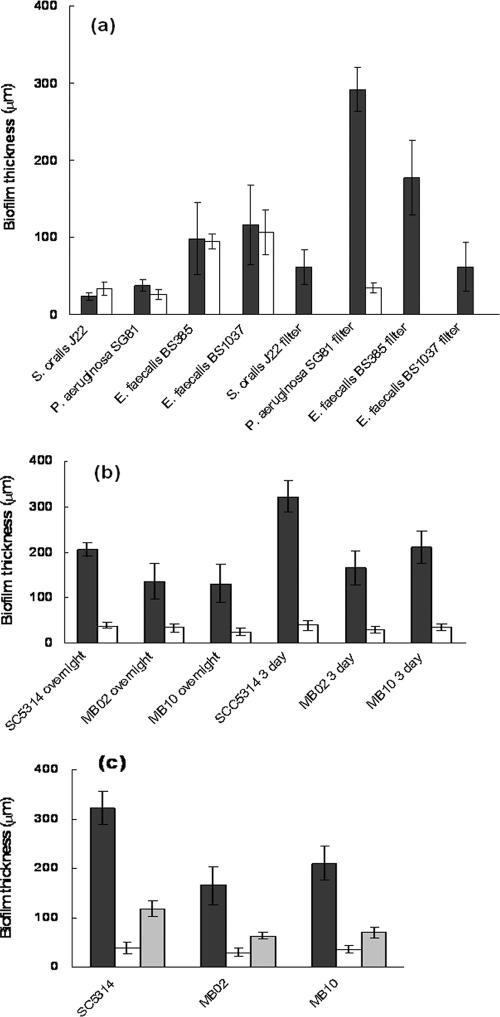
LLCT and CLSM thickness measurements were first compared for relatively thin S. oralis J22 biofilms, P. aeruginosa SG81 biofilms grown in a parallel plate flow chamber, and E. faecalis BS385 and BS1037 biofilms grown in tissue culture plates on PMMA with rotation. The average thicknesses of these bacterial biofilms were between 23 and 117 μm as determined by LLCT, while they ranged from 26 to 106 μm as determined by CLSM (Fig. 4a), which does not represent a statistically significant difference (P > 0.5, two-tailed Student's t test).
FIG. 4.
(a) Thicknesses of bacterial biofilms measured with LLCT (filled bars) and CLSM (open bars) after LIVE/DEAD BacLight staining for CLSM. (b) Thicknesses of yeast biofilms measured with LLCT (filled bars) and CLSM (open bars) after FUN1 staining. (c) Comparison of biofilm thicknesses for C. albicans strains measured with LLCT (filled bars) and with CLSM after staining with FUN1 (open bars) and calcofluor white (shaded bars).
Second, the thicknesses of yeast biofilms grown in tissue culture plates on PMMA with rotation were compared. The thicknesses of overnight and 3-day-old C. albicans SC5314, MB02, and MB10 biofilms ranged from 132 to 322 μm when they were measured with the LLCT, but they were significantly (P < 0.00001, two-tailed Student's t test) less (between 25 and 40 μm) when they were measured by CLSM after staining with FUN1 (Fig. 4b and c).
Finally, the thicknesses of biofilms grown at solid-air interfaces instead of solid-liquid interfaces as described above were compared for P. aeruginosa SG81, E. faecalis BS385 and BS1037, and S. oralis J22 biofilms. The thicknesses measured using LLCT ranged from 61 to 292 μm. CLSM analysis was possible only for the biofilms of P. aeruginosa SG81, as the solid-air-grown biofilms disintegrated upon application of the fluorescent dye. CLSM measurements showed that the biofilms of P. aeruginosa SG81 were only 34 μm thick, which was significantly less than the value obtained by LLCT.
To determine the influence of fluorescent dyes and their penetration through yeast biofilms on CLSM biofilm thickness measurements, FUN1, LIVE/DEAD BacLight, and calcofluor white (6) were used. C. albicans SC5314, MB02, and MB10 biofilms grown for 3 days on PMMA with a rotating fluid flow were 30 to 40 μm thick as determined by CLSM when they were stained with FUN1 and 64 to 120 μm thick when they were stained with calcofluor white. On average, the thicknesses of C. albicans SC5314 biofilms stained with LIVE/DEAD BacLight were 100 μm as determined by CLSM. LLCT measurements, however, indicated that the biofilms were significantly thicker (P < 0.05, Student's t test).
DISCUSSION
We developed a new, nondestructive method for measuring biofilm thicknesses, based on LLCT, which has several advantages over currently available techniques, such as CLSM analysis. Figure 5 compares all biofilm thicknesses measured using LLCT with those obtained by CLSM. For the bacterial biofilms less than 120 μm thick, there were no statistically significant differences in the thicknesses measured and the data points were distributed close to the line of identity, but for yeast biofilms, CLSM underestimated the biofilm thickness compared with LLCT, regardless of the fluorescent dye used.
FIG. 5.
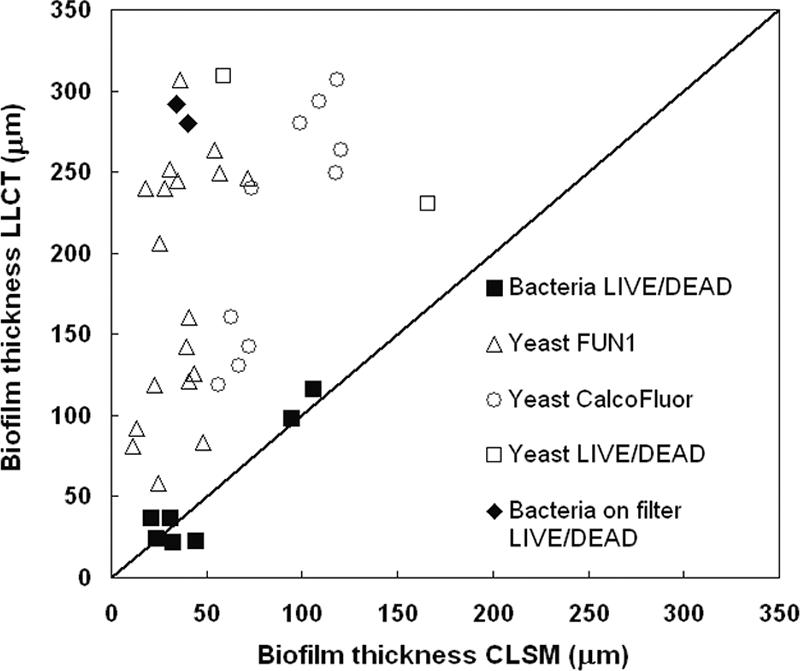
Biofilm thicknesses measured using LLCT as a function of the thicknesses determined by CLSM.
The major advantage of the new method over CLSM is that it has no depth limitation and can be used for measuring a wide range of biofilm thicknesses, making it a superior technique compared to microscopy, where dye penetration, the depth of focus, and photobleaching limit application. Additionally, LLCT is more reliable because microscopy-based techniques suffer from observer bias in image selection. LLCT allows analysis of an area almost 2 orders of magnitude larger than the area that can be analyzed by microscopic methods, which leads to more accurate determination of biofilm thickness.
In comparison with other methods that are currently available for measuring biofilm thicknesses, LLCT also offers several advantages. First, the biofilm is kept in its physiological, hydrated state during measurement and is left intact for further studies because the compression during the tests is limited to less than 0.1% deformation. Second, the method can be used to measure thicknesses of biofilms grown on solid-air interfaces, where application of a dye destroys biofilm architecture, which impedes CLSM imaging. Third, the measurements are not as time- and labor-intensive as other methods, such as cryoembedding or the laser triangulation sensor, and the results are available almost instantaneously. Fourth, the measurements obtained with LLCT are highly reproducible, since the differences between measurements for the same spot were less than 0.08 μm, which is significantly less than the thickness of most biofilms. The last major advantage is the relatively low cost of the system compared to other systems used, such as magnetic resonance imaging or CLSM.
Footnotes
Published ahead of print on 31 August 2007.
REFERENCES
- 1.Bakke, R., R. Kommedal, and S. Kalvenes. 2001. Quantification of biofilm accumulation by optical approach. J. Microbiol. Methods 44:13-26. [DOI] [PubMed] [Google Scholar]
- 2.Battin, T. J., L. A. Kaplan, J. D. Newbold, X. Cheng, and C. Hansen. 2003. Effects of current velocity on the nascent architecture of stream microbial biofilms. Appl. Environ. Microbiol. 69:5443-5452. [DOI] [PMC free article] [PubMed] [Google Scholar]
- 3.Busscher, H. J., and H. C. van der Mei. 2006. Microbial adhesion in flow displacement systems. Clin. Microbiol. Rev. 19:127-141. [DOI] [PMC free article] [PubMed] [Google Scholar]
- 4.Costerton, J. W., P. S. Stewart, and E. P. Greenberg. 1999. Bacterial biofilms: a common cause of persistent infections. Science 284:1318-1322. [DOI] [PubMed] [Google Scholar]
- 5.Donlan, R. M., and J. W. Costerton. 2002. Biofilms: survival mechanisms of clinically relevant microorganisms. Clin. Microbiol. Rev. 15:167-193. [DOI] [PMC free article] [PubMed] [Google Scholar]
- 6.Henry-Stanley, M. J., R. M. Garni, and C. L. Wells. 2004. Adaptation of FUN-1 and Calcofluor white stains to assess the ability of viable and nonviable yeast cells to adhere to and to be internalized by cultured mammalian cells. J. Microbiol. Methods 59:289-292. [DOI] [PubMed] [Google Scholar]
- 7.Heydorn, A., A. T. Nielsen, M. Hentzer, C. Sternberg, M. Giskov, B. K. Ersboll, and S. Molin. 2000. Quantification of biofilm structures by the novel computer program COMSTAT. Microbiology 146:2395-2407. [DOI] [PubMed] [Google Scholar]
- 8.Hu, Z., G. Hidalgo, P. L. Houston, A. G. Hay, M. L. Shuler, H. D. Abruna, W. C. Ghiorse, and L. W. Lion. 2005. Determination of spatial distributions of zinc and active biomass in microbial biofilms by two-photon laser scanning microscopy. Appl. Environ. Microbiol. 71:4014-4021. [DOI] [PMC free article] [PubMed] [Google Scholar]
- 9.Korstgens, V., H. C. Flemming, J. Wingender, and W. Borchard. 2001. Influence of calcium ions on the mechanical properties of a model biofilm of mucoid Pseudomonas aeruginosa. Water Sci. Technol. 13:49-57. [PubMed] [Google Scholar]
- 10.Korstgens, V., H. C. Flemming, J. Wingender, and W. Borchard. 2001. Uniaxial compression measurement device for investigation of the mechanical stability of biofilms. J. Microbiol. Methods 46:9-17. [DOI] [PubMed] [Google Scholar]
- 11.Krom, B. P., J. B. Cohen, G. E. McElhaney Feser, and R. L. Cihlar. 2007. Optimized candidal biofilm microtiter assay. J. Microbiol. Methods 68:421-423. [DOI] [PubMed] [Google Scholar]
- 12.Manz, B., F. Volke, D. Goll, and H. Horn. 2003. Measuring local flow velocities and biofilm structure in biofilm systems with magnetic resonance imaging (MRI). Biotechnol. Bioeng. 84:424-432. [DOI] [PubMed] [Google Scholar]
- 13.Milferstedt, K., M. N. Pons, and E. Morgenroth. 2006. Optical method for long-term and large-scale monitoring of spatial biofilm development. Biotechnol. Bioeng. 94:773-782. [DOI] [PubMed] [Google Scholar]
- 14.Okkerse, W. J., S. P. Ottengraf, and B. Osinga-Kuipers. 2000. Biofilm thickness variability investigated with a laser triangulation sensor. Biotechnol. Bioeng. 70:619-629. [DOI] [PubMed] [Google Scholar]
- 15.Stewart, P. S. 2003. Diffusion in biofilms. J. Bacteriol. 185:1485-1491. [DOI] [PMC free article] [PubMed] [Google Scholar]
- 16.Stoodley, P., J. D. Boyle, D. DeBeer, and H. M. Lappin-Scott. 1999. Evolving perspectives of biofilm structure. Biofouling 14:75-90. [Google Scholar]
- 17.Vroom, J. M., K. J. De Grauw, H. C. Gerritsen, D. J. Bradshaw, P. D. Marsh, G. K. Watson, J. J. Birmingham, and C. Allison. 1999. Depth penetration and detection of pH gradients in biofilms by two-photon laser scanning microscopy. Appl. Environ. Microbiol. 65:3502-3511. [DOI] [PMC free article] [PubMed] [Google Scholar]
- 18.Waar, K., A. B. Muscholl-Siberhorn, R. J. L. Willems, M. J. H. Slooff, H. J. M. Harmsen, and J. E. Degener. 2002. Genogrouping and incidence of virulence factors of Enterococcus faecalis in liver transplant patients differ from blood culture and fecal isolates. J. Infect. Dis. 185:1121-1127. [DOI] [PubMed] [Google Scholar]


