Abstract
Cell proliferation and alpha-toxin gene expression of Clostridium perfringens in relation to the development of necrotic enteritis (NE) were investigated. Unlike bacitracin-treated chickens, non-bacitracin-treated birds exhibited typical NE symptoms and reduced growth performance. They also demonstrated increased C. perfringens proliferation and alpha-toxin gene expression that were positively correlated and progressed according to the regression model y = b0 + b1X − b2X2. The average C. perfringens count of 5 log10 CFU/g in the ileal digesta appears to be a threshold for developing NE with a lesion score of 2.
Necrotic enteritis (NE) is an enteric disease in poultry caused predominantly by Clostridium perfringens type A strains and to a lesser extent type C strains (6, 13, 19). Type A strains produce only alpha-toxin as the major toxin, and alpha- and beta-toxins are the two major toxins produced by type C strains (19). The disease is thought to occur when a pathogenic strain of C. perfringens, which is normally part of intestinal microbiota, overgrows in the small intestine and produces extracellular toxins that damage the intestine (9, 12, 18). NE can appear in 2- to 5-week-old broilers (7), but outbreaks typically happen around 17 to 18 days of age (17). Although substantial evidence supports the role of alpha-toxin in the pathogenesis of NE (1, 2, 8), a recent report with alpha-toxin-defective mutants has questioned the importance of alpha-toxin (10). Therefore, more studies are required to clarify the importance of alpha-toxin and other factors in NE pathogenesis. The present study was undertaken to quantify the relationship between cell proliferation and alpha-toxin gene expression of C. perfringens in the development of NE. To this end, a specific quantitative PCR assay, including reverse transcription (RT) and real-time PCR (Q-RT-PCR), was developed to measure alpha-toxin gene expression, and an experimental model for chicken infection with C. perfringens (3, 4, 5) was used.
Bacteria.
A type A strain of C. perfringens routinely used to induce NE in broiler chickens at Nutreco Canada Agresearch by following an established NE infection model (3) was used for this study. The bacterium was grown in Mueller-Hinton broth or on Mueller-Hinton agar containing 5% (vol/vol) sheep blood at 37°C under an anaerobic atmosphere (85% N2, 10% CO2, and 5% H2). Escherichia coli DH5α harboring plasmid pGEM-T with an alpha-toxin gene (cpa) from type A C. perfringens strain D32124 was from J. Prescott (University of Guelph, Guelph, Canada).
Chicken trial.
Broiler chickens (Ross × Ross) were reared by following the guidelines of the Canadian Council on Animal Care (15). Six-hundred-day-old chicks in 12 pens (50 birds/pen) were assigned in equal proportions to one of two dietary treatments: (i) a typical all-vegetable starter diet (Shur-Gain; Nutreco Canada) with zinc bacitracin (55 mg/kg) or (ii) the same diet without bacitracin. The first day of the trial was designated day 0. On day 18, birds were challenged for 16 h with C. perfringens (107 CFU/ml) through the diet after 8 h of starvation (3). Before the challenge, 12 birds from each treatment group (two birds/pen) were randomly selected and euthanized with CO2. The sampling was repeated after the challenge for 4 days (days 19 to 22). Ileal digesta were collected from each bird. Digesta (0.25 g) for RNA extraction was mixed, immediately after dissection, with 1.75 ml RNAlater (Ambion, Austin, TX) and stored on ice for subsequent processing. NE lesion in the small intestine was monitored and scored for the last 3 days (days 20 to 22) of the trial as described elsewhere (16). Chicken growth performance, including body weight and feed intake, was recorded weekly prior to clostridial challenge and daily after the challenge. C. perfringens in the digesta was enumerated by plating (12).
RNA preparation.
Each digesta sample in RNAlater was aliquoted into two Eppendorf tubes (1 ml each), and the volume was brought to 2 ml with phosphate-buffered saline buffer (pH 7.4). The digesta were recovered by centrifugation (20,000 relative centrifugal force, 20 min), quickly frozen in liquid nitrogen, and then stored at −80°C until extraction. Total RNA was extracted from ileal digesta with a RiboPure bacterial RNA isolation kit (Ambion) according to the manufacturer's instructions except for using 1 ml of lysis buffer in each tube, the application of bead beating to lyse bacterial cells as described previously (11), and two chloroform extractions during RNA preparation. RNA extract was purified using a Turbo DNA-free kit (Ambion).
Q-RT-PCR.
cDNA was synthesized from 0.5 μg purified RNA using a Retroscript reverse transcription kit (Ambion). cDNAs were verified by PCR with cpa-specific primers (14) and eubacterial universal primers (21).
Real-time PCR was performed on a Stratagene MX4000 thermal cycler with brilliant SYBR green Q-PCR Master Mix (Stratagene, La Jolla, CA). Previously published C. perfringens cpa gene-specific primers (cpaF, GCTAATGTTACTGCCGTTGA; cpaR, CCTCTGATACATCGTGTAAG) (14) were experimentally evaluated and used for real-time PCR. cDNA samples were diluted 10-fold, and 1 μl of each diluted sample (containing cDNAs equivalent to 2.5 ng of total RNA) was added in a 25-μl reaction mixture which contained 1× Master Mix, 150 nM of each primer, and 30 nM ROX (6-carboxy-X-rhodamine). The program was 10 min at 95°C, then 40 cycles of 95°C for 30 s, 56°C for 30 s, and 72°C for 30 s, and finally 2 min at 72°C. Fluorescence was measured after each annealing. Recombinant cpa in a linear range from 102 to 109 copies was included as a standard in each run. To mimic digesta samples, the standards also included the same amount of cDNAs generated from samples with no C. perfringens colony counts. Tests of samples and standards were repeated three times and arranged on different well positions of the plates. The standard curves were generated by plotting threshold cycles of the standards against log10 copy numbers of cpa using GraphPad Prism version 4 (GraphPad Software Inc., San Diego, CA). The amplification efficiency was calculated as −1 + 10(−1/slope) (20).
Statistical analyses.
Statistical analyses, including t test, correlation analysis, and polynomial regression modeling (y = b0 + b1X + b2X2, where y is the colony count or the copy number and X is days postchallenge) were performed using statistical software (SAS version 8.00; SAS Institute Inc., Cary, NC). Since NE score is a discrete variable, effects of the colony counts and the copy numbers on development of NE lesions were analyzed by a logistic proportional odds model according to the SAS logistic procedure.
Animal growth.
Two birds in the non-bacitracin-treated group died following clostridial challenge. Significant differences (P < 0.05) were observed only in average daily gain, average daily feed intake, and feed conversion ratio of postchallenge birds between bacitracin-treated and untreated groups; in these categories, untreated birds demonstrated a reduction in performance (Table 1).
TABLE 1.
Effect of bacitracin on body weight, daily gain, daily feed intake, and feed conversion ratio of pre- and postchallenge chickensa
| Dietb | Body wt (kg)
|
Avg daily gain (kg)
|
Avg daily feed intake (kg)
|
Feed conversion ratio
|
||||||||
|---|---|---|---|---|---|---|---|---|---|---|---|---|
| Day 0c | Day 17d | Day 22e | Prech | Postch | Overall | Prech | Postch | Overall | Prech | Postch | Overall | |
| Nonmedicated | 0.045 | 0.573 | 0.786 | 0.031 | 0.053 | 0.035 | 0.047 | 0.103 | 0.075 | 1.436 | 1.617 | 1.484 |
| Medicated | 0.045 (0.440) | 0.560 (0.110) | 0.794 (0.400) | 0.030 (0.110) | 0.059 (0.010) | 0.036 (0.410) | 0.047 (0.160) | 0.109 (0.010) | 0.078 (0.069) | 1.454 (0.011) | 1.532 (0.009) | 1.476 (0.340) |
Each of the data was generated from six replicates (pens). Values in parentheses are P values; P values equal to or less than 0.05 are considered significant. Prech, prechallenge; Postch, postchallenge.
The nonmedicated diet contained no antibiotics, while the medicated diet contained zinc bacitracin at 55 mg/kg.
The day that the chicken trial started (after hatch).
The day before Clostridium challenge (challenge was performed on day 18).
The last day of the chicken trial.
C. perfringens proliferation and NE lesions.
As summarized in Table 2, 1 and 2 out of 12 birds from bacitracin-treated and untreated groups of chickens, respectively, had barely detectable counts of hemolytic C. perfringens in the ileum on day 0 (i.e., before challenge). Bacitracin in the diet effectively controlled the cell proliferation of C. perfringens and development of NE. However, non-bacitracin-treated chickens demonstrated high incidence and lesion of NE with a high level of C. perfringens counts.
TABLE 2.
Relationships of cell proliferation and alpha-toxin gene expression of C. perfringens in the ileal digesta of chickens on diets with or without bacitracin during the development of NEa
| Diet | Post challenge dayb | No. of infected birdsc | Log CFU/g (avg ± SD)d | No. of birds with lesions | Score (avg ± SD) | Alpha-toxin mRNA (log N/μg; avg ± SD)e |
|---|---|---|---|---|---|---|
| Nonmedicated | 0 | 2 | 0.8 ± 2.0 | ND | ND | 0 |
| 1 | 12 | 7.3 ± 1.7 | ND | ND | 5.1 ± 3.4 | |
| 2 | 10 | 6.7 ± 3.2 | 8 | 1.3 ± 1.0 | 7.4 ± 3.4 | |
| 3 | 10 | 6.2 ± 3.1 | 5 | 0.9 ± 1.2 | 6.2 ± 3.6 | |
| 4 | 6 | 4.1 ± 4.4 | 5 | 0.8 ± 1.0 | 3.7 ± 4.4 | |
| Medicated | 0 | 1 | 0.5 ± 1.8 | ND | ND | 0 |
| 1 | 0 | 0 | ND | ND | 0 | |
| 2 | 1 | 0.4 ± 1.3 | 0 | 0 | 0 | |
| 3 | 2 | 0.8 ± 1.3 | 1 | 0.1 ± 0.3 | 0 | |
| 4 | 3 | 1.1 ± 1.9 | 0 | 0 | 0 |
Samples were collected from 12 birds for each treatment. The nonmedicated diet contained no antibiotics; the medicated diet contained zinc bacitracin (55 mg/kg). ND, not determined; SD, standard deviation.
Chickens were challenged with C. perfringens on day 18. On postchallenge day 0, samples were collected just before the challenge.
Birds were regarded as infected when C. perfringens was detected in the digesta.
Log10 CFU per gram of ileal digesta.
N, copy numbers of alpha-toxin gene mRNA (regarded as 0 when the mRNA was not detected).
Alpha-toxin gene expression.
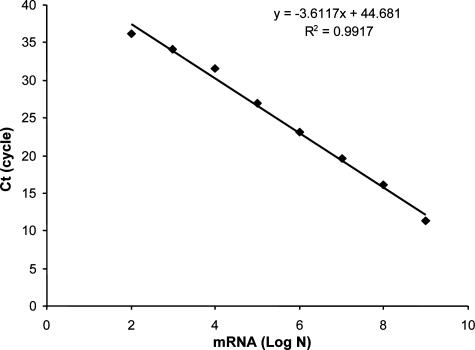
Figure 1 shows a representative standard curve for quantification of cpa mRNA. A linear relationship was found between 102 and 109 copies of the mRNA (r2 = 0.99). The average real-time PCR amplification efficiency summarized from 108 separate runs was 0.92 ± 0.14 (n = 108). The Q-RT-PCR assay demonstrated good reproducibility. The standard deviations from six standard curves ranged from 0.29 to 0.98 in six separate PCR assays (triplicates for each sample) for calibration of cpa mRNA in the digesta RNA samples. The detection limit of the assay with the digesta samples was 100 copies of cpa mRNA molecules per reaction, which is equal to 104 copies/μg total RNA.
FIG. 1.
Representative standard curve showing the relationship between real-time PCR amplification threshold cycle numbers (Ct) and copy numbers of cpa. PCR amplification efficiencies were 0.95. Log N, log10 copy numbers of alpha-toxin gene mRNA.
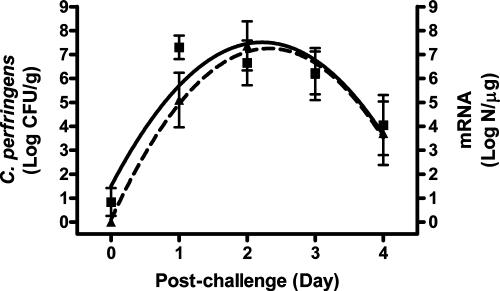
Like C. perfringens proliferation and NE lesion, the expression of cpa was also effectively controlled by bacitracin treatment (Table 2). In non-bacitracin-treated chickens, however, cpa expression increased significantly after the challenge, reached a peak on day 2 postchallenge, and then declined at the end of the trial. Some birds in the same group had no detectable level of cpa mRNA regardless whether they had NE lesions, which led to relatively large standard deviations for gene expression.
Quantitative relationships.
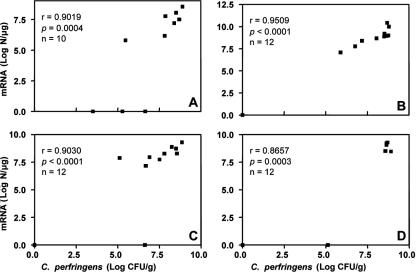
The progress of cell proliferation and cpa expression of C. perfringens in the ilea of non-bacitracin-treated chickens during postchallenge days can be described by a regression model: y = b0 + b1X − b2X2 (Fig. 2). Both cell proliferation and cpa expression demonstrated a progress trend in a parabolic curve. The expression of cpa was behind the cell proliferation during the first 2 days postchallenge but reached the same level at the last day of the trial. The level of cpa expression was positively correlated (P ≤ 0.0004) with the cell proliferation of C. perfringens each day postchallenge (r = 0.87 to 0.95) (Fig. 3). The same positive correlation (P < 0.0001, r = 0.91) was also observed when the data from total 46 birds examined in the last 4 days postchallenge were used.
FIG. 2.
Progress curves of C. perfringens cell proliferation and alpha-toxin gene expression after challenge. Log CFU/g, log10 CFU per gram of ileal digesta (▪); N, copy number of alpha-toxin gene mRNA (▴). The solid line represents colony counts of C. perfringens, generated from a regression model: y = 1.50694 + 5.41067x − 1.21876x2 (r2 = 0.3385, n = 60). The dashed line represents mRNA copy numbers of the alpha-toxin gene, generated from a regression model: y = 0.10793 + 6.15743x − 1.32615x2 (r2 = 0.3709, n = 58). All slopes in the equations are significant (P < 0.0001). Data points are observed mean values with standard deviation bars.
FIG. 3.
Correlation between the cell proliferation and alpha-toxin gene expression of C. perfringens in the ileal digesta of non-bacitracin-treated postchallenge chickens. Panels A through D show data from days 1 through 4 postchallenge, respectively. Log CFU/g, log10 CFU per gram of ileal digesta; N, copy numbers of alpha-toxin gene mRNA; r, Spearman's rank correlation coefficient. Chickens were challenged with C. perfringens on day 18.
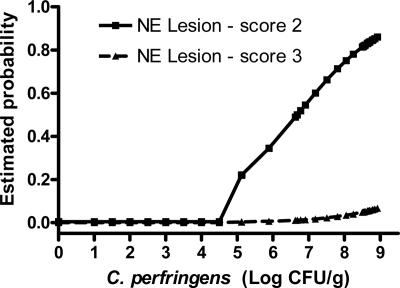
The relationship of the incidence of NE to the level of cpa expression and C. perfringens burden in the ilea of non-bacitracin-treated chickens was also analyzed. While the development of NE lesions was marginally explained by the level of cpa expression (P = 0.10), the cell proliferation of C. perfringens can be used to predict the incidence of NE lesion (P = 0.0175) (Fig. 4). The estimated probability shows that the average C. perfringens count of 5 log10 CFU/g in the digesta appears to be a threshold for developing NE with a lesion score of 2.
FIG. 4.
Relationship between C. perfringens cell proliferation and the incidence of NE.
Acknowledgments
This research was supported by the Poultry Industry Council (grant 167), Nutreco Canada Agresearch, and Agriculture & Agri-Food Canada through its MII program. W. Si and H. Zhou were NSERC Visiting Fellows to Canadian Federal Government laboratories, supported by joint funding to J.G.
Footnotes
Published ahead of print on 7 September 2007.
REFERENCES
- 1.Al-Sheikhly, F., and R. B. Truscott. 1977. The pathology of necrotic enteritis of chickens following infusion of broth cultures of Clostridium perfringens into the duodenum. Avian Dis. 21:230-240. [PubMed] [Google Scholar]
- 2.Al-Sheikhly, F., and R. B. Truscott. 1977. The pathology of necrotic enteritis of chickens following infusion of crude toxins of Clostridium perfringens into the duodenum. Avian Dis. 21:241-255. [PubMed] [Google Scholar]
- 3.Brennan, J., R. Bagg, D. Barnum, J. Wilson, and P. Dick. 2001. Efficacy of narasin in the prevention of necrotic enteritis in broiler chickens. Avian Dis. 45:210-214. [PubMed] [Google Scholar]
- 4.Brennan, J., G. Moore, S. E. Poe, A. Zimmermann, G. Vessie, D. A. Barnum, and J. Wilson. 2001. Efficacy of in-feed Tyloson phosphate for the treatment of necrotic enteritis in broiler chickens. Poultry Sci. 80:1451-1454. [DOI] [PubMed] [Google Scholar]
- 5.Brennan, J., J. Skinner, D. A. Barnum, and J. Wilson. 2003. The efficacy of bacitracin methylene disalicylate when fed in combination with narasin in the management of necrotic enteritis in broiler chickens. Poultry Sci. 82:360-363. [DOI] [PubMed] [Google Scholar]
- 6.Dahiya, J. P., D. C. Wilkie, A. G. Van Kessel, and M. D. Drew. 2006. Potential strategies for controlling necrotic enteritis in broiler chickens in post-antibiotic era. Anim. Feed Technol. 129:60-88. [Google Scholar]
- 7.Ficken, M. D., and D. P. Wages. 1997. Necrotic enteritis, p. 261-264. In B. W. Calnek (ed.), Disease of poultry, 10th ed. Iowa State University Press, Ames.
- 8.Fukata, T., Y. Hadate, E. Baba, T. Uemura, and A. Arakawa. 1988. Influence of Clostridium perfringens and its toxin in germ-free chickens. Res. Vet. Sci. 44:68-70. [PubMed] [Google Scholar]
- 9.Hein, H., and L. Timms. 1972. Bacterial flora in the alimentary tract of chickens infected with Eimeria brunetti and in chickens immunized with Eimeria maxima and cross-infected with Eimeria brunetti. Exp. Parasitol. 31:188-193. [DOI] [PubMed] [Google Scholar]
- 10.Keyburn, A. L., S. A. Sheedy, M. E. Ford, M. M. Williamson, M. M. Awad, J. I. Rood, and R. J. Moore. 2006. Alpha-Toxin of Clostridium perfringens is not an essential virulence factor in necrotic enteritis in chickens. Infect. Immun. 74:6496-6500. [DOI] [PMC free article] [PubMed] [Google Scholar]
- 11.Li, M., J. Gong, M. Cotrill, H. Yu, C. F. M. de Lange, J. Burton, and E. Topp. 2003. Evaluation of QIAamp® DNA Mini Stoll Kit for microbial ecological studies. J. Microbiol. Methods 54:13-20. [DOI] [PubMed] [Google Scholar]
- 12.Long, J. R., and R. B. Truscott. 1976. Necrotic enteritis in broiler chickens. III. Reproduction of the disease. Can. J. Comp. Med. 40:53-59. [PMC free article] [PubMed] [Google Scholar]
- 13.McDevitt, R. M., J. D. Brooker, T. Acamovic, and N. H. C. Sparks. 2006. Necrotic enteritis; a continuing challenge for the poultry industry. World Poultry Sci. J. 62:221-247. [Google Scholar]
- 14.Meer, R. R., and J. G. Songer. 1997. Multiplex PCR method for genotyping Clostridium perfringens. Am. J. Vet. Res. 58:702-705. [PubMed] [Google Scholar]
- 15.Olfert, E. D., B. M. Cross, and A. A. McWilliam. 1993. Canadian Council on Animal Care—guide to the care and use of experimental animals, vol. 1, 2nd ed. Bradda Printing Services Inc., Ottawa, Ontario, Canada.
- 16.Prescott, J. F. 1979. The prevention of experimentally induced necrotic enteritis in chickens by avoparcin. Avian Dis. 23:1072-1074. [PubMed] [Google Scholar]
- 17.Ross Tech. 1999. Necrotic enteritis and associated conditions in broiler chickens. World Poultry 15:44-47. [Google Scholar]
- 18.Shane, S. M., D. G. Koetting, and K. S. Harrington. 1984. The occurrence of Clostridium perfringens in the intestine of chicks. Avian Dis. 28:1120-1124. [PubMed] [Google Scholar]
- 19.Songer, J. G. 1996. Clostridial enteric diseases of domestic animals. Clin. Microbiol. Rev. 9:216-234. [DOI] [PMC free article] [PubMed] [Google Scholar]
- 20.Ståhlberg, A., P. Åman, B. Ridell, P. Mostad, and M. Kubista. 2003. A quantitative real-time PCR method for detection of B-lymphocyte monoclonality by comparison of kappa and lambda immunoglobulin light chain expression. Clin. Chem. 49:51-59. [DOI] [PubMed] [Google Scholar]
- 21.Walter, J., G. W. Tannock, A. Tilsala-Timisjarvi, S. Rodtong, D. M. Loach, K. Munro, and T. Alatossava. 2000. Detection and identification of gastrointestinal Lactobacillus species by using denaturing gradient gel electrophoresis and species-specific PCR primers. Appl. Environ. Microbiol. 66:297-303. [DOI] [PMC free article] [PubMed] [Google Scholar]


