

Abstract
Transparent sensors for microscopic O2 imaging were developed by spin coating an ultrathin (<1- to 2-μm) layer of a luminescent O2 indicator onto coverslips. The sensors showed (i) an ideal Stern-Volmer quenching behavior of the luminescence lifetime towards O2 levels, (ii) homogeneous measuring characteristics over the sensor surface, and (iii) a linear decline of luminescence lifetime with increasing temperature. When a batch of such coverslip sensors has been characterized, their use is thus essentially calibration free at a known temperature. The sensors are easy to use in flow chambers and other growth devices used in microbiology. We present the first application for combined imaging of O2 and bacteria in a biofilm flow chamber mounted on a microscope equipped with a spinning-disk confocal unit and a luminescence lifetime camera system.
The structure of biofilms, cell aggregates, and other surface-associated microbial communities can be mapped in great detail by a variety of microscopic techniques (5, 22). The use of confocal microscopy in combination with specific fluorescent stains, DNA probes, and microorganisms with fluorescent reporter gene fusions (2, 21, 24) has especially shown the pronounced heterogeneity and biocomplexity of such communities. While a range of stains can resolve redox conditions and chemical parameters, such as Ca2+ and pH in microscopic preparations (22), the most detailed investigation of the chemical microenvironment and metabolic activity in microbial communities has largely relied on the use of microsensors (19, 29).
Only a few studies have combined confocal microscopy and microsensor analysis directly in the same sample (3), and such simultaneous measurements are technically challenging. Further, microsensor analysis relies on point measurements within heterogeneous structures, and although microsensors have measuring tip diameters of only a few micrometers, they can cause local artifacts, e.g., due to their presence obstructing the local flow field (9, 11). This calls for optical methods enabling simultaneous microscopic imaging of biomass and important solutes, such as O2 and pH.
Optical O2 measurements.
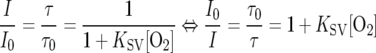
Optical O2 sensing was first developed in the medical field for blood gas analysis and was introduced in aquatic microbiology, when fiber-optic O2 microsensors were developed (16). The measuring principle relies on the dynamic quenching of a luminescent indicator by O2 (4). The most frequently used O2 indicators are either ruthenium-based or metalloporphyrin complexes (25, 27, 31). Both the luminescence intensity, I, and the luminescence decay time, i.e., the luminescence lifetime, τ, are dynamically quenched by oxygen. The process is fully reversible and does not consume any O2. An ideal optical O2 sensor response is described by the Stern-Volmer relation:
 |
(1) |
where τ0 and τ denote the luminescence lifetime in the absence or presence of oxygen, respectively; I0 and I denote the luminescence intensity in the absence or presence of O2, KSV is the bimolecular quenching coefficient, and [O2] is the oxygen concentration as a percentage of air saturation.
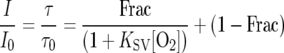
Oxygen-sensitive dyes can be immobilized in a polymer matrix that is fixed onto the tip of an optical fiber (microoptodes [16, 19]) or spread onto a transparent carrier foil (planar optodes [10, 18]). The immobilization often leads to a nonideal quenching behavior, as only a fraction of the luminescence can be quenched, as described, by a modified Stern-Volmer relation (15):
 |
(2) |
where Frac is the fraction of quenchable indicator dye. Such sensors can be calibrated by a two-point calibration (15, 19), typically by recording signals at zero O2 and at a second known O2 level.
Oxygen imaging.
By excitation of the indicator dye and imaging of the O2-dependent luminescence distribution over the planar optode area, the spatial O2 distribution can be mapped, and such macroscopic mapping of two-dimensional O2 distributions with planar optodes was first realized in sediments (10). The technique has since been used in many different applications in aquatic biology (1, 6-9, 20, 28). Typically, such measurements have mapped the O2 distribution over several cm2 at a pixel resolution of 50 to 200 μm. Initial studies relied on measuring the O2-dependent luminescence intensity, requiring the use of planar optodes with an extra black optical insulation layer to avoid interference by background light and other optical artifacts. However, with the development of a suitable luminescence lifetime system (14), the use of transparent O2 optodes became possible (13).
Planar O2 optodes have primarily been fabricated as 10- to 50-μm-thick layers on top of a transparent polyester foil (10, 18). However, this limits the spatial resolution, as the sensor material itself can act as an oxygen buffer and facilitate diffusive smearing. While this is not so critical at the pixel resolution used in most macroscopic applications, the use of such foil sensors for microscopic mapping of O2, e.g., below small cell clusters, is not feasible.
Preparation of ultrathin planar O2 sensors.
Ultrathin (<1- to 2-μm) layers of optical O2 indicators were immobilized onto glass coverslips. To ensure a strong bonding of the O2-sensitive layer, glass coverslips (24 by 50 mm; Knittel Gläser GmbH, Germany) were washed in dry acetone, placed on glass sticks in a glass tray, and dried overnight in an oven at 110°C. After the coverslips were dry, they were covered with a 7.5% (vol/vol) solution of dimethyldichlorosilane (synthesis grade; Merck) in toluene for 2 h in a closed chamber. The coverslips were then washed twice in toluene and once in absolute ethanol and dried at 110°C. After this silanization procedure, the coverslips were kept dust free at room temperature.
The O2-sensitive layer was immobilized onto the silanized coverslips by a spin-coating procedure. For the spin coating, 75 mg Ru(diphenyl phenanthroline)3Cl2 and 4 g of polystyrene (Goodfellow Cambridge Ltd., United Kingdom) were dissolved in 40 ml of 1,1,2-trichloroethane (96% stabilized with 2-propanol; Aldrich), filtered, and diluted to 60 ml. The ruthenium complex was prepared as described earlier (17). The spin coating was done on a Laurell Technologies Corp. WS-200-4NPP spin coater or a WS-400B-6NPP-LITE spin coater (1,000 rpm and an acceleration setting of 1). A coverslip was placed in the spin coater and completely covered with the polymer solution before the machine was started. The spin coater ran for 3 min to fully dry out the surface. Besides the ruthenium-based O2 sensors presented here, exactly the same procedure was also used to prepare ultrathin O2 sensors based on the metalloporphyrin Pt(II) meso-tetra(pentafluorophenyl)porphine (25).
The uniformity and thickness of the immobilized sensing layers were investigated with a Cloan Dektak 3030 surface profile measuring system. For this, a fine scratch was made in the sensing layer with a knife before placing the coverslips in the measuring system. With the procedures described above, it was possible to produce batches of coated coverslips with reproducible and very homogeneous layer thickness and measuring characteristics (Fig. 1). Generally, we used such O2 coverslip sensors with <1- to 2-μm-thick sensor layers. However, it is possible to generate sensors with other layer thicknesses by simply varying the viscosity of the sensor-solvent mixture and the parameters of the spin coater. The coverslip sensors could, e.g., be used as lids in biofilm growth chambers (Fig. 1A and 2B).
FIG. 1.

(A) Two coverslip sensors for O2 imaging with a <1- to 2-μm-thick polystyrene layer containing the O2 indicators Ru(diphenyl phenanthroline)3Cl2 (orange color) and the metalloporphyrin Pt(II) meso-tetra(pentafluorophenyl)porphine (red color). The latter is shown mounted as a lid on a biofilm growth flow chamber. (B) Interferometric measurement of indicator layer thickness and homogeneity of an oxygen coverslip sensor.
FIG. 2.

(A) Schematic drawing of the experimental setup for using coverslip sensors on a spinning-disk confocal microscope in combination with a luminescence lifetime imaging camera system. The blue and red arrows indicate the light paths for imaging the O2 distribution. The dashed gray arrow shows the light path for confocal microscopy. (B) Schematic drawing of the imaging geometry when O2 coverslip sensors are used as a lid in a biofilm growth flow chamber.
Microscopic imaging setup.
Microscopic imaging of the coverslip sensors was done on an Olympus BX50/WI microscope equipped with a 5× objective (Plan-Apochromat [Zeiss]; numerical aperture [NA] of 0.16), 40× objective (Plan-Apo WLSM [Olympus]; NA of 0.90), and 60× objective (Uplan-Apo W [Olympus]; NA of 1.20). The microscope was equipped with a three-laser line (488, 563, and 647 nm) spinning-disk confocal system (Ultraview LCI; Perkin-Elmer) using a Hamamatsu ORCA ER camera for detection of confocal images. A luminescence lifetime imaging system (14) was also coupled to the microscope via an additional camera port. The optical components of the lifetime imaging system consisted of a fast-gateable charge-coupled-device (CCD) camera (Sensimod-Sensicam; PCO AG, Germany) coupled to the microscope via an extra C-mount port) and a single high-intensity blue LED (Luxeon Lumileds, 470 nm, 5W) coupled to the microscope via the epifluorescence port. Blue excitation light was screened out using the blue light excitation cube (U-MSWB2; Olympus, Japan) of the epifluorescence microscope. A schematic drawing of the setup is shown in Fig. 2. It was possible to manually switch between confocal and luminescence lifetime imaging via a simple mirror in the emission light path of the microscope (dual port switch [Fig. 2A]). The field of view recorded by the two different camera systems was identical, allowing alignment of O2 images and confocal images of biofilm structure.
The luminescence lifetime data collection was done via a so-called pulse-gate method (14, 23). First, the excitation LED light source is switched on and illuminates the coverslip sensor. The luminescence that is detected by each pixel rises until a steady state between absorbed and emitted energy of the dye molecules is reached. Then the light source is switched off, and the camera shutter is opened, allowing ambient light and luminescence to reach the CCD chip for a certain defined time window after the eclipse of the excitation light. To evaluate the corresponding lifetime of the luminescence, two or three images are recorded, where each image is acquired with a different delay time relative to the eclipse of the excitation light source. This series of events is repeated for up to 10,000 times, while the incident light is integrated on the CCD chip before each image is passed to the PC. Finally, an image is recorded without the excitation to measure the background light that directly can be subtracted from the measured images before further processing. Depending on the timing scheme and number of repetitions, acquisition of a single set of images for subsequent lifetime calculation takes between ∼40 (with no repetition) and ∼500 ms. For further improvement of the signal-to-noise ratio, the whole procedure can then be repeated a couple of times to perform an efficient averaging. Further details on the luminescence lifetime imaging system and its operation as well as the theory behind the image calculations are presented elsewhere (13, 14).
Test and calibration.
The coverslip sensors were mounted as a lid in a small custom-built calibration flow chamber. The flow chamber had inlet and outlet ports with Luer fittings and a port for insertion of an O2 microoptode (16) and a thermistor, both connected to a commercial optoelectronic O2 meter (Microx TX3; Presense GmbH, Germany). The inlet of the chamber was connected, via a peristaltic pump, to a reservoir containing medium with known O2 content. A tube connected the chamber outlet to a waste container. The calibration chamber was mounted on the microscope, and after focusing onto the O2-sensitive layer, luminescence lifetime images were obtained as previously described (13) using custom-built software. The actual O2 level in the chamber was simultaneously monitored with the oxygen microsensor.
Calibration curves showed that the coverslip sensors exhibited an ideal Stern-Volmer response to O2 according to equation 1, where the quenching constant, KSV, could easily be determined as the slope of a τ0/τ versus [O2] plot (Fig. 3A). The sensors showed a homogeneous response and KSV over the sensor surface (Fig. 3B and C), and a pixel-to-pixel calibration of a lifetime picture measured at 38% air saturation yielded practically the same O2 level as if the calibration was done with average values over the coverslip (Fig. 3D). The coverslip sensors were calibrated over a range of different temperatures and exhibited a linear decrease of both τ0 and τ with temperature (Fig. 3E). The spin-coating procedure enabled high reproducibility between individual coverslips, and their ideal measuring characteristics simplifies the use of the O2 coverslip sensors in various microscopic applications. Once the KSV and temperature dependency of a batch of coverslip sensors have been characterized, their application is thus essentially calibration free as long as the experimental temperature is known and constant.
FIG. 3.

Characterization of a ruthenium-based coverslip sensor. (A) O2 dependence of the luminescence lifetime (diamonds) and the corresponding Stern-Volmer plot (circles) (average ± standard deviation; n = 3 to 5). The dashed line represents a linear fit to the Stern-Volmer plot (r2 > 0.999). (B to D) Number-of-pixel histograms for analyzing the homogeneity across the sensor surface of the luminescence lifetime at three different O2 levels in the calibration chamber (B), the quenching constant KSV (C), and measured O2 levels (D) based on a pixel-pixel calibration (black line) and a calibration based on average values (gray line) using the Stern-Volmer equation (equation 1). air sat., air saturation. (E) Temperature dependence of the O2-dependent luminescence lifetime (average ± standard deviation; n = 3 to 5). Dashed lines show a linear fit (r2 > 0.994) to the data.
Biofilm application.
Oxygen coverslip sensors were used as the upper lid in a custom-built flow chamber as well as a biofilm flow chamber system widely used for biofilm imaging (2, 26, 30) (Fig. 1A and 2B). Coverslips were fixed to the flow chambers by help of UV-curing adhesive (adhesive 426, Light Welder PC-3; Dymax Europe GmbH, Germany). The flow chambers were mounted on the microscope and inoculated with a green fluorescent protein (GFP) mutant of a kanamycin-resistant Pseudomonas putida (strain KT2442::gfp) grown in complex organic medium (1% yeast extract L21, 1% Lab-Lemco powder L29, 1% tryptone L42; Oxoid Ltd., United Kingdom). The flow of the medium through the flow chamber was regulated by the velocity setting of the peristaltic pump. The medium was air saturated before entering the flow chamber.
Thin flat biofilms of P. putida formed within a day's incubation (data not shown). However, the growth chamber also showed the presence of contaminant bacteria, which were not tagged by GFP, and formed large cell clusters on top of the P. putida biofilm (Fig. 4A). We visualized these bacteria by applying the nucleic acid dye SYTO 60 according to the manufacturer's instructions (Molecular Probes, Invitrogen Ltd., United Kingdom). Confocal image stacks of the biofilm were recorded through the coverslip sensors using 488-nm excitation and an emission 525-nm (±25-nm) band-pass filter for GFP signals and 647-nm excitation and an emission 700-nm (±30-nm) band-pass filter for SYTO 60 signals. The ruthenium O2 indicator on the coverslip is also excited by the 488-nm laser line but has its luminescence maximum at 610 nm, which did not interfere with the GFP and SYTO 60 signals. Image stacks were processed in Volocity 4.1 (Improvision Ltd., United Kingdom).
FIG. 4.

(A) Projection and vertical slices through a confocal image stack of a biofilm structure consisting of a GFP-marked Pseudomonas putida (green) and heterotrophic bacteria labeled with SYTO 60 (red) imaged at ×400 magnification through an O2 coverslip sensor mounted on top of a flow chamber. (B) Corresponding O2 distribution at the base of the biofilm. The central cell cluster is outlined by the white dashed curve. Bars, 40 μm.
By simple switching of the excitation and emission light paths, we could resolve the O2 distribution below and around exactly the same cluster of bacteria that was previously characterized by confocal imaging (Fig. 4B). This combined imaging was done at ×400 magnification. At low flow velocity, the center of the cell cluster was anoxic, but over a radial distance of >40 μm from the center, O2 levels reached 4 to 8% air saturation below the thin biofilm dominated by the GFP-tagged P. putida. Even a thin ∼3- to 5-μm-thick biofilm of P. putida could thus apparently deplete O2 to rather low levels. However, the O2 level was significantly increased at higher flow velocities, where O2 levels below the cell cluster reached ∼5% air saturation and ∼15 to 20% air saturation below the thin biofilm (Fig. 5). This indicated a strong transport limitation of O2 to the biofilm basis in the flow chamber, which was alleviated at higher flow velocities.
FIG. 5.

Oxygen distribution below a biofilm structure (Fig. 4) growing in a flow chamber at low flow (A) and after onset of a higher flow velocity (B to F). The central cell cluster is outlined by the white dashed curve. The pictures were imaged at ×400 magnification with an O2 coverslip sensor mounted on top of the flow chamber. Bar, 40 μm.
At ×50 magnification, a more complex pattern of O2 distribution could be observed (Fig. 6). At almost stagnant conditions, the O2 level at the biofilm was relatively homogeneous around 5 to 7% air saturation, with the exception of one area, where higher levels were observed indicative of a void in the biofilm structure. As flow velocity was increased, O2 penetrated deeper into the biofilm around the cell clusters, below which O2 was still depleted. Overall, the spatial O2 distribution at the biofilm became much more heterogeneous with higher flow, reflecting a complex interaction between biofilm microstructure and flow and a dynamic balance between biofilm growth patterns, O2, and substrate availability over time. Such spatiotemporal variation in oxygen levels would not have been detected with microsensors. Similar observations of flow-dependent oxygen dynamics have been observed in macroscopic O2 imaging of a heterotrophic biofilm in an open flow chamber (9). This earlier study used nontransparent ∼30-μm-thick planar optodes at a pixel resolution of about 30 to 50 μm. Our study clearly showed the presence of pronounced O2 gradients and anoxic microniches in the biofilm at a scale of 10 to 40 μm (Fig. 3 to 5). With the new transparent O2 coverslip sensors, we have bridged the gap from macroscopic to microscopic O2 imaging and shown their application for combined imaging of O2 distribution and biofilm structure.
FIG. 6.

Bright-field microscope picture taken through the O2 coverslip sensor, and corresponding O2 distribution below a biofilm growing in a flow chamber (Fig. 2B) under different flow conditions. Prominent cell clusters as seen in the bright-field picture are outlined by the white dashed curves. The pictures were imaged at 50× magnification with the coverslip sensor mounted on top of the flow chamber. Bar, 200 μm.
Conclusions.
The new coverslip sensors represent a versatile new tool for O2 imaging in microbiology. Microscopic O2 conditions in growing cell cultures and biofilms can now be followed in real time, in combination with other microscopic techniques, such as confocal microscopy of biomass or optical coherence tomography (32). Imaging the growth and morphology of defined biofilms in growth chamber devices is of paramount importance in many areas of biofilm research (26, 30, 33). Such experiments are often instrumental in the formulation and testing of hypotheses for specific mechanisms governing biofilm structure and function and microbial interaction, especially when combined with the use of genetically modified strains and mutants expressing various reporter genes (e.g., reference 12). However, in most cases, such studies have relied on assumptions about the chemical microenvironment within the flow chamber that have seldom, if at all, been verified. With the new coverslip sensors, it is now possible to include actual measurements of the microscopic O2 conditions in the flow chamber and biofilms. Beyond biofilm research, the O2 coverslip sensors may find wide application in microbiology and cell biology. The new methodology enables a wide range of experiments where cellular biomass and cell distributions and activities can be mapped in concert with the O2 microenvironment. Currently, sensor application requires a luminescence lifetime imaging system. However, we are now in the process of implementing a reference dye within the O2-sensitive layer, and this should allow the use of the O2 coverslip sensors for ratiometric imaging on standard epifluorescence microscopes.
Acknowledgments
This study was funded by the Danish Research Council for Technology and Production (FTP), the Danish National Advanced Technology Foundation, and the Danish Natural Science Research Council (FNU).
We thank Niels Bent Larsen at the Department of Polymer Science, Risø National Laboratory, for giving us access to spin-coating equipment and help with measuring the thickness of O2-sensitive layers. Søren Sørensen, Section for Microbiology, Copenhagen University, kindly provided the GFP mutant bacteria used in this study. We thank Björn Grunwald and Gerhard Holst for developing the O2 image acquisition and analysis hardware and software used in this study and Ronnie Glud for providing essential hardware.
Footnotes
Published ahead of print on 17 August 2007.
REFERENCES
- 1.Behrens, J. W., H. J. Stahl, J. F. Steffensen, and R. N. Glud. 2007. Oxygen dynamics around buried lesser sandeels Ammodytes tobianus: mode of ventilation and oxygen requirements. J. Exp. Biol. 210:1006-1014. [DOI] [PubMed] [Google Scholar]
- 2.Christensen, B. B., C. Sternberg, J. B. Andersen, R. J. Palmer, A. T. Nielsen, M. Givskov, and S. Molin. 1999. Molecular tools for study of biofilm physiology. Methods Enzymol. 310:20-42. [DOI] [PubMed] [Google Scholar]
- 3.De Beer, D., P. Stoodley, F. Roe, and Z. Lewandowski. 1994. Effects of biofilm structures on oxygen distribution and mass transport. Biotechnol. Bioeng. 43:1131-1138. [DOI] [PubMed] [Google Scholar]
- 4.Demas, J. N., B. A. DeGraff, and P. B. Coleman. 1999. Oxygen sensors based on luminescence quenching. Anal. Chem. 71:793A-800A. [DOI] [PubMed] [Google Scholar]
- 5.Denkhaus, E., S. Meisen, U. Telgheder, and J. Wingender. 2007. Chemical and physical methods for characterisation of biofilms. Mikrochim. Acta 158:1-27. [Google Scholar]
- 6.Frederiksen, M. S., and R. N. Glud. 2006. Oxygen dynamics in the rhizosphere of Zostera marina: a two-dimensional planar optode study. Limnol. Oceanogr. 51:1072-1083. [Google Scholar]
- 7.Glud, R. N., A. Tengberg, M. Kühl, P. Hall, I. Klimant, and G. Holst. 2001. An in situ instrument for planar O2 optode measurements at benthic interfaces. Limnol. Oceanogr. 46:2073-2080. [Google Scholar]
- 8.Glud, R. N., M. Kühl, O. Kohls, and N. B. Ramsing. 1999. Heterogeneity of oxygen production and consumption in a photosynthetic microbial mat as studied by planar optodes. J. Phycol. 35:270-279. [Google Scholar]
- 9.Glud, R. N., C. M. Santegoeds, D. de Beer, O. Kohls, and N. B. Ramsing. 1998. Oxygen dynamics at the base of a biofilm studied with planar optrodes. Aquat. Microb. Ecol. 14:223-233. [Google Scholar]
- 10.Glud, R. N., N. B. Ramsing, J. K. Gundersen, and I. Klimant. 1996. Planar optrodes: a new tool for fine scale measurements of two-dimensional O2 distribution in benthic communities. Mar. Ecol. Prog. Ser. 140:217-226. [Google Scholar]
- 11.Glud, R. N., J. K. Gundersen, N. P. Revsbech, and B. B. Jørgensen. 1994. Effects on the benthic diffusive boundary layer imposed by microelectrodes. Limnol. Oceanogr. 39:462-467. [Google Scholar]
- 12.Hansen, S. K., P. B. Rainey, J. A. J. Haagensen, and S. Molin. 2007. Evolution of species interactions in a biofilm community. Nature 445:533-536. [DOI] [PubMed] [Google Scholar]
- 13.Holst, G., and B. Grunwald. 2001. Luminescence lifetime imaging with transparent oxygen optodes. Sens. Actuators B 74:78-90. [Google Scholar]
- 14.Holst, G., O. Kohls, I. Klimant, B. König, M. Kühl, and T. Richter. 1998. A modular luminescence lifetime imaging system for mapping oxygen distribution in biological samples. Sens. Actuators B 51:163-170. [Google Scholar]
- 15.Klimant, I., M. Kühl, R. N. Glud, and G. Holst. 1997. Optical measurement of oxygen and temperature in microscale: strategies and biological applications. Sens. Actuators B 38/39:29-37. [Google Scholar]
- 16.Klimant, I., V. Meyer, and M. Kühl. 1995. Fiber-optic oxygen microsensors, a new tool in aquatic biology. Limnol. Oceanogr. 40:1159-1165. [Google Scholar]
- 17.Klimant, I., and O. S. Wolfbeis. 1995. Oxygen-sensitive luminescent materials based on silicone-soluble ruthenium diimine complexes. Anal. Chem. 67:3160-3166. [Google Scholar]
- 18.König, B., O. Kohls, G. Holst, R. N. Glud, and M. Kühl. 2005. Fabrication and test of sol-gel based planar oxygen optodes for use in aquatic sediments. Mar. Chem. 97:262-276. [Google Scholar]
- 19.Kühl, M. 2005. Optical microsensors for analysis of microbial communities. Methods Enzymol. 397:166-199. [DOI] [PubMed] [Google Scholar]
- 20.Kühl, M., G. Holst, A. W. D. Larkum, and P. J. Ralph. Mapping of the oxygen distribution and its dynamics within the endolithic algal community of the massive coral Porites lobata (Dana). J. Phycol., in press. [DOI] [PubMed]
- 21.Lawrence, J. R., and T. R. Neu. 2003. Microscale analysis of the formation and nature of microbial biofilm communities in river systems. Rev. Environ. Sci. Biotechnol. 2:85-97. [Google Scholar]
- 22.Lawrence, J. R., D. R. Korber, and T. R. Neu. 2007. Analytical imaging and microscopy techniques. In C. J. Hurst, R. L. Crawford, J. L. Garland, D. A. Lipson, A. L. Mills, and L. D. Stetzenbach (ed.), Manual of environmental microbiology. ASM Press, Washington, DC.
- 23.Marriott, G., R. M. Clegg, D. J. Arndt-Jovin, and T. M. Jovin. 1991. Time resolved imaging microscopy. Biophys. J. 60:1374-1387. [DOI] [PMC free article] [PubMed] [Google Scholar]
- 24.Neu, T. R., P. Walczysko, and J. R. Lawrence. 2004. Two-photon imaging for studying the microbial ecology of biofilms systems. Microb. Environ. 19:1-6. [Google Scholar]
- 25.O'Donovan, C., J. Hynes, D. Yashunki, and D. B. Papkovsky. 2005. Phosphorescent oxygen-sensitive materials for biological applications. J. Mater. Chem. 15:2946-2951. [Google Scholar]
- 26.Palmer, R. J. 1999. Microscopy flowcells: perfusion chambers for real-time study of biofilms. Methods Enzymol. 310:160-166. [DOI] [PubMed] [Google Scholar]
- 27.Papkovsky, D. B. 2004. Methods in optical oxygen sensing: protocols and critical analysis. Methods Enzymol. 381:715-735. [DOI] [PubMed] [Google Scholar]
- 28.Polerecky, L., U. Franke, U. Werner, B. Grunwald, and D. De Beer. 2005. High spatial resolution measurements of oxygen consumption rates in permeable sediments. Limnol. Oceanogr. Methods 3:75-85. [Google Scholar]
- 29.Revsbech, N. P. 2005. Analysis of microbial communities with electrochemical microsensors and microscale biosensors. Methods Enzymol. 397:147-166. [DOI] [PubMed] [Google Scholar]
- 30.Sternberg, C., B. B. Christensen, T. Johansen, A. T. Nielsen, J. B. Andersen, M. Givskov, and S. Molin. 1999. Distribution of bacterial growth activity in flow-chamber biofilms. Appl. Environ. Microbiol. 65:4108-4117. [DOI] [PMC free article] [PubMed] [Google Scholar]
- 31.Wolfbeis, O. S. 2005. Materials for fluorescence-based chemical sensors. J. Mater. Sci. 15:2657-2669. [Google Scholar]
- 32.Xi, C., D. L. Marks, S. Schlachter, W. Luo, and S. A. Boppart. 2006. High-resolution three-dimensional imaging of biofilm development using optical coherence tomography. J. Biomed. Opt. 11:34001. [DOI] [PubMed] [Google Scholar]
- 33.Zippel, B., J. Rijstenbil, and T. R. Neu. 2007. A flow-lane incubator for studying freshwater and marine phototrophic biofilms. J. Microbiol. Methods 70:336-345. [DOI] [PubMed] [Google Scholar]