Abstract
Listeria monocytogenes is a food-borne pathogen that has been implicated in many outbreaks associated with ready-to-eat products. Listeria adjusts to various stresses by adjusting its membrane fluidity, increasing the uptake of osmoprotectants and cryoprotectants, and activating the σB stress factor. The present work examines the regulation of membrane fluidity through direct measurement based on fluorescent anisotropy. The membrane fluidities of L. monocytogenes Scott A, NR30, wt10403S, and cld1 cells cultured at 15 and 30°C were measured at 15 and 30°C. The membrane of the cold-sensitive mutant (cld1) was more rigid than the membranes of the other strains when grown at 30°C, but when grown at 15°C, it was able to adjust its membrane to approach the rigidity of the other strains. The difference in rigidities, as determined at 15 and 30°C, was greater in liposomes than in whole cells. The rates of fluidity adjustment and times required for whole cells to adjust to a different temperature were similar among strains but different from those of liposomes. This suggests that the cells had a mechanism for homeoviscous adaptation that was absent in liposomes.
Listeria monocytogenes is a eurythermal, osmotolerant, and pathogenic gram-positive rod. Its ability to grow at refrigeration temperatures is a constant challenge for food preservation (9, 14, 22). Listeria resists salt, nisin, refrigeration, and low pH after previous exposure, but it can gain cross-resistance to various stressors (2, 5, 6, 16, 21). The pathogen has been associated with a variety of products, including milk and dairy products and ready-to-eat meat and fish, as well as cabbage, radishes, pâté, and soft cheeses (9, 26). The Centers for Disease Control and Prevention estimates that food-related illnesses result in 325,000 hospitalizations and 5,000 deaths in the United States yearly; a significant part of this is caused by L. monocytogenes (22). Due to its high mortality rate, especially among the immunocompromised, elderly people, and infants (26), the FDA set a “zero tolerance” status for L. monocytogenes in ready-to-eat foods.
Listeria monocytogenes’ ability to adjust to a wide range of environmental stresses has been extensively studied and reviewed in an attempt to identify and understand the factors behind this efficient adaptation (3, 7, 11, 14). When L. monocytogenes is grown at low temperatures, the phospholipids of the cell membrane become more rigid and can interfere with normal functions of the membrane and membrane-associated proteins (23, 29, 32, 34). To counteract this phenomenon, L. monocytogenes modifies its plasma membrane to maintain its fluidity at low temperature (32); this is collectively termed homeoviscous adaptation (30). Low-temperature growth induces several levels of adjustments at the cell membrane; there are rapid enzyme-mediated adjustments and slower adjustments that require de novo protein synthesis. These cause an increase in the amount of odd-numbered fatty acids and branched-chain fatty acids, a switch from iso to anteiso branching patterns, and, later, a shortening of the length of the branched-chain fatty acids (1, 19, 20, 25). These changes lead to maintenance of constant membrane fluidity at low temperatures by including fatty acids with lower phase transition temperatures (Tc) (12, 18, 20). Several studies have used cold-sensitive (1, 8) and nisin-resistant (7, 33) mutants to better understand the changes that lead to their phenotypes. The cold-sensitive mutant's cell membrane is deficient in branched fatty acids, odd-numbered fatty acids, and anteiso fatty acids. The membrane of the nisin-resistant mutant has more straight chains, less branching, and higher Tc compared to the wild type. This further emphasizes the major effect of fatty acid composition on membrane fluidity and cell viability at low temperatures.
Fluorescence techniques are becoming increasingly popular due to their high sensitivity and favorable time scale and are used to measure a variety of cell parameters, including membrane fluidity (15, 31). Anisotropy measurements are used for quantization of membrane fluidity. The hydrophobic probe 1,6-diphenyl-1,3,5-hexatriene (DPH) is inserted in the phospholipid bilayer and moves as the membrane moves. A fluid membrane allows greater probe mobility, leading to interference with its emitted signal. By measuring the emitted light, one can assess the rigidity of the cell membrane, which is directly proportional to the emitted intensity (21, 31). In order to assess membrane properties, either liposomes or whole cells can be used. Liposomes are the most commonly used system when studying biological membranes (10, 24, 35) as they offer the benefit of examining phospholipid membrane fluidity in a system having a fixed composition. In contrast, measurement using whole cells allows the assessment of membrane fluidity while taking into consideration the contribution of physiological changes.
Several authors have examined changes in phospholipid composition to evaluate membrane fluidity at various temperatures (18, 20, 25, 33). The present research uses static and real-time measurements to better understand the role of membrane fluidity in the stress resistance and sensitivity phenotypes of the two mutants. In this study, liposome, whole-cell, and real-time whole-cell anisotropy were performed on the four L. monocytogenes variants Scott A (the wild type from which NR30 is derived), NR30 (nisin resistant at 30°C), wt10304S (a wild-type strain), and cld1 (cold-sensitive mutant derived from 10304S) to better understand the dynamics of membrane fluidity alterations at different growth temperatures and the effect of the nisin-resistant, cold-sensitive phenotypes on membrane fluidity compared to that of the wild-type strains.
MATERIALS AND METHODS
Culture and culture conditions.
L. monocytogenes Scott A (wild type), NR30 (ATCC 700302; nisin resistant at 30°C derived from Scott A) (20), wt10403S (wild type), and cld1 which is a cold-sensitive mutant of the wild type with a transposon (Tn917) inserted into its branch fatty acid synthesis sequence (37) were maintained in Trypticase soy broth slants (Difco, MI) supplemented with 2.5 g/liter glucose and 6 g/liter yeast extract. cld1 slants were supplemented with 1 μg/ml erythromycin.
Lipid extraction.
Brain heart infusion broth (BHI [Difco, MI]) was inoculated with overnight L. monocytogenes cells and incubated at the desired temperature (15 or 30°C) until mid-log phase (A600 = 0.6 to 0.8). The cells were harvested by centrifugation (10 min, 4°C, 9,000 × g), washed with 0.1% buffered peptone water (Difco, MI), and then pelleted by centrifugation. The extraction method described by Bligh and Dyer (4), modified for Listeria (36), was used for lipid extraction. In a 50-ml centrifuge tube, 6 g of glass beads (<106 μm in diameter) and 0.1 N HCl-methanol-chloroform were added to the cell pellet in a ratio of 0.5:1:0.4 by volume. Mixtures were vortexed every 10 min for 1 h. Chloroform and HCl were added to the tubes to achieve a ratio of 1:1:1. Tubes were centrifuged (3,500 × g, 8 min), and the chloroform layer (below the solid layer) was collected. The pellets in the centrifuge tubes were washed with 5 ml chloroform and centrifuged, and the chloroform layer was collected again. The combined chloroform layers were neutralized with 1 N NH4OH in methanol and dried under nitrogen. Lipids were resuspended in chlolorform-methanol (9:1) in siliconized microcentrifuge tubes, flushed with nitrogen, and stored at −20°C for up to 2 weeks.
Liposome construction.
The method described by Hromy and Carman (13), with modifications (36), was used for liposome preparation. A lipid aliquot in a siliconized tube was dried under nitrogen and further dried in a Speedvac (Savant, MN) for 2 h. Dry lipids were resuspended in 50 μM 2-(N-morpholino)-ethansulfonic acid (MES [Sigma, St. Louis, MO]), and n-octyl-β-d-glucopyranoside (Sigma) was added to achieve a 1:14 lipid/detergent ratio. Lipids were gently scraped off the sides of the tubes, which were then vortexed for 1 h. In the meantime, 1 g Sephadex G-50 (Sigma) was hydrated for 1 h with 40 ml of MES. Microcolumns (Poly-prep columns [Bio-Rad, CA]) were loaded with Sephadex resin and equilibrated with MES, and then the lipids were gently deposited on top of the Sephadex bed. The column was gently eluted with MES. Liposomes were formed in the void volume as the detergent was trapped in the column. Cloudy drops containing liposomes were collected in siliconized microcentrifuge tubes and stored on ice for same-day use.
Steady-state fluorescent anisotropy.
Anisotropy measurement, also known as membrane rigidity measurement, is a fluorometric method to measure membrane fluidity. Anisotropy values were based on the emitted intensity of DPH using a Perkin-Elmer fluorimeter (PE LS 50B, CT). The lower the fluidity of the lipids, the less the membrane moves and subsequently the less the probe moves. This leads to less distortion of the emitted signal and higher rigidity values recorded by the fluorimeter (21).
The fluorimeter's vertically polarized light was set at 360 nm to excite the probe. The emitted light was measured at 430 nm through a polarizer vertically (Ivv) and horizontally (Ivh) compared to the excited light. The grating factor (G) used was 1.27. The slit width for excitation and emission was set at 10 nm.
For anisotropy measurement, 50 μl of liposomes was added to 2 ml 50 μM MES in a quartz cuvette (four clear sides) and placed in the fluorimenter chamber for 5 min to achieve temperature equilibration. Then 10 readings were obtained and averaged. Afterwards, DPH in tetrahydrofuran (Sigma) was added to the cuvette to a final concentration of 10−6 M, mixed by pipetting, and read after exactly 4 min for 1 min, and readings were averaged. The anisotropy (r) was calculated using the intensity recorded before (I°vv and I°vh) and after (I′vv and I′vh) DPH according to the equation
 |
Whole-cell anisotropy.
The protocol for whole cells was similar to the procedures followed for the liposomes. BHI was inoculated with L. monocytogenes and incubated at the desired temperature (15 or 30°C) until mid-log phase (A600 ≈ 0.7). Afterwards, cells were harvested by centrifugation and then washed with phosphate-buffered saline (Sigma), centrifuged, and then resuspended to an A450 of 0.28 in phosphate-buffered saline. DPH was added to the cells to achieve a final concentration of 10−6 M, and the tubes were incubated for 45 min at the same temperature used to grow the cells. For anisotropy measurement, 2 ml of unlabeled cells was measured to establish baseline values.
Real-time anisotropy measurements.
L. monocytogenes cells used for real-time anisotropy were grown and equilibrated under the same conditions as those used for static measurements. DPH-labeled cells were preequilibrated at the growth temperature (15 or 30°C). While continuous measurements were recorded, the temperature was steadily increased (5°C every 5 min) until the target temperature was reached. The change in rigidity per temperature (Δr/ΔT) was plotted.
Measurement of cell adjustment to temperature shift.
To determine the ability of cells to adjust to temperature changes, cells grown at one temperature were equilibrated to a second temperature and then returned to the original temperature. The anisotropy of Listeria monocytogenes strains (cells or liposomes) grown at 30°C was measured at 30°C for 5 min to establish a baseline. The temperature was shifted to 15°C and held for 1.5 h with anisotropy measurements taken every 15 min. The temperature was shifted back to 30°C, and the anisotropy was measured every 10 min for 30 min. The reverse experiment (cells grown at 15°C, equilibrated at 30°C, and shifted back to 15°C) was also conducted.
Nisin MIC.
Nisin MICs were determined for the four Listeria monocytogenes strains. The assay was performed in a 96-well plate using a Dynex MRX plate reader (Dynex, VA) at 30°C with nisin (2.5% nisin [Sigma]) concentrations ranging from 5 IU/ml to 1,000 IU/ml. Overnight cultures of L. monocytogenes were diluted in BHI (1:100) and added to the wells. Nisin was later added to achieve the desired concentrations. The plate was read (A630) every half hour for 24 h, and the results were duplicated.
RESULTS AND DISCUSSION
Liposome and whole-cell static anisotropy.
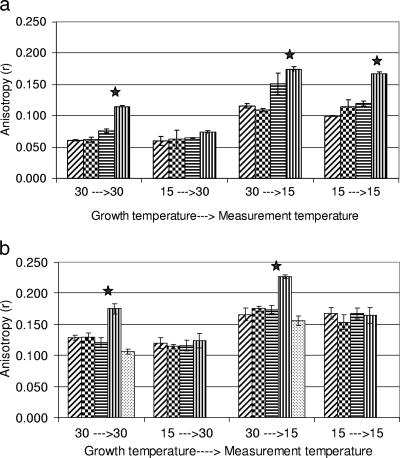
Listeria monocytogenes strains (Scott A, NR30, wt10403S, and cld1) were grown at 15 and 30°C, followed by lipid extraction and liposome construction (as described earlier), and their membrane fluidity was measured at 30 and 15°C. These normal and stress growth temperatures were used to examine the influence of temperature on membrane fluidity in different genetic backgrounds. The rigidities of liposomes measured at 15°C were almost double (84% increase) the rigidities of liposomes grown at 30°C, regardless of the growth temperature (Fig. 1a). However, cld1 had a different response. When grown and measured at 30°C, cld1 displayed a 73% higher rigidity than the other strains, but when grown at 15°C and measured at 30°C, cld1 had less difference in rigidity than the others.
FIG. 1.
Growth and measurement temperatures (°C) impact membrane rigidity (anisotropy) of Listeria monocytogenes Scott A (hatched bars), NR30 (checkered bars), wt10403S (horizontally striped bars), cld1 (vertically striped bars), and 2-methylbutyrate-treated cld1 (stippled bars) liposomes (a) and whole cells (b). The x axis displays the growth temperature followed by the measurement temperature. Significant differences (P < 0.05) are indicated by solid stars.
To elucidate the behavior of membrane lipids in the native state, while accounting for the effect of membrane proteins and other constituents on membrane fluidity, whole-cell anisotropy was monitored under various conditions (Fig. 1b). Irrespective of the growth temperature, whole cells measured at 15°C had membranes that were more (37%) rigid than those measured at 30°C. The rigidity of cld1 whole cells was similar to that of liposomes. When grown at 30°C, cld1 had significantly higher rigidity (t test; P < 0.05) than other strains, irrespective of the measurement temperature. The addition of 2-methylbutyrate (Sigma) to cld1 grown at 30°C restored rigidity values back to wt10403S levels (Fig. 1b). However, when cld1 was grown at 15°C, its rigidity was similar to those of the other strains (P > 0.05). This is consistent with changes in fluidity as a function of temperature that were observed in Bacillus and Pseudomonas sp. using liposomes and whole cells (17, 34). The adjustment of cellular membranes in response to multiple factors was reported (1, 10, 28). Whole cells, but not liposomes, adjust their fluidity in response to temperature. This adjustment is believed to account for the smaller difference in the measurement between 15 and 30°C compared to the difference observed in liposomes (37% and 87%, respectively).
Real-time whole-cell anisotropy.
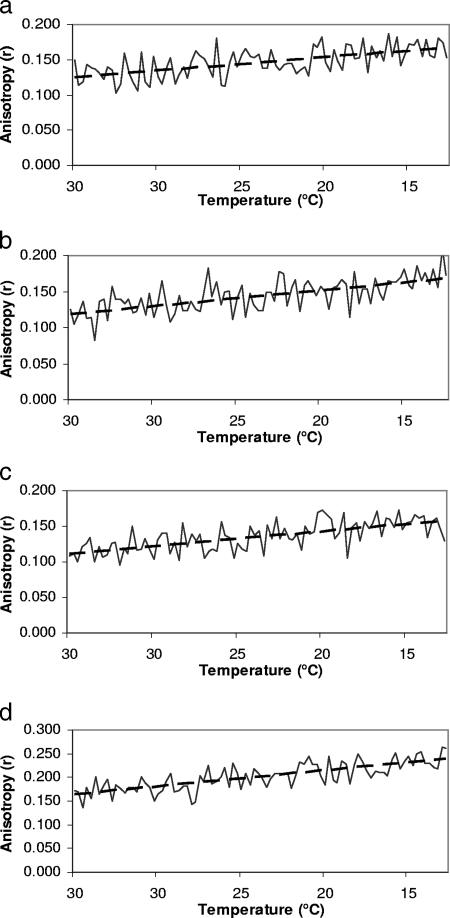
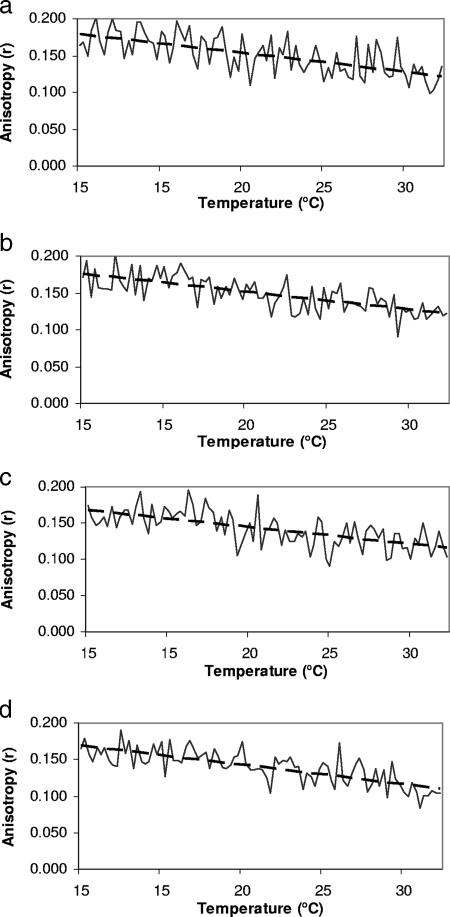
To further elucidate the kinetics of membrane rigidity adjustment in response to temperature, real-time anisotropy measurements were performed for the four strains grown at 30 and 15°C (Fig. 2 and 3). Longer measurement times were needed, thus lengthening the exposure of the probe (DPH) to excitation light. This might lead to photobleaching. To investigate this possibility, samples were exposed to excitation light for 20 min. The difference in the intensities emitted by the probe in the first and last minutes of the assay was negligible (data not shown). The real-time measurement was started at the temperature used to grow and equilibrate the cells (15 or 30°C) and then changed by 5°C every 5 min until the target temperature was reached. For the cells grown at 30°C, as the temperature decreased to 15°C, the rigidity increased at rates (Δr/ΔT derived from the linear regression line [Fig. 2]) that are similar for the four strains (Table 1). The whole cells adjusted their fluidity on a continuous basis. The rigidity values at the start and the end of the experiment were similar to the values obtained in static measurement at the same temperature (Fig. 1). This further confirms the absence of photobleaching. The slopes from the linear regression lines for the four strains were compared to determine if there was any difference in their speeds of adjustment (anisotropy change/°C) to changes in temperature. There was, however, no significant difference in the rates of adjustment between strains (t test; P > 0.05). These results demonstrate that L. monocytogenes responds to temperature fluctuation with a continuous and rapid adjustment of membrane fluidity.
FIG. 2.
Real-time whole-cell anisotropy measurement examining the effect of temperature decrease (5°C every 5 min) for Listeria monocytogenes Scott A (a), NR30 (b), wt10403S (c), and cld1 (d) grown at 30°C. Dashed black lines show the linear regression of the data.
FIG. 3.
Real-time whole-cell anisotropy measurements during temperature increases (5°C every 5 min) for Listeria monocytogenes Scott A (a), NR30 (b), wt10403S (c), and cld1 (d) grown at 15°C. Dashed black lines show the linear regression fit performed on the data.
TABLE 1.
Rate of adjustment of whole cells and liposomes of the four strains grown at 15 and 30°C
| L. monocytogenes strain | Change in r/°C in strain grown ata:
|
|||
|---|---|---|---|---|
| 30°C
|
15°C
|
|||
| Whole cells | Liposomes | Whole cells | Liposomes | |
| Scott A | 0.0111 | 0.0236 | 0.0146 | 0.021 |
| NR30 | 0.0142 | 0.0181 | 0.0146 | 0.0181 |
| wt10403S | 0.0125 | 0.017 | 0.014 | 0.022 |
| cld1 | 0.0212 | 0.0203 | 0.0154 | 0.0206 |
Differences in adjustment rate (anisotropy) between whole cells and liposomes were significant (P > 0.05), except for cld1 at 30°C. No significant differences were noted among whole cells (except cld1) and among liposomes. The average of duplicates is shown.
Whole-cell adaptation kinetics.
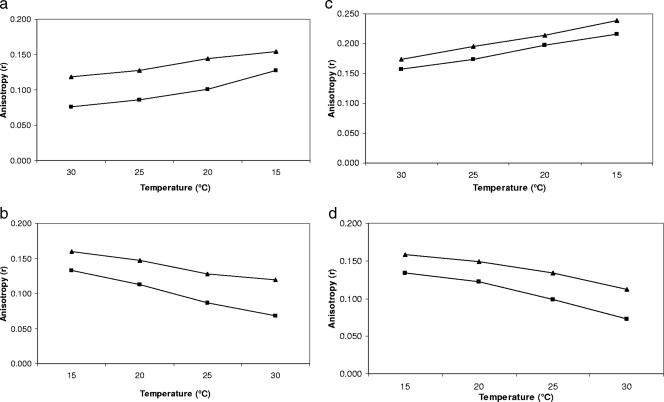
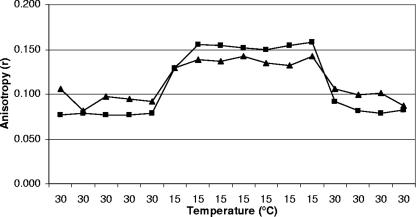
Adjustment of cell membrane fluidity as a function of temperature change is known as homeoviscous adaptation (30). This occurs to maintain constant membrane fluidity. As the temperature decreases, the lipids found in the cell membrane become more rigid, which interferes with the activity of the membrane and membrane-bound components like channels and pumps (27, 29). To the best of our knowledge, the time required for various Listeria monocytogenes strains to adjust their membrane fluidity is unknown. To measure the time needed for adjustment, the anisotropy of cells grown and equilibrated at 15°C was measured for 20 min at 30°C without allowing any time for preequilibration (Fig. 4). Adjustment times for the four strains were 130 to 180 s. These results are slightly different from the static measurement values, suggesting a multistage adjustment for the cell membrane. Giotis et al. (12) and Mastronicolis et al. (18) have previously observed a two-stage adjustment of cell membranes to temperature: a fast “emergency” adjustment followed by a slow adjustment considered as a fine-tuning of the membrane fluidity. These authors’ findings reflect a similar response, adopted by Listeria, to many types of stress (temperature and pH). De novo protein synthesis inhibition, using chloramphenicol, did not stop cell adjustment (data not shown). To further demonstrate the adaptation of whole cells, dynamic anisotropy measurements of liposomes and whole cells were plotted and compared (Fig. 5). cld1 previously showed no adaptation when grown at 30°C (Fig. 1b); this was further shown by a whole-cell plot parallel to the liposome plot. When cld1 was grown at 15°C, the whole cells adjusted to changing temperature, at a lower rate than liposomes (Table 1). The slopes of dynamic anisotropy of all whole-cell strains showed a lower degree of change in rigidity compared to liposomes (Table 1). This independently confirms the adjustment of whole cells in response to temperature. When cells were measured at 30°C and then equilibrated at 15°C for 1.5 h, followed by remeasurement at 30°C, they adjusted to 15°C. Their rigidities before and after the 15°C equilibration were different, in contrast to the liposomes, which had the same rigidity before and after the equilibration (Fig. 6).
FIG. 4.
Time required for homeoviscous adaptation of Listeria monocytogenes. The graph presents the anisotropy (continuous line) of Scott A (a), NR30 (b), wt10403S (c), and cld1 (d) grown at 15°C and measured at 30°C. The black dotted line represents the average equilibrium value from the static measurement. Replicate experiments yielded consistent results.
FIG. 5.
Real-time dynamic anisotropy of liposomes (squares) and whole cells (triangles) of L. monocytogenes strains wt10403S (a and b) and cld1 grown at 30 and 15°C (c and d) showing the physiological adjustment of whole cells to temperature compared to the solely physical adjustment of liposomes. An average of multiple data is shown.
FIG. 6.
Change of anisotropy of whole cells (triangles) measured at 30°C as a result of equilibration at 15°C. The liposomes (squares) have similar values at 30°C pre- and postequilibration at 15°C. The average of multiple data is shown.
These results further demonstrated the active adjustment of L. monocytogenes in response to temperature.
MICs of nisin.
Nisin induces temperature-independent changes to the membrane of strain NR30 (20). These changes include more straight-chain fatty acids, less branched fatty acids, lower C15 and C17 and higher C16 and C18 fatty acids, and a higher phase transition temperature (20, 23). A similar profile (high even fatty acids, low odd fatty acids, and low branched fatty acids) is displayed by cld1 (1, 8, 12). To examine if the rigid profile of the cld1 membrane confers nisin resistance, the MICs of the four strains were determined in BHI with nisin concentrations ranging from 5 IU/ml to 1,000 IU/ml. Nisin at 1,000 IU/ml was the only concentration that inhibited Scott A and wt10403S. Strain NR30 was not inhibited by any tested concentration. Strain cld1 showed the highest sensitivity to nisin, being inhibited by concentrations as low as 100 IU/ml. The fact that NR30 and cld1 share similar membrane compositions but show different membrane fluidities and different sensitivities to membrane-acting components (nisin) suggests that fatty acid composition is not the sole determinant of membrane fluidity and behavior.
The present work suggests a continuous adjustment of the membrane fluidity (average Δr/ΔT = 5.5 × 10⁻⁴) and identifies the time needed for adjustment. The fluidity and nisin MICs of strains NR30 and cld1 suggest that fatty acid composition can serve only as a preliminary tool to make predictions about membrane fluidity. Finally, as suggested by the NR30 results, a membrane with low odd and branched fatty acid is not necessarily more rigid than the wild type.
Acknowledgments
This research is supported by the USDA NRI Competitive Grants Program in Food Safety (grant no. 2006-01288).
We thank R. Ludescher for sharing his expertise in fluorospectrophotometry.
Footnotes
Published ahead of print on 17 August 2007.
REFERENCES
- 1.Annous, B. A., L. A. Becker, D. O. Bayles, D. P. Labeda, and B. J. Wilkinson. 1997. Critical role of anteiso-C15:0 fatty acid in the growth of Listeria monocytogenes at low temperatures. Appl. Environ. Microbiol. 63:3887-3894. [DOI] [PMC free article] [PubMed] [Google Scholar]
- 2.Bayles, D. O. 2004. Changes in heat resistance resulting from pH and nutritional shifts of acid-adapted and non-acid-adapted Listeria monocytogenes Scott A. J. Food Prot. 67:316-321. [DOI] [PubMed] [Google Scholar]
- 3.Becker, L. A., S. N. Evans, R. W. Hutkins, and A. K. Benson. 2000. Role of σB in adaptation of Listeria monocytogenes to growth at low temperature. J. Bacteriol. 182:7083-7087. [DOI] [PMC free article] [PubMed] [Google Scholar]
- 4.Bligh, E. G., and W. J. Dyer. 1959. A rapid method of total lipid extraction and purification. Can. J. Biochem. Physiol. 37:911-917. [DOI] [PubMed] [Google Scholar]
- 5.Bolton, L. F., and J. F. Frank. 1999. Simple method to observe the adaptive response of Listeria monocytogenes in food. Lett. Appl. Microbiol. 29:350-353. [DOI] [PubMed] [Google Scholar]
- 6.Bonnet, M., and T. J. Montville. 2005. Acid-tolerant Listeria monocytogenes persist in a model food system fermented with nisin-producing bacteria. Lett. Appl. Microbiol. 40:237-242. [DOI] [PubMed] [Google Scholar]
- 7.Crandall, A. D., and T. J. Montville. 1998. Nisin resistance in Listeria monocytogenes ATCC 700302 is a complex phenotype. Appl. Environ. Microbiol. 64:231-237. [DOI] [PMC free article] [PubMed] [Google Scholar]
- 8.Edgcomb, M. R., S. Sirimanne, B. J. Wilkinson, P. Drouin, and R. P. Morse. 2000. Electron paramagnetic resonance studies of the membrane fluidity of the foodborne pathogenic psychrotroph Listeria monocytogenes. Biochim. Biophys. Acta 1463:31-42. [DOI] [PubMed] [Google Scholar]
- 9.Farber, J. M., and P. I. Peterkin. 1991. Listeria monocytogenes, a food-borne pathogen. Microbiol. Rev. 55:476-511. [DOI] [PMC free article] [PubMed] [Google Scholar]
- 10.Fernandez Murga, M. L., D. Bernik, G. Font de Valdez, and A. E. Disalvo. 1999. Permeability and stability properties of membranes formed by lipids extracted from Lactobacillus acidophilus grown at different temperatures. Arch. Biochem. Biophys. 364:115-121. [DOI] [PubMed] [Google Scholar]
- 11.Gandhi, M., and M. L. Chikindas. 2007. Listeria: a foodborne pathogen that knows how to survive. Int. J. Food Microbiol. 113:1-15. [DOI] [PubMed] [Google Scholar]
- 12.Giotis, E. S., D. A. McDowell, I. S. Blair, and B. J. Wilkinson. 2007. Role of branched-chain fatty acids in pH stress tolerance in Listeria monocytogenes. Appl. Environ. Microbiol. 73:997-1001. [DOI] [PMC free article] [PubMed] [Google Scholar]
- 13.Hromy, J. M., and G. M. Carman. 1986. Reconstitution of Saccharomyces cerevisiae phosphatidylserine synthase into phospholipid vesicles. Modulation of activity by phospholipids. J. Biol. Chem. 261:15572-15576. [PubMed] [Google Scholar]
- 14.Jones, S. L., P. Drouin, B. J. Wilkinson, and P. D. Morse II. 2002. Correlation of long-range membrane order with temperature-dependent growth characteristics of parent and a cold-sensitive, branched-chain-fatty-acid-deficient mutant of Listeria monocytogenes. Arch. Microbiol. 177:217-222. [DOI] [PubMed] [Google Scholar]
- 15.Lakowicz, J. R. 1983. Principles of fluorescence spectroscopy. Plenum Press, New York, NY.
- 16.Lianou, A., J. D. Stopforth, Y. Yoon, M. Wiedmann, and J. Sofos. 2006. Growth and stress resistance variation in culture broth among Listeria monocytogenes strains of various serotypes and origins. J. Food Prot. 69:2640-2647. [DOI] [PubMed] [Google Scholar]
- 17.Loffhagen, N., C. Hartig, and W. Babel. 2004. Pseudomonas putida NCTC 10936 balances membrane fluidity in response to physical and chemical stress by changing the saturation degree and the trans/cis ratio of fatty acids. Biosci. Biotechnol. Biochem. 68:317-323. [DOI] [PubMed] [Google Scholar]
- 18.Mastronicolis, S. K., A. Boura, A. Karaliota, P. Magiatis, N. Arvanitis, C. Litos, A. Tsakirakis, P. Paraskevas, H. Moustaka, and G. Heropoulos. 2006. Effect of cold temperature on the composition of different lipid classes of the foodborne pathogen Listeria monocytogenes: focus on neutral lipids. Food Microbiol. 23:184-194. [DOI] [PubMed] [Google Scholar]
- 19.Mastronicolis, S. K., N. Arvanitis, A. Karaliota, C. Litos, G. Stavroulakis, H. Moustaka, A. Tsakirakis, and G. Heropoulos. 2005. Cold dependence of fatty acid profile of different lipid structures of Listeria monocytogenes. Food Microbiol. 22:213-219. [Google Scholar]
- 20.Mazzotta, A. S., and T. J. Montville. 1997. Nisin induces changes in membrane fatty acid composition of Listeria monocytogenes nisin-resistant strains at 10°C and 30°C. J. Appl. Microbiol. 82:32-38. [DOI] [PubMed] [Google Scholar]
- 21.McEntire, J. C., G. M. Carman, and T. J. Montville. 2004. Increased ATPase activity is responsible for acid sensitivity of nisin-resistant Listeria monocytogenes ATCC 700302. Appl. Environ. Microbiol. 70:2717-2721. [DOI] [PMC free article] [PubMed] [Google Scholar]
- 22.Mead, P. S., L. Slutsker, V. Dietz, L. F. McCaig, J. S. Bresee, C. Shapiro, P. M. Griffin, and R. V. Tauxe. 1999. Food-related illness and death in the United States. Emerg. Infect. Dis. 5:607-625. [DOI] [PMC free article] [PubMed] [Google Scholar]
- 23.Ming, X., and M. A. Daeschel. 1993. Nisin resistance of foodborne bacteria and the specific resistance responses of Listeria monocytogenes Scott A. J. Food Prot. 56:944-948. [DOI] [PubMed] [Google Scholar]
- 24.Mui, B., L. Chow, and M. J. Hope. 2003. Extrusion technique to generate liposomes of defined size. Methods Enzymol. 367:3-14. [DOI] [PubMed] [Google Scholar]
- 25.Püttmann, M., N. Ade, and H. Hof. 1993. Dependence of fatty acid composition of Listeria spp. on growth temperature. Res. Microbiol. 144:279-283. [DOI] [PubMed] [Google Scholar]
- 26.Rocourt, J., and P. Cossart. 1997. Listeria monocytogenes, p. 337-352. In M. P. Doyle, L. R. Beuchat, and T. J. Montville (ed.), Food microbiology: fundamentals and frontiers. ASM Press, Washington, DC.
- 27.Rodriguez-Vargas, S., A. Sánchez-Garcia, J. M. Martinez-Rivas, J. A. Prieto, and F. Randez-Gil. 2007. Fluidization of membrane lipids enhances the tolerance of Saccharomyces cerevisiae to freezing and salt stress. Appl. Environ. Microbiol. 73:110-116. [DOI] [PMC free article] [PubMed] [Google Scholar]
- 28.Russell, N. J., R. I. Evans, P. F. ter Steeg, J. Hellemons, A. Verheul, and T. Abee. 1995. Membranes as a target for stress adaptation. Int. J. Food Microbiol. 28:255-261. [DOI] [PubMed] [Google Scholar]
- 29.Schneiter, R., and A. Toulmay. 2007. The role of lipids in the biogenesis of integral membrane proteins. Appl. Microbiol. Biotechnol. 73:1224-1232. [DOI] [PubMed] [Google Scholar]
- 30.Sinensky, M. 1974. Homeoviscous adaptation—a homeostatic process that regulates the viscosity of membrane lipids in Escherichia coli. Proc. Natl. Acad. Sci. USA 71:522-525. [DOI] [PMC free article] [PubMed] [Google Scholar]
- 31.Slavik, J. 1996. Fluorescence microscopy and fluorescent probes, p. 306. Plenum Press, New York, NY.
- 32.Tasara, T., and R. Stephen. 2006. Cold stress tolerance of Listeria monocytogenes: a review of molecular adaptive mechanisms and food safety implications. J. Food Prot. 69:1473-1484. [DOI] [PubMed] [Google Scholar]
- 33.Vadyvaloo, V., J. W. Hastings, M. J. van der Merwe, and M. Rautenbach. 2002. Membranes of class IIa bacteriocin-resistant Listeria monocytogenes cells contain increased levels of desaturated and short-acyl-chain phosphatidylglycerols. Appl. Environ. Microbiol. 68:5223-5230. [DOI] [PMC free article] [PubMed] [Google Scholar]
- 34.van de Vossenberg, J. L.C.M., A. J. M. Driessen, M. S. da Costa, and W. N. Konings. 1999. Homeostasis of the membrane proton permeability in Bacillus subtilis grown at different temperatures. Biochim. Biophys. Acta 1419:97-104. [DOI] [PubMed] [Google Scholar]
- 35.White, G. F., K. I. Racher, A. Lipski, F. R. Hallett, and J. M. Wood. 2000. Physical properties of liposomes and proteoliposomes prepared from Escherichia coli polar lipids. Biochim. Biophys. Acta 1468:175-186. [DOI] [PubMed] [Google Scholar]
- 36.Winkowski, K., R. D. Ludescher, and T. J. Montville. 1996. Physicochemical characterization of the nisin-membrane interaction with liposomes derived from Listeria monocytogenes. Appl. Environ. Microbiol. 62:323-327. [DOI] [PMC free article] [PubMed] [Google Scholar]
- 37.Zhu, K., D. O. Bayles, A. Xiong, R. K. Jayaswal, and B. J. Wilkinson. 2005. Precursor and temperature modulation of fatty acid composition and growth of Listeria monocytogenes cold-sensitive mutants with transposon-interrupted branched-chain alpha-keto acid dehydrogenase. Microbiology 151:615-623. [DOI] [PubMed] [Google Scholar]


