

Abstract
Abnormal autonomic nerve traffic has been associated with a number of peripheral neuropathies and cardiovascular disorders prompting the development of genetically altered mice to study the genetic and molecular components of these diseases. Autonomic function in mice can be assessed by directly recording sympathetic nerve activity. However, murine sympathetic spikes are typically detected using a manually adjusted voltage threshold and no unsupervised detection methods have been developed for the mouse. Therefore, we tested the performance of several unsupervised spike detection algorithms on simulated murine renal sympathetic nerve recordings, including an automated amplitude discriminator and wavelet-based detection methods which used both the discrete wavelet transform (DWT) and the stationary wavelet transform (SWT) and several wavelet threshold rules. The parameters of the wavelet methods were optimized by comparing basal sympathetic activity to postmortem recordings and recordings made during pharmacological suppression and enhancement of sympathetic activity. In general, SWT methods were found to outperform amplitude discriminators and DWT methods with similar wavelet coefficient thresholding algorithms when presented with simulations with varied mean spike rates and signal-to-noise ratios. A SWT method which estimates the noise level using a “noise-only” wavelet scale and then selectively thresholds scales containing the physiologically important signal information was found to have the most robust spike detection. The proposed noise-level estimation method was also successfully validated during pharmacological interventions.
Keywords: Denoising, mice, spike detection, sympathetic nerve activity, wavelet
I. Introduction
THE autonomic nervous system has a broad range of functions, including the regulation of blood pressure, cardiac function, visceral function, and renal output. Abnormal autonomic function has been associated with such profound disorders as essential hypertension [1]-[3], obesity [1], [4], chronic renal disease [5], diabetes [6], [7], orthostatic intolerance [8], and congestive heart failure [9]. The many recent insights into the murine genome have motivated scientists to develop transgenic and gene targeted mouse models to better understand the genetic and molecular components of these diseases [10]-[15]. One method of assessing autonomic sympathetic function is to directly record renal sympathetic nerve activity (RSNA). Measurement of the RSNA in mice has been recently introduced [16]-[19] and there is some debate as to how it should be objectively quantified. The low-amplitude, multiunit sympathetic action potentials (APs) recorded from the renal nerve are significantly corrupted by high levels of bioelectric, mechanical, and environmental noise. Contamination from biological noise sources is particularly common in mice because many of the electrically active organs are in close proximity to the recording electrode due to the small frame of the animal.
Currently, the murine RSNA is quantified using two general strategies: 1) integrating the nerve signal over short periods of 5–10 s [16] or 2) using a hardware amplitude discriminator to detect APs [17]-[19]. The integration method is computationally efficient, but also indiscriminately integrates artifacts and noise and makes no correction for differences in AP amplitudes. For instance, several large amplitude APs with a low firing rate may produce the same value as many small APs with a high firing rate. The second approach using amplitude discrimination involves manually adjusting a voltage threshold trigger until the threshold exceeds the level of the noise. All signal amplitudes that exceed the threshold are detected as spikes [20]. The level of the murine RSNA threshold is typically established as the voltage at which no spikes are detected following a bolus injection of a pharmacological agent known to increase blood pressure and suppress the heart rate (HR) and RSNA via the baroreceptor-reflex, such as phenylephrine (PHE), [17], [18] (Fig. 1). Similarly, investigators studying the rat RSNA have used the highest voltage in the postmortem recording as a threshold for a subsequent off-line amplitude discrimination procedure [21]. Postmortem activity has also been used to correct total activity recorded during the experiment to obtain an estimate of the true neural activity in mice [19].
Fig. 1.
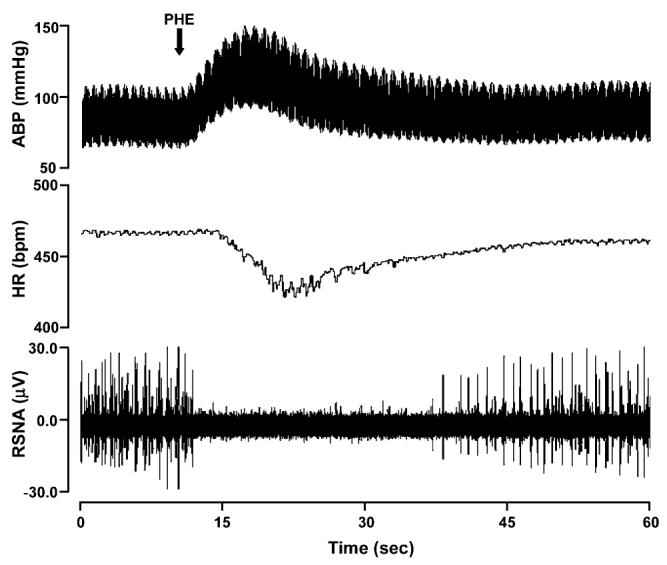
Representative affects of PHE bolus injection on murine arterial blood pressure, HR, and RSNA.
Both amplitude discrimination methods currently used in the processing of small animal RSNA signals have specific limitations. Selecting a threshold based on the maximum voltage level during baroreflex mediated decrease of sympathetic nerve activity necessitates having to perform pharmacological tests during each experimental protocol and it does not account for incomplete RSNA suppression due to the presence of baroreflex independent nerve activity. Further, this procedure can not be applied in mouse models that exhibit baroreflex dysfunction. A threshold procedure that uses the maximum voltage of the postmortem nerve recording can only be used for off-line analysis, may not be accurate due to changes in needle position throughout the recording, and does not take into account bioelectric noise present during the living state. The postmortem noise level is usually lower than the living state noise level due additional physiological activities and biological noise in the living animal. Threshold estimation following PHE bolus in the living mouse or after death can produce substantially different spike detection results, as illustrated in Fig. 2.
Fig. 2.
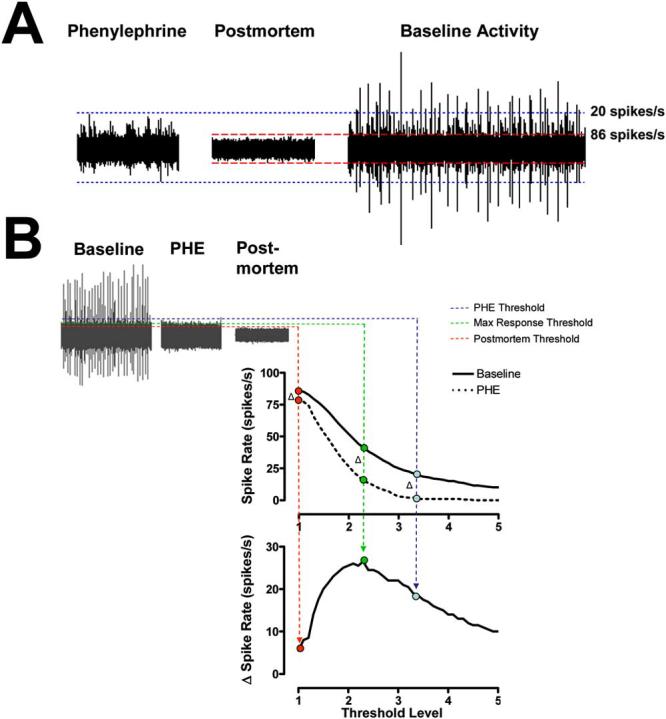
(A) Noise threshold estimates using recordings during baroreflex mediated suppression of RSNA using PHE bolus injection (left) and postmortem recordings (middle) in the same mouse. (B) The threshold value which yields the maximum change in spike rate from PHE to baseline (max Δ spike rate) is termed the optimal threshold level (green broken line). The nerve signal recorded during PHE bolus (red broken lines) overestimates the noise level and the postmortem recording (blue broken lines) underestimates the noise level.
Hardware amplitude discriminators also have several obvious general drawbacks. To begin, they require manual threshold selection which can be both tedious and subjective. Additionally, they only take into account the amplitude and duration of the waveform and disregard other potentially useful attributes such as shape and frequency content. Over the past several decades, a number of spike detection algorithms have taken advantage of these properties and improved upon the classic hardware amplitude discriminator approach, as discussed in several comprehensive reviews [22], [23]. Notable contributions to this field include the unsupervised amplitude discriminator, power or energy detectors, and the matched filter [24], [25]. Unsupervised amplitude discriminators typically establish a threshold by multiplying the standard deviation of the signal by some predetermined factor [26]. Power detectors compute the sum of squared amplitude using a sliding window and also use the standard deviation of the signal to create a threshold [24]. The accuracy of these methods has been shown to decrease significantly at low signal to noise ratios (SNRs) [24]. Matched filters generally increase the SNR of a signal by correlating signal amplitudes with template waveforms identified from the signal, particularly when a prewhitening filter is used [24], [25]. This process requires manual identification of the templates for each signal analyzed and is difficult to automate due to the changes in AP shapes that occur with different spatial relationships between the electrode and neurons [27].
Recently, use of the wavelet transform has become popular in multiunit AP discrimination [28]-[37]. Wavelet decomposition effectively filters the nerve signal into several frequency sub-bands while preserving its temporal structure. Each sub-band of wavelet processing decorrelates successive noise-related values and compares progressively more dilated versions of a general spike shape to each point in the signal, which is similar to a generalized group of matched filters coupled with prewhitening filters [31]. This process can ease the detection of APs by separating the signal and noise using their distinct time-frequency signatures. Several of these wavelet processing techniques are primarily concerned with the classification of APs from different cells [29], [30], [32], [36], [37], a process which follows detection and can be aided by an accurate detection algorithm that limits the number of false alarms detected. Oweiss, et al. [35] presented a wavelet method that uses information from several electrode channels but is not applicable to single channel, bipolar recordings of the renal nerve activity in mice. However, others have demonstrated that wavelet methods are suitable for unsupervised de-noising and detection of single channel, multiunit data with low signal-to-noise ratio [28], [31], [33], [34]. In particular, wavelet-based processing has been demonstrated to be effective in the detection of human sympathetic APs [28], suggesting that a wavelet detection method could be applied to the mouse sympathetic nerve activity.
In general, two wavelet decomposition techniques have been used for spike detection, the discrete wavelet transform (DWT) and the stationary wavelet transform (SWT). These techniques have different limitations. The DWT lacks translation invariance [38]-[43] while the SWT expands the amount of data by over-representing signals in the wavelet domain (for details see Section II-A). However, a formal comparison between the use of the DWT and SWT in spike detection has not yet been presented.
The primary aim of this paper is to develop an automated, wavelet-based method for spike detection in recordings of renal nerve activity specifically for mice. The parameters of this method will be determined using pharmacological interventions and simulated data, but will be applicable to other data sets. The accuracy of several different wavelet decomposition techniques and wavelet threshold algorithms will be compared to one another and to a general automated amplitude discriminator detection method.
II. Background
A. Signal Decomposition With the Discrete and Stationary Wavelet Transform
Several wavelet techniques have been introduced to project a signal, f, onto a set of dyadically-spaced scales on a time-frequency grid [44], [45] and have successfully been applied in the field of neuroscience [32], [46]. The two main discrete wavelet methods are known generally as the DWT and the SWT. Both methods use a mother wavelet,ψ, which can be translated and dilated according to the following equation (Matlab notation):
| (1) |
where ψj,k corresponds to the wavelet function at wavelet level j and temporal translation k. An increase in the wavelet level from j to j+1 results in a more dilated wavelet function, ψj+1,k, with a center frequency and bandwidth that is roughly half that of ψj,k.
The fast DWT algorithm proposed by Mallat decomposes f using a set of quadrature mirror decomposition filters,g0 and h0, that have respective bandpass and low-pass properties specific to each mother wavelet [45]. Equations (2) and (3) describe the DWT decomposition process. The broad scale, or approximation, coefficients are convolved separately with g0 and h0 and the result is down-sampled by two. This process splits the frequency information roughly in half, partitioning it into a set of fine scale, or detail coefficients and a coarser set of approximation coefficients . This procedure can be iteratively continued until the desired level of decomposition, j = J, is obtained. Note that the algorithm is initiated by setting
| (2) |
| (3) |
The coefficients can be reconstructed from and by placing a zero between each consecutive value found in and (e.g., up-sampling by two), convolving the results with the respective reconstruction filter, h0(−n) or g0(−n), and summing. This process can be iteratively continued until the original signal, f, is recovered
| (4) |
Down-sampling the DWT coefficients between each level acts to halve their effective sample frequency and halve the effective corner frequencies of the h0 and g0 filters for the next level of processing. Therefore, identical filters can be used for each step of the DWT procedure. The DWT has two main advantages: 1) Each step of the DWT requires half as many computations as the previous step; 2) The total number of DWT coefficients never exceeds N, the length of the original signal. A number of AP detection and classification algorithms currently use this decomposition technique [28], [32], [33], [35].
One complication that arises from the level-to-level decimation of the DWT coefficients, however, is a lack of translation invariance in the DWT representation of the signal [38]-[43]. Dyadically down-sampling the approximation and detail coefficients from f(n) leads to a completely different set of DWT coefficients than down-sampling the coefficients from its shifted version, f(n+1). Similarly, choosing to retain the odd wavelet coefficients during the dyadic down-sampling will result in a different outcome than retaining the even wavelet coefficients [38]-[43].
As a result of the shift variability of the DWT, several authors have used translation invariant decomposition techniques, such as the continuous wavelet transform or stationary wavelet transform (SWT), for the purpose of detecting APs [31], [34]. In contrast to the DWT, the SWT up-samples the decomposition filters by inserting zeros between every other filter coefficient and, consequently, avoids the translational variance problem caused by decimation [47]. Therefore, the SWT uses a set of level-dependent decomposition filters, hj and gj, which are the h0 and g0 filters with 2j − 1 zeros between each discrete filter coefficient. The SWT approximation and detail coefficients can then be computed using (5) and (6)
| (5) |
| (6) |
The SWT reconstruction process is similar to that of the DWT, although the reconstruction filters are level-dependent an include 2j − 1 zeros between each filter coefficients. This reconstruction process is described as follows:
| (7) |
Inserting zeros between the filter coefficients allows the SWT to analyze every possible shift of the signal while the effective sample rate at each wavelet level remains unchanged. In the frequency domain, up-sampling acts to halve the corner frequency of both the low-pass and high-pass decomposition filters, resulting in the same bandwidth decomposition as is found in the DWT. The result is a redundant, or over-complete, set of detail and approximation coefficients [39]. The drawbacks of the SWT algorithm include its increased computational complexity and the increased number of wavelet coefficients it generates. The general differences between the DWT and SWT are described in detail elsewhere [38]-[43]. Specific differences between DWT-and SWT-based spike detection in murine renal nerve recordings will be compared in this paper.
B. Wavelet-Based Spike Detection
Most wavelet-based spike detection algorithms include some modified form of a process known as wavelet de-noising [48]. In this process, a nerve signal with additive noise, f, is decomposed using either the DWT or SWT and a threshold is applied to each of the detail coefficient levels. All coefficients with an absolute value greater than the threshold are thought to be part of an AP and those below the threshold are presumably derived from noise. The noise coefficients can be set to zero and a noise-free signal can then be reconstructed and used for AP detection [28].
Several standard methods of deriving thresholds for wavelet de-noising have been suggested [48], [49]. A single-level noise estimation threshold is typically used in the case of stationary white noise with an unknown variance . In this case, the standard deviation of the noise related coefficients in all detail coefficient levels is equal to σW and is usually estimated using the level 1 detail coefficients (8) [48]. The corresponding threshold, Tw, can be applied to all levels of detail coefficients (9). In (8), the standard deviation of the noise is estimated using the median absolute deviation from zero (MAD) of the level 1 detail coefficients divided by the 75th percentile of the standard normal distribution, 0.6745. This method of estimating the standard deviation is typically used in wavelet de-noising because it less sensitive to outliers than the traditional calculation of the sample standard deviation [50]. In (9), N is the number of points in the signal and is the sample mean of the level 1 detail coefficients
| (8) |
| (9) |
In the case of correlated or colored noise, such as 1/frequency noise, the standard deviation of the noise is level dependent [49], [51]. This type of noise requires a level-dependent noise estimation threshold, Tj, which uses a level-dependent noise-level estimate, σj [(10) and (11)] [49]
| (10) |
| (11) |
Recently, K. Kim and S. Kim also made the observation that not all of the wavelet levels are necessary for spike detection, and additional levels could actually confound the detection process [31]. We have therefore elected to test both of these wavelet threshold techniques on the mouse RSNA signal using wavelet levels that contain physiologically important information, which will be described in a later section. We will demonstrate that a spike detector which uses the SWT and a single-level noise estimation threshold on select wavelet levels is more robust against changes in spike rate and SNR than an unsupervised amplitude discriminator or other wavelet-based methods.
III. Methods
A. Animal Experiments
Recordings from the renal nerve of 16 healthy C57BL/6J strain wild-type (10.1 ± 0.1 month; 31 ± 0.4 g) were used to determine the optimal parameters for wavelet-based spike detection. All protocols were approved by the Vanderbilt University Institutional Animal Care and Use Committee. Mice were anesthetized with 1.5% Isofluoran (in 100% Oxygen). Body temperature was maintained at 36 °C–37 °C with an isothermal pad (Braintree Scientific, Inc., Braintree, MA). A bipolar stainless steel wire electrode pair (electrode distance 1–1.5 mm, MedWire Corp, NY,) was hooked onto renal nerve of the left kidney. After adjusting the electrodes to obtain optimal signal quality, the electrodes were secured with silicone adhesive gel (QuickSeal, World Precision Instruments, Sarasota, FL) to ensure a relatively constant distance relationship between the neuron and electrode throughout the recording. The nerve signal was high-pass filtered (300 Hz) and amplified (gain 100 000) by a differential amplifier (ISO-80, World Precision Instruments, Sarasota, FL). Blood pressure was measured through a catheter in right femoral artery (Micro-Renathane, Braintree Scientific Inc, MA; PE-50, Becton Dickinson, Singapore) connected to a pressure transducer (DTX Plus-4812, Becton-Dickinson, Singapore) and carrier amplifier (13-4615-35, Gould Instruments, Cleveland, OH). Drugs were administered through a venous catheter (Micro-Renathane, MRE-025, Braintree Scientific Inc., MA) with an infusion pump (CMA/100, CMA, Sweden). Heart rate, blood pressure, and renal sympathetic nerve traffic were recorded for 5 min to determine baseline levels and then during intravenous administration of PHE (30 μg/kg, 40 μg/kg) or sodium nitroprusside (30 μg/kg, 40μg/kg), bolus injection. 1 min baseline and 2 min after bolus injection was analyzed. At the end of experiment, animals were euthanized with an overdose of urethane bolus and the renal nerve signal was recorded postmortem. The signals were recorded using a WINDAQ data acquisition system (DI410, DATAQ, Acron, OH) with 14–bit resolution at 10 000–Hz sample frequency. The data were processed off-line using customized software written in the Matlab environment (The MathWorks, Inc., Natick, MA).
B. Determination of the Physiologically Important Frequency Range
The physiological frequency range of the baroreflex-related mouse RSNA was determined as the range of frequencies over which the most dominant changes in 1) average power spectral density; 2) wavelet-level variance were observed during baroreflex mediated pharmacological suppression and enhancement of the RSNA and after death, when no vital activity is present. These observations were used to determine which frequency range and wavelet levels are important for the detection of spikes in the mouse RSNA.
1) Changes in Power Spectral Density
The Welch Periodogram method [52] was used to compute estimates of the power spectral density (PSD) in the mouse RSNA recorded during periods of baseline, NTP bolus injection (increase of nerve activity), PHE bolus injection (suppression of nerve activity), and postmortem (no vital activity) in nine mice. Twenty-second signals recorded during each physiologic intervention were divided into 1-s segments that overlapped by 50%. Each segment was detrended, multiplied by a Hamming window, and zero-padded. The power was estimated as the area under the PSD curve and normalized by the baseline variance. Spectral smoothing was then performed using a 20 point moving average. The frequency range over which the maximum changes in PSD occurred was determined to be the physiologically important range.
2) Changes in Wavelet-Level Standard Deviation
The standard deviation of each level of detail coefficients and in the signal itself was calculated using the median absolute deviation from zero (MAD) divided by 0.6745 (10) in all subsequent SWT, DWT, and amplitude discriminator methods. Changes in the standard deviation from baseline to PHE and postmortem periods were also assessed in the signal and each of the detail coefficient levels. All signal coefficient values were normalized to the respective baseline signal variance. The Mann-Whitney or Wilcoxon test with a significance level of 0.05 was used for statistical analysis.
C. Simulated Signal Construction
Simulated signals were constructed with templates extracted from the baseline periods of six RSNA recordings with sufficiently high SNRs (Fig. 3). The templates were then randomly inserted into neural noise taken from the postmortem recordings with a length of one minute. The interspike intervals were randomly assigned according to a Poisson distribution [53] with a minimum refractory period of 10 ms between spikes. Each simulation was assigned either a low (10 spike/s), medium (30 spike/s), or high mean spike rate (60 spike/s). The SNR of the simulations was altered from 5 (high signal quality) to 1 (poor signal quality). The SNR was defined as the ratio between the absolute peak amplitude of the AP and the standard deviation of the noise, as defined elsewhere [28], [34].
Fig. 3.
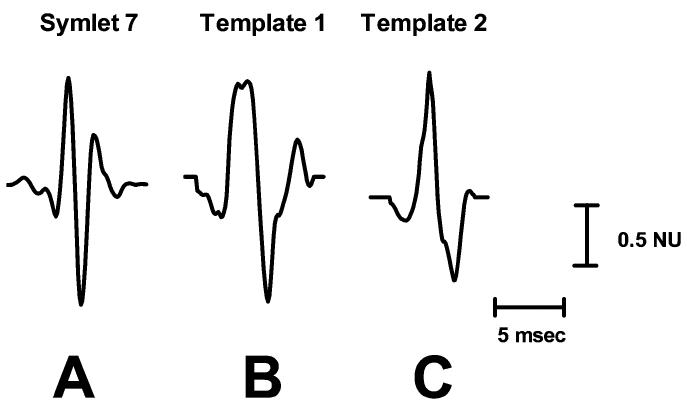
The symlet 7 wavelet (A) and two representative mouse sympathetic AP templates, (B) and (C), used in the simulations. Amplitudes are displayed in units normalized to the largest absolute value in each waveform (Normalized Units; NU).
The simulated signals were used to test the performance of several wavelet-based algorithms and an unsupervised amplitude discriminator, diagramed in Fig. 4. Four wavelet algorithms were tested using the following combinations: 1) SWT decomposition with a single-level noise estimation threshold (SWTS); 2) SWT decomposition with a level-dependent noise estimation threshold (SWTD); 3) DWT decomposition with a single-level noise estimation threshold (DWTS); 4) DWT decomposition with a level-dependent noise estimation threshold (DWTD). The decomposition methods and thresholds were discussed in detail in Sections II-A and II-B, respectively. Each of the wavelet techniques used the same mother wavelet, symlet 7 (Fig. 3), due to its morphological similarities to an average sympathetic spike and because it has been shown to impose less distortion on sympathetic spikes during de-noising than other commonly used wavelets, such as Daubechies 4 [28]. Each simulated signal was decomposed into five levels of detail coefficients and one level of approximation coefficients. Five was chosen as the maximum decomposition level because levels higher than 5 were found to contain primarily noise. Only wavelet levels that were deemed to have physiological significance to the mouse RSNA spikes (determined later in Section IV-A) were used in the thresholding process, and all other wavelet coefficients were set to zero. After the signal is decomposed and thresholded, the de-noised signal was reconstructed and the APs were detected using a simple peak detection scheme that locates maxima above 99% of the signal energy, as described previously [28].
Fig. 4.
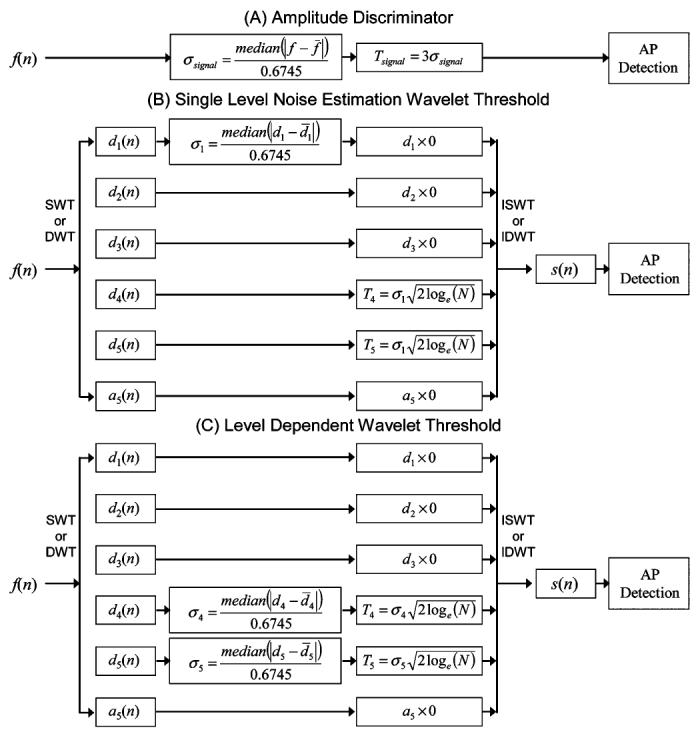
Block diagram of all detection methods. (A) Unsupervised amplitude discriminator. (B) Single-level noise estimation wavelet threshold used with either the SWT or DWT. (C) Level-dependent noise estimation wavelet threshold used with the SWT or DWT.
The unsupervised amplitude discriminator detected all absolute values greater than three times the standard deviation of the signal as discussed elsewhere [26].
Both the amplitude discriminator and the wavelet detection used a window length of 6 ms, which was observed to be the maximum duration of a mouse RSNA spike.
The performances of the five methods were quantified using the percent of correctly detected APs (PCD) and the percent of false alarms (PFA)
| (12) |
| (13) |
where NCD is the number of correctly detected APs, NAP is the number of APs inserted into the simulation, and NFA is the number of false alarms.
D. Verification of Threshold Using Physiological Data
A physiologic verification of the threshold was performed using pharmacologic data in mice. PHE increases blood pressure and induces a baroreflex mediated suppression of RSNA, as demonstrated in Fig. 1. Rather than using the maximum absolute voltage level during baroreflex mediated decrease of sympathetic nerve activity [Fig. 2(A)], we determined which thresholds would yield the maximum change in the detected spike rate from a baseline period to the period following a PHE bolus injection by systematically varying the threshold level and recording the corresponding maximum delta spike rate. Fig. 2(B) demonstrates that the “optimal” amplitude discriminator threshold determined by the maximum response is neither the maximum voltage level during PHE depression nor the postmortem noise level but an intermediate value [Fig. 2(B)].
We applied the “maximum response optimization” approach to determine the optimal threshold value for each wavelet level that comprised the RSNA frequency range. In detail, renal nerve recordings that contained 60 s of baseline activity followed by approximately 60 s of reduced nerve activity after PHE bolus injection were decomposed using the SWT. A systematic search for the optimal threshold value was then performed on each detail coefficient level found to hold physiologically important information. For all combinations of threshold values (which varied from 0 to 5 σj for each wavelet level of interest) the detail coefficients with an absolute value above the threshold were unmodified. All other coefficients were set to zero. The signal was then reconstructed and spikes were detected using the same procedure described in Section III-C. The spike-rate was then computed using a 1-s sliding window. The criterion used to determine the optimal combination of thresholds was defined as the maximum difference between the median spike rate during baseline and the minimum spike rate after PHE bolus injection. The optimal threshold values were then compared to those used in the single-level noise estimation thresholding scheme. Data from all 16 mice were used during this verification.
IV. Results
A. Determination of Physiologically Important Frequency Range
1) Changes in Power Spectral Density
The average normalized power spectral density (PSD) of the renal nerve activity during periods of baseline, NTP bolus injection, PHE bolus injection, and postmortem is depicted in Fig. 5(A). Power in the range of 100 Hz to 1000 Hz was dominant during all interventions in the living animal but was significantly abolished postmortem. The power in this range was increased after NTP bolus injection and decreased after PHE bolus injection. Complete suppression of renal nerve activity was not always achieved during the highest dose of PHE, but this residual activity is abolished in the euthanized animal. This suggests the presence of other renal nerve activity independent of the baroreflex (as presented in Fig. 2). Above 1000 Hz, the average power remains relatively consistent during the baseline, postmortem, PHE and NTP recordings, indicating that these levels are unaffected by the RSNA and contain mostly noise.
Fig. 5.
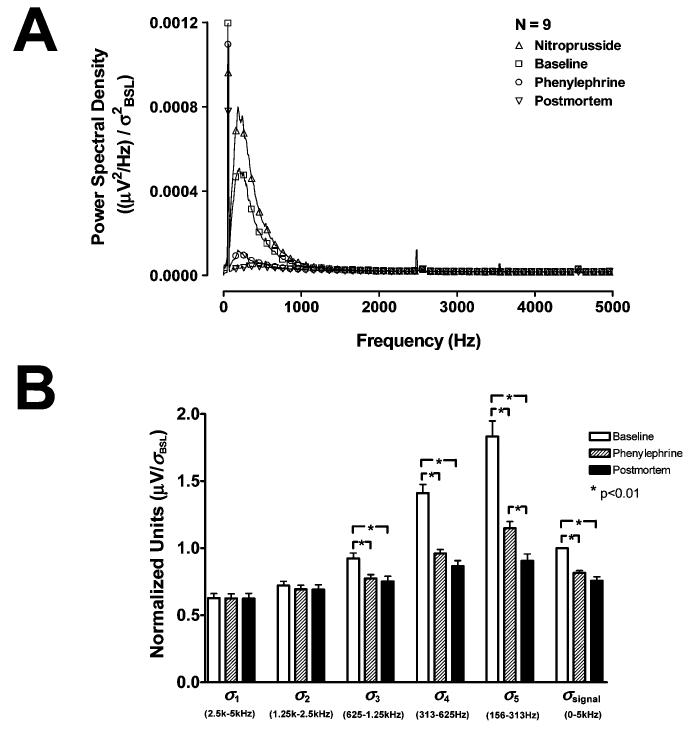
(A) Average normalized PSD of renal nerve recordings during nitroprusside (Δ), baseline (□), PHE (O), and postmortem (∇) periods. (B) Normalized standard deviations of the detail coefficient levels and the signal during baseline (white), after PHE bolus injection (hatched), and postmortem (black). The changes in the standard deviation of detail levels 1 and 2 (σ1 and σ2) are minimal, but changes in the standard deviations of the level 3, 4, and 5 detail coefficients (σ3 – σ5) and the signal (σsignal) are significant during PHE and postmortem.
2) Changes in Wavelet-Level Standard Deviation
To demonstrate the relationship between the power spectral density and the variance of the wavelet coefficients and determine the wavelet levels with physiologically important information, the change in the detail coefficient standard deviations (σ1 – σ5 for detail levels 1–5) from baseline to post-PHE bolus injection and postmortem periods were compared Fig. 5(B). The level 3, 4, and 5 SWT detail coefficients have approximate respective frequency ranges of 625 –1250 Hz, 313 –625 Hz, and 156 –313 Hz for data collected at 10 000 samples/s. The power in these frequency ranges demonstrated the most pronounced changes during the pharmacological interventions and after death [Fig. 5(A)]. Consequently, the standard deviation of these detail levels (σ3 – σ5) were found to drop significantly during PHE and postmortem [p < 0.01, Fig. 5(B)]. The level 1 and 2 detail coefficients have approximate frequency ranges of 2500 –5000 Hz and 1250–2500 Hz, respectively. The power in these frequency ranges did not change significantly during any of the interventions Fig. 5(A), nor did σ1 and σ2 Fig. 5(B) The standard deviation of the signal (σsignal) also undergoes a significant decline during these periods (p < 0.01).
The detail coefficients can now be separated into levels that contain the RSNA signal plus noise and levels which contain noise only. Since both the power in the frequency ranges of the level 4 and 5 detail coefficients and the standard deviation of the coefficients themselves demonstrate significant changes during pharmacological tests and after death, they are assumed to contain the majority of the information associated with sympathetic spikes. Thus, only the level 4 and 5 detail coefficients will be subject to thresholding in each of the wavelet methods mentioned in Section III-C during the simulations. All wavelet coefficients that either fall below the threshold or are found in other levels, including the level 5 approximation coefficients, will be considered noise-related and set to zero. The level 3 detail coefficients were not included in the threshold operation because the changes in spectral power and standard deviation in this level during pharmacological tests and postmortem were not as pronounced and could result in a significant number of false alarms in signals with very low SNRs. The standard deviation of the level 1 detail coefficients, σ1, will be used in the single-level noise estimation threshold [as shown in (8) and (9)] because it was shown to remain constant throughout the pharmacological interventions and postmortem.
B. Simulation Results
The detection performance of the unsupervised amplitude discriminator, SWTS, SWTD, DWTS, and DWTD is described in Fig. 6. The percent of correctly detected spikes (PCD, top) and percent of false alarms (PFA, bottom) are displayed for low (left), medium (middle), and high mean spike rates at various SNRs (Fig. 6).
Fig. 6.

Mean results for simulations with varied noise levels and mean spike rates. The simulations tested the performance of an unsupervised amplitude discriminator, SWT decomposition with thresholds based on single level (SWTS) and level-dependent (SWTD) noise estimation, and DWT decomposition with thresholds based on single level (DWTS) and level-dependent (DWTD) noise estimation. Each point on each curve represents the mean result of 102 simulations.
The detection performance of the amplitude discriminator method was found to be highly dependent on the mean spike rate (Fig. 6). It demonstrated a high percent of correct detections for signals with low and medium spike rates, but also detected the highest percent of false alarms during most SNRs and mean spike rate situations in these simulated signals.
The detection performance of the SWT and DWT methods with level-dependent noise estimation (SWTD and DWTD) also demonstrated a large dependence on the mean spike rate (Fig. 6). As spike rate increased, the percent of correct detections of the methods with level-dependent noise estimation began to drop off at higher values of SNR. The SWT and DWT methods with single-level noise estimation thresholds (SWTS and DWTS) show much more consistent patterns in their percent of correct detections during changes in mean spike rate. The single-level noise estimation methods also generally had a higher percent of false alarms than their level-dependent counter parts, but the percent of false alarms for all wavelet methods was below 15% for all SNRs greater than 1.5 during all mean spike rate scenarios.
The SWT methods correctly identified a higher percentage of the inserted APs than the DWT methods with the same threshold criteria for all SNRs and mean spike rates (e.g., SWTS > DWTS and SWTD > DWTD). The percent of false alarms was similar for SWT and DWT methods with the same threshold criteria. The SWTS method (stationary wavelet transform with a single-level noise estimation criteria) seemed to exhibit the most consistent performance on the simulated murine sympathetic nerve recordings. The percent of correct detections for this spike detection method remained above 75% and the percent of false alarms remained below 10% for all spike rates and all SNRs above 1.8. Although the discriminator had a higher percent of correct detections than the SWTS at very low SNRs (SNR < 1.6), it also produced a significantly higher percent of false alarms during these SNRs as well.
C. Threshold Verification Using Physiological Data
Renal nerve recordings that contained 60 s of baseline activity followed by approximately 60 s of reduced activity after PHE bolus injection were used to determine the optimal threshold value in each wavelet-level that comprised the RSNA frequency range. The threshold in each of the wavelet levels of interest, levels 4(T4) and 5(T5), was systematically varied until the threshold combination which produced the maximum difference between the median detected spike rate during baseline and the minimum detected spike rate after administration of the PHE bolus was determined ( and ). Fig. 7(A) demonstrates a representative example of the results of this search normalized by σ1 the standard deviation of the level 1 detail coefficients. From (9) we can see that . For the signals used in this section, N = 120s × 10,000 Hz and . In Fig. 7(A), the maximum delta spike rate ( and , the dark red region) is near the single-level noise estimation threshold, i.e., T4/σ1 ≈ 5.29 (the white circle).
Fig. 7.
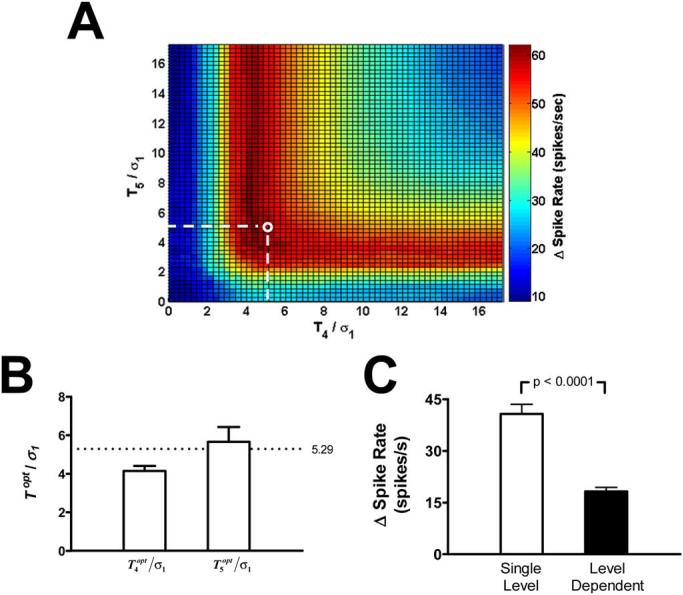
(A) Representative example of the search for the optimal threshold combination for the level 4 and 5 detail coefficients (T4 and T5) normalized by the standard deviation of the level 1 detail coefficients. (B) The mean values for the normalized and for 16 mice. In both cases, the maximum response thresholds come close to the standard value calculated from (8) [5.29; white circle in (A) and broken line in (B)]. (C) Mean changes in the detected spike rate from baseline to after PHE bolus injection (Δ spike rate) using two different SWT threshold algorithms. The single-level noise estimation threshold (white) detected a significantly greater response to the PHE bolus than the level-dependent noise estimation threshold (black). Error bars indicate SE.
The threshold values and were determined for 16 mice and normalized using the single-level noise normalization, i.e., dividing by σ1 Fig. 7(B). The average normalized values for both level 4 and 5 are near the standard value of 5.29.
The SWT methods using the single-level and level-dependent noise estimation thresholds were both used to detect the change in the detected spike rate from baseline to after PHE bolus injection in the same 16 mouse renal nerve recordings [Fig. 7(C)]. The single-level noise estimation threshold detected a significantly greater response to the PHE bolus than the level-dependent noise estimation threshold.
V. Discussion
The aim of this paper was to devise an automated spike detection system specifically for mouse RSNA which could be used as an alternative to the currently used approaches of RSNA integration and hardware amplitude discriminators. Although we have only presented data for this specific neural signal, this type of optimization process and some of the results may be applicable to other types of neural data.
We have shown that wavelet methods had a more robust performance than amplitude discriminators when presented with simulated mouse sympathetic nerve signals with different spike rates and SNRs. Additionally, the DWT methods, which lack translation invariance, were outperformed by translation invariant SWT methods with the same threshold criteria. The single-level noise estimation threshold criteria was also shown to be less dependent on changes in mean spike rate in simulated mouse renal nerve recordings than level-dependent noise estimation threshold algorithms. The choice of a single-level noise estimate was also close to the maximum response thresholds determined using the physiological PHE bolus data.
Johnstone and Silverman demonstrated that the SWT has better de-noising performance than the DWT for data contaminated with neurophysiological noise [49]. They have also suggested that the limitations of the DWT are more apparent for signals with low signal-to-noise ratios (SNR) and sharp discontinuities [49]. Murine RSNA APs posses these characteristics and, consequently, a spike detection procedure based on the DWT is less effective than one which uses the SWT. The simulated scenario in Fig. 8 demonstrates how the translation variability found in the DWT reduces the likelihood of an RSNA APs being detected. Each peak in the RSNA AP occupies a very short period, approximately 1 ms, or 10 points of a signal sampled at 10 000 Hz. After two levels of decimation, less than two or three peak points remain. In the simulated RSNA signal depicted in Fig. 8, down-sampling by eliminating odd and even coefficients significantly alters the DWT representation and, as a result, the detection performance of the DWT algorithm. The SWT, however, is able to detect both APs. This would account for the lower percentage of correctly detected APs in the DWT-based detection algorithms in our simulations and may play a role in any DWT-based detection or discrimination of neural data.
Fig. 8.
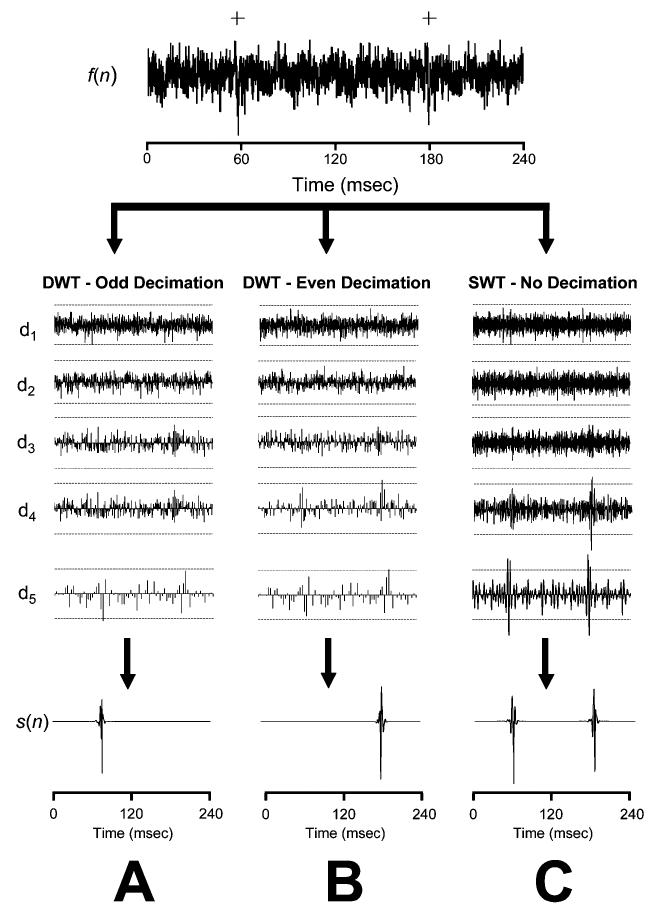
Detection performance using the DWT and SWT de-noising. The top row contains a simulated signal, f(n), containing two APs (+). The middle rows contain detail coefficient for levels 1–5 (d1 – d5) obtained using either (A) the DWT with odd down-sampling, (B) the DWT with even down-sampling, or (C) the SWT. Broken lines in d1 – d5 are standard thresholds [(8) and (9)] and the bottom row is the reconstructed noise-free spike train, s(n). Decimating the odd coefficients eliminates the detail coefficients that represent the second AP, while even decimation abolishes the first AP. Both APs are detected using the SWT method because it does not down-sample the detail coefficients.
One key feature common to both wavelet and amplitude-discriminator-based detection methods is a threshold rule based on some estimate of the noise level. A robust threshold rule should accurately reflect the noise level, but should be unaffected by changes in spike rate or spike amplitude. In the case of the murine RNSA, the spike rate can be non-stationary, particularly when different pharmacological agents are introduced. Both the automated amplitude discriminator and the wavelet methods with a level-dependent noise threshold, however, were significantly affected by changes in spike rate. For example, the standard deviation of the level 4 and 5 detail coefficients change significantly during the PHE and postmortem recordings, and these changes are presumed to be primarily caused by changes in the mean spike rate during these states [Fig. 5(B)]. We have also observed that the standard deviation of simulated signals (σsignal) and the standard deviation of their detail levels in the frequency range of the RSNA spikes (σ4 and σ5) increase with spike rate. For instance, simulated signals with identical noise and mean spike rates of 0, 35, and 75 spikes/s resulted in σsignal of 0.25, 0.295, and 0.365 normalized unit (NU) and σ5 of 0.25, 0.43 and 1.12 NU. However, the standard deviation of the level 1 detail coefficients, σ1, remained almost constant (0.25, 0.253, 0.256 NU) for all spike rates. Therefore, a threshold selection rule that relates the noise level of the level 1, or “noise-only”, detail coefficients to the threshold for the level 4 and 5, or “signal concentrated,” detail coefficients, such as the single-level noise threshold rule, may be more appropriate detection in nerve signals with highly variable mean spike rates. The maximum response thresholds determined with the PHE bolus data also suggested that the use of the single-level noise estimation threshold was more suitable than the use of a level-dependent noise estimation threshold (Fig. 7).
In light of these findings, we advocate the use of an SWT algorithm with a single-level noise estimation threshold for the detection of APs in the murine RSNA. This method was shown to be the most robust when presented with variable spike rates and SNRs. Several previous publications have used the wavelet transform for the specific purpose of spike detection in similar multiunit neural data [28], [31], [33], [34], [54]. Kim, et al. (2003) suggested a novel AP detection method for nerve recordings with low SNR which combined selected scales of the SWT using point-wise multiplication and smoothing with a Bartlett window [31] and Olkkonen, et al. (2006) demonstrated a Hilbert assisted DWT to improve SNR in nerve signals [54]. However, neither author discusses a method to objectively automate a threshold selection process. Both Nakatani, et al. [33] and Diedrich, et al. [28] demonstrated automated methods for colored, normally distributed neural noise. Each implemented a level-dependent threshold by extrapolating the parameters of the noise distribution by fitting a Gaussian to the central quantiles of the detail coefficient amplitudes at each wavelet level. This method assumes that the contribution of the AP waveforms to the central quantiles of the distribution is negligible, an assumption that is valid for lower spike rates but fails for higher spike rates. Both authors do not test their technique under conditions of variable spike rates.
Nenadic, et al. [34] uses the continuous wavelet transform (CWT) and a level-dependent threshold to make an initial separation of signal and noise for the purpose of parameter estimation prior to hypothesis-based spike detection. This technique is validated using simulations with different spike rates and SNR. Our results demonstrate that the level-dependent threshold drastically over estimates wavelet noise levels at high spike rates, resulting in significant missed detections (Fig. 6). The discrepancy of these results may lie in the type of neural data used. The former study involved recordings from CNS neurons with a relatively high conduction velocity, whereas our recordings were derived from unmyelinated peripheral neurons with a slower conducting speed (Fig. 3). The longer duration of the sympathetic APs yields more high-amplitude points per unit time for each spike, which has a dramatic affect on the level-dependent noise estimate, particularly at high firing rates. Although the noise in both the signal and simulations used here are colored, the single-level noise estimation threshold was useful because it relates the noise level in a wavelet band that is unrelated to the physiological signal information to the wavelet levels that contain signal plus noise and avoids overestimating the threshold in these levels at high firing rates.
A. Limitations
One significant limitation to using the SWT as opposed to the amplitude discriminator or the DWT is the increase in computational complexity. While the amplitude discriminator requires no transformation, the DWT requires O(N) operations and the SWT requires O(N log(N)) operations [40], which may pose a problem when applying such a method to more complex problems, such as nerve signals recorded from a multi-electrode array. However, the SWT requires less computational complexity than the CWT, an O(N2) process which has been used in previous spike detection methods [34]. A second limitation is the assumption that all of the recorded APs will have a shape similar to the symlet 7 wavelet or one of its dilations at higher wavelet levels. Although the waveforms identified in our recordings were relatively similar to those depicted in Fig. 3, different neuron-electrode geometries have been observed to result in very different AP morphologies [27] and this should be considered when implementing such a method. In this study we focused on the detection of APs and chose not to examine the sorting of waveforms, which is typically handled following detection. As a consequence, the amount of AP overlap in the simulations was limited. Significant AP overlap may cause multiple, overlapped APs to be detected as 1 AP. In this case an additional waveform classifier would be required to separate the overlapped waveforms. This has been proposed previously [28].
Extension of this method to other types of neural data and signals with transient spikes would require a similar form of optimization process and simulated data to objectively assess detection quality. The optimization process described here could be difficult without the use of either pharmacological or postmortem recordings. However, physiological interventions may be used in order to characterize the noise process contaminating other neural data. For instance, in the case of the human muscle sympathetic nerve activity (MSNA), a noise component may be obtained during Phase IV of the Valsalva maneuver which is characterized by an increase in blood pressure beyond baseline levels and, consequently, a dramatic reduction in sympathetic nerve activity in healthy subjects [55]. The wavelet levels used in this optimization may also differ for other signals. The APs found in the MSNA, for example, have a similar shape to murine RSNA spikes, but have a much shorter duration [28]. As a result, the power of the MSNA spikes was found to be concentrated between 700 and 2000 Hz [28], and would require thresholding of the level 2 and 3 wavelet coefficients for 10–kHz recordings.
B. Conclusion
An automated spike detection method for mouse sympathetic nerve activity would eliminate the need for establishing a subjective manual threshold or using integrated nerve activity. Furthermore, unsupervised spike detection allows for the possibility of AP classification and subsequent single-unit analysis of sympathetic nerve activity, which has been shown to hold useful information [56]-[60]. In conclusion, spike detection using the SWT is a potentially useful tool in the study of autonomic dysfunction in mice and may have implications for the study of various cardiovascular disorders.
ACKNOWLEDGMENT
The authors would like to thank C. Finney for the technical support of this study.
Biography
 Robert J. Brychta (M'06) received the B.S. degree in biology from Ursinus College, Collegeville, PA, where he graduated with highest honors in 2000. He defended the Ph.D. thesis entitled “Wavelet based analysis of autonomic signals” with excellence in 2006.
He has worked with the Vanderbilt Autonomic Dysfunction Center for the past five years. His main research interests include biomedical signal processing, biomedical pattern recognition, and autonomic control of the cardiovascular system.
Dr. Brychta is a member of the Sigma Pi Sigma, Beta Beta Beta, and Phi Beta Kappa honors societies.
 Sunti Tuntrakool received B.S. degree in industrial education in telecommunication engineering major from King Mongkut's Institute of Technology Ladkrabang, Ladkrabang, Bangkok, Thailand, in 1993 and the M.S. degree in electrical engineering from Vanderbilt University, Nashville TN, in 2004. Currently he is pursuing the Ph.D. degree in electrical engineering at Vanderbilt University.
He has been a Lecturer at the Department of Engineering Education, Faculty of Industrial Education, King Mongkut's Institute of Technology. His research interests include digital signal processing, biomedical signal processing, mouse renal sympathetic nerve activity, and autonomic control of the cardiovascular system.
 Martin Appalsamy received the B.S. degree in biology from University of Guyana, South America, in 1964.
He has been working with the Vanderbilt Autonomic Dysfunction Center, Nashville, TN, for the past 20 years. He is the Lab Manager of the mice laboratory of the Vanderbilt Autonomic Dysfunction Center. He has developed a university-wide reputation for skill and knowledge in the conduct of complex physiological studies in rats and mice including renal nerve recordings.
 Nancy R. Keller received the B.S. degree in health related professions from the University of Arizona, Tempe, in 1986. She received the Ph.D. degree in pathology from Vanderbilt University, Nashville, TN, in 2000, specializing in reproductive biology.
She joined the Autonomic Dysfunction Center at Vanderbilt in 2000 as a Postdoctoral Fellow, and in 2003 became an Instructor in Medicine. She continues to investigate the gender basis of disease as well as animal physiology, using mouse models of autonomic dysfunction.
Dr. Keller was awarded a BIRCWH scholarship.
 David Robertson graduated from Vanderbilt University, Nashville, TN, with a major in Germanic and Slavic Languages, in 1969. He received the M.D. degree from the same university in 1973.
He is the Elton Yates Professor of Medicine, Pharmacology and Neurology at Vanderbilt University, where he directs the General Clinical Research Center and the Center for Space Physiology and Medicine. He did his house staff training at Johns Hopkins Hospital, Baltimore, MD, serving as Chief Resident on the Osler Medical Service. He returned to Vanderbilt University in 1978 and established the Autonomic Dysfunction Center which became the major international referral clinic for autonomic disorders. His clinical investigations with collaborators at Vanderbilt University led to the discovery of two genetic disorders (DBH deficiency and NET deficiency) and elucidation of two acquired disorders (neuropathic postural tachycardia syndrome and selective baroreflex failure). In 1989, he founded the American Autonomic Society as an international organization for autonomic neuroscience. He and his colleagues also conducted studies on autonomic effects of microgravity and had experiments aboard the Neurolab Mission of the Shuttle Columbia in 1997 and the Mir Space Station in 1998.
 Richard G. Shiavi (S'68–M'72–SM'91) received the M.S. and Ph.D. degrees in biomedical engineering from Drexel University, Philadelphia, PA, in 1969 and 1972, respectively.
Since 1972, he has been actively engaged in teaching and research at Vanderbilt University, Nashville, TN, and is currently Professor of Biomedical Engineering. His main professional interests are in signal processing, in particular bioelectric signal processing. More recently, he has been involved with innovations in engineering education.
Dr. Shiavi has been an active member of IEEE and has served in the EMBS in various capacities. In 1996 he was appointed as a Fellow in the American Institute for Medical and Biological Engineering.
 André Diedrich was born in Magdeburg, Germany, February 7, 1961. He studied medicine/medical cybernetics and received the M.D. degree at the 2nd Medical Institute in Moscow, Russia, in 1985. He specialized in pathophysiology and received the Ph.D. degree in medicine in 1991 at the Humboldt University, Berlin, Germany.
His major fields are sleep, cardiovascular research, and space physiology. He was awarded with an external fellowship of the European Space Agency in 1996. He learned microneurographic techniques to study the baroreflex in humans at Dr. D. L. Eckberg's laboratory at Virginia Commonwealth University, Richmond, VA, in 1996 to 1997. He was a member of the team which studied cardiovascular effects in space at the “Neurolab” NASA space shuttle mission STS90. He received a fellowship at the Vanderbilt University, Nashville, TN, from 1997 to 2000. He is a Research Assistant Professor in Medicine at Vanderbilt University since 2000.
Dr. Diedrich is a member of the American Heart Association and American Autonomic Society.
Footnotes
This work was supported in part by National Institutes of Health (NIH) under Grant M01 RR00095, Grant 1R41-AG19576-01A1, and 1PO1 HL56693.
REFERENCES
- 1.Gudbjornsdottir S, Lonnroth P, Sverrisdottir YB, Wallin BG, Elam M. Sympathetic nerve activity and insulin in obese normotensive and hypertensive men. Hypertension. 1996;27:276–280. doi: 10.1161/01.hyp.27.2.276. [DOI] [PubMed] [Google Scholar]
- 2.Mark AL. The sympathetic nervous system in hypertension: A potential long-term regulator of arterial pressure. J. Hypertens. Suppl. 1996;14:S159–S165. [PubMed] [Google Scholar]
- 3.Wallin BG, Sundlof G. A quantitative study of muscle nerve sympathetic activity in resting normotensive and hypertensive subjects. Hypertension. 1979;1:67–77. doi: 10.1161/01.hyp.1.2.67. [DOI] [PubMed] [Google Scholar]
- 4.Andersson B, Elam M, Wallin BG, Bjorntorp P, Andersson OK. Effect of energy-restricted diet on sympathetic muscle nerve activity in obese women. Hypertension. 1991;18:783–789. doi: 10.1161/01.hyp.18.6.783. [DOI] [PubMed] [Google Scholar]
- 5.Klein IH, Ligtenberg G, Neumann J, Oey PL, Koomans HA, Blankestijn PJ. Sympathetic nerve activity is inappropriately increased in chronic renal disease. J. Am. Soc. Nephrol. 2003;14:3239–3244. doi: 10.1097/01.asn.0000098687.01005.a5. [DOI] [PubMed] [Google Scholar]
- 6.Huggett RJ, Scott EM, Gilbey SG, Stoker JB, Mackintosh AF, Mary DA. Impact of type 2 diabetes mellitus on sympathetic neural mechanisms in hypertension. Circulation. 2003;108:3097–3101. doi: 10.1161/01.CIR.0000103123.66264.FE. [DOI] [PubMed] [Google Scholar]
- 7.Huggett RJ, Scott EM, Gilbey SG, Bannister J, Mackintosh AF, Mary DA. Disparity of autonomic control in type 2 diabetes mellitus. Diabetologia. 2005;48:172–179. doi: 10.1007/s00125-004-1601-6. [DOI] [PubMed] [Google Scholar]
- 8.Furlan R, Jacob G, Snell M, Robertson D, Porta A, Harris P, Mosqueda-Garcia R. Chronic orthostatic intolerance: A disorder with discordant cardiac and vascular sympathetic control. Circulation. 1998;98:2154–2159. doi: 10.1161/01.cir.98.20.2154. [DOI] [PubMed] [Google Scholar]
- 9.van de Borne P, Montano N, Pagani M, Oren R, Somers VK. Absence of low-frequency variability of sympathetic nerve activity in severe heart failure. Circulation. 1997;95:1449–1454. doi: 10.1161/01.cir.95.6.1449. [DOI] [PubMed] [Google Scholar]
- 10.Bader M. Mouse knockout models of hypertension. Meth. Mol. Med. 2004;108:117–32. doi: 10.1385/1-59259-850-1:017. [DOI] [PubMed] [Google Scholar]
- 11.Gross V, Tank J, Obst M, Plehm R, Blumer KJ, Diedrich A, Jordan J, Luft FC. Autonomic nervous system and blood pressure regulation in RGS2-deficient mice. Am. J. Physiol. Regul. Integr. Comp. Physiol. 2005;288:R1134–R1142. doi: 10.1152/ajpregu.00246.2004. [DOI] [PubMed] [Google Scholar]
- 12.Janssen BJ, Smits JF. Autonomic control of blood pressure in mice: Basic physiology and effects of genetic modification. Am. J. Physiol .Regul. Integr. Comp. Physiol. 2002;282:R1545–R1564. doi: 10.1152/ajpregu.00714.2001. [DOI] [PubMed] [Google Scholar]
- 13.Popova E, Bader M, Krivokharchenko A. Production of transgenic models in hypertension. Meth. Mol. Med. 2004;108:33–50. doi: 10.1385/1-59259-850-1:033. [DOI] [PubMed] [Google Scholar]
- 14.Usera PC, Vincent S, Robertson D. Human phenotypes and animal knockout models of genetic autonomic disorders. J. Biomed. Sci. 2004;11:4–10. doi: 10.1007/BF02256543. [DOI] [PubMed] [Google Scholar]
- 15.Keller NR, Diedrich A, Appalsamy M, Tuntrakool S, Lonce S, Finney C, Caron MG, Robertson D. Norepinephrine transporter-deficient mice exhibit excessive tachycardia and elevated blood pressure with wakefulness and activity. Circulation. 2004;110:1191–1206. doi: 10.1161/01.CIR.0000141804.90845.E6. [DOI] [PubMed] [Google Scholar]
- 16.Ling GY, Cao WH, Onodera M, Ju KH, Kurihara H, Kurihara Y, Yazaki Y, Kumada M, Fukuda Y, Kuwaki T. Renal sympathetic nerve activity in mice: Comparison between mice and rats and between normal and endothelin-1 deficient mice. Brain Res. 1998;808:238–249. doi: 10.1016/s0006-8993(98)00848-8. [DOI] [PubMed] [Google Scholar]
- 17.Ma X, Chapleau MW, Whiteis CA, Abboud FM, Bielefeldt K. Angiotensin selectively activates a subpopulation of postganglionic sympathetic neurons in mice. Circ. Res. 2001;88:787–793. doi: 10.1161/hh0801.089542. [DOI] [PubMed] [Google Scholar]
- 18.Ma X, Abboud FM, Chapleau MW. A novel effect of angiotensin on renal sympathetic nerve activity in mice. J. Hypertens. 2001;19:609–618. doi: 10.1097/00004872-200103001-00014. [DOI] [PubMed] [Google Scholar]
- 19.Zhang W, Li JL, Hosaka M, Janz R, Shelton JM, Albright GM, Richardson JA, Sudhof TC, Victor RG. Cyclosporine a-induced hypertension involves synapsin in renal sensory nerve endings. Proc. Nat. Acad. Sci. USA. 2000;97:9765–9770. doi: 10.1073/pnas.170160397. [DOI] [PMC free article] [PubMed] [Google Scholar]
- 20.Bak M, Schmidt E. Improved time-amplitude window discriminator. IEEE Trans. Biomed. Eng. 1977;BME-24:486–489. doi: 10.1109/TBME.1977.326198. [DOI] [PubMed] [Google Scholar]
- 21.Haynes WG, Morgan DA, Walsh SA, Mark AL, Sivitz WI. Receptor-mediated regional sympathetic nerve activation by leptin. J. Clin. Invest. 1997;100:270–278. doi: 10.1172/JCI119532. [DOI] [PMC free article] [PubMed] [Google Scholar]
- 22.Brown EN, Kass RE, Mitra PP. Multiple neural spike train data analysis: State-of-the-art and future challenges. Nat. Neurosci. 2004;7:456–461. doi: 10.1038/nn1228. [DOI] [PubMed] [Google Scholar]
- 23.Lewicki MS. A review of methods for spike sorting: The detection and classification of neural action potentials. Network-Computation Neural Syst. 1998;9:R53–R78. [PubMed] [Google Scholar]
- 24.Bankman IN, Johnson KO, Schneider W. Optimal detection, classification, and superposition resolution in neural waveform recordings. IEEE Trans. Biomed. Eng. 1993 Aug.40(8):836–841. doi: 10.1109/10.238472. [DOI] [PubMed] [Google Scholar]
- 25.Gozani S, Miller J. Optimal discrimination and classification of neuronal action potential waveforms from multiunit, multichannel recordings using software-based linear filters. IEEE Trans. Biomed. Eng. 1994 Apr.41(4):358–372. doi: 10.1109/10.284964. [DOI] [PubMed] [Google Scholar]
- 26.Pouzat C, Mazor O, Laurent G. Using noise signature to optimize spike-sorting and to assess neuronal classification quality. J. Neurosci. Meth. 2002;122:43–57. doi: 10.1016/s0165-0270(02)00276-5. [DOI] [PubMed] [Google Scholar]
- 27.Segev R, Goodhouse J, Puchalla J, Berry M. Recording spikes from a large fraction of the ganglion cells in a retinal patch. Nature Neurosci. 2004;7:1155–1162. doi: 10.1038/nn1323. [DOI] [PubMed] [Google Scholar]
- 28.Diedrich A, Charoensuk W, Brychta RJ, Ertl AC, Shiavi R. Analysis of raw microneurographic recordings based on wavelet de-noising technique and classification algorithm: Wavelet analysis in microneurography. IEEE Trans. Biomed. Eng. 2003 Jan.50(1):41–50. doi: 10.1109/TBME.2002.807323. [DOI] [PMC free article] [PubMed] [Google Scholar]
- 29.Hulata E, Segev R, Shapira Y, Benveniste M, Ben-Jacob E. Detection and sorting of neural spikes using wavelet packets. Phys. Rev. Lett. 2000;85:4637–4640. doi: 10.1103/PhysRevLett.85.4637. [DOI] [PubMed] [Google Scholar]
- 30.Hulata E, Segev R, Ben-Jacob E. A method for spike sorting and detection based on wavelet packets and Shannon's mutual information. J. Neurosci. Meth. 2002;117:1–12. doi: 10.1016/s0165-0270(02)00032-8. [DOI] [PubMed] [Google Scholar]
- 31.Kim K, Kim S. A wavelet-based method for action potential detection from extracellular neural signal recording with low signal-to-noise ratio. IEEE Trans. Biomed. Eng. 2003 Aug.50(8):999–1011. doi: 10.1109/TBME.2003.814523. [DOI] [PubMed] [Google Scholar]
- 32.Letelier J, Weber P. Spike sorting based on discrete wavelet transform coefficients. J. Neurosci. Meth. 2000;101:93–106. doi: 10.1016/s0165-0270(00)00250-8. [DOI] [PubMed] [Google Scholar]
- 33.Nakatani H, Watanabe T, Hoshimiya N. Detection of nerve action potentials under low signal-to-noise ratio condition. IEEE Trans. Biomed. Eng. 2001 Aug.48(8):845–849. doi: 10.1109/10.936360. [DOI] [PubMed] [Google Scholar]
- 34.Nenadic Z, Burdick J. Spike detection using the continuous wavelet transform. IEEE Trans. Biomed. Eng. 2005 Jan.52(1):74–87. doi: 10.1109/TBME.2004.839800. [DOI] [PubMed] [Google Scholar]
- 35.Oweiss K, Anderson D. Noise reduction in multichannel neural recordings using a new array wavelet denoising algorithm. Neurocomputing. 2001;38:1687–1693. [Google Scholar]
- 36.Oweiss K, Anderson D. Spike sorting: A novel shift and amplitude invariant technique. Neurocomputing. 2002;44:1133–1139. [Google Scholar]
- 37.Zouridakis G, Tam DC. Identification of reliable spike templates in multi-unit extracellular recordings using fuzzy clustering. Comput. Meth. Prog. Biomed. 2000;61:91–98. doi: 10.1016/s0169-2607(99)00032-2. [DOI] [PubMed] [Google Scholar]
- 38.Coifman RR, Donoho DL. Translation-Invariant de-noising. Lecture Notes in Statistics. 1995;103:125–150. [Google Scholar]
- 39.Lang M, Guo H, Odegard J, Burrus C, Wells R. Noise reduction using an undecimated discrete wavelet transform. IEEE Signal Process. Lett. 1996 Jan.3(1):10–12. [Google Scholar]
- 40.Liang J, Parks TW. A translation-invariant wavelet representation algorithm with applications. IEEE Trans. Signal Process. 1996 Feb.44(2):225–232. [Google Scholar]
- 41.Pesquet J, Krim H, Carfantan H. Time-invariant orthonormal wavelet representations. IEEE Trans. Signal Process. 1996 Aug.44(8):1964–1970. [Google Scholar]
- 42.Silverman B. Wavelets in statistics: Beyond the standard assumptions. Philosophical Trans. Roy. Soc. Lond. Series A-Math. Physical Eng. Sci. 1999;357:2459–2473. [Google Scholar]
- 43.Simoncelli EP, Freeman WT, Adelson EH, Heeger DJ. Shiftable multiscale transforms. IEEE Trans. Inf. Theory. 1992 Mar.38(2):587–607. [Google Scholar]
- 44.Cohen A, Kovacevic J. Wavelets: The mathematical background. Proc. IEEE. 1996 Apr.84(4):514–522. [Google Scholar]
- 45.Mallat SG. A theory for multiresolution signal decomposition: the wavelet representation. IEEE Trans. Pattern Anal. Mach. Intell. 1989 Jul.11(7):674–693. [Google Scholar]
- 46.Samar V, Bopardikar A, Rao R, Swartz K. Wavelet analysis of neuroelectric waveforms: A conceptual tutorial. Brain Lang. 1999;66:7–60. doi: 10.1006/brln.1998.2024. [DOI] [PubMed] [Google Scholar]
- 47.Mallat S. Zero-Crossings of a wavelet transform. IEEE Trans. Inf. Theory. 1991 Jul.37(4):1019–1033. [Google Scholar]
- 48.Donoho DL. De-Noising by soft-thresholding. IEEE Trans. Inf. Theory. 1995 May;41(3):613–627. [Google Scholar]
- 49.Johnstone I, Silverman B. Wavelet threshold estimators for data with correlated noise. J. Roy. Statist. Soc. Series B—Methodological. 1997;59:319–351. [Google Scholar]
- 50.Hampel F. Robust Statistics: The Approach Based on Influence Functions. Wiley; New York: 1986. [Google Scholar]
- 51.Wornell G. Wavelet-based representations for the 1/f family of fractal processes. Proc. IEEE. 1993 Oct.81(10):1428–1450. [Google Scholar]
- 52.Welch P. Use of fast Fourier transform for estimation of power spectra—A method based on time averaging over short modified periodograms. IEEE Trans. Audio Electroacoust. 1967 Jan.AU-15(1):70–73. [Google Scholar]
- 53.Strangman G. Detecting synchronous cell assemblies with limited data and overlapping assemblies. Neural Comput. 1997;9:51–76. doi: 10.1162/neco.1997.9.1.51. [DOI] [PubMed] [Google Scholar]
- 54.Olkkonen H, Pesola P, Olkkonen J, Zhou H. Hilbert transform assisted complex wavelet transform for neuroelectric signal analysis. J. Neurosci. Meth. 2006;151:106–113. doi: 10.1016/j.jneumeth.2005.06.028. [DOI] [PubMed] [Google Scholar]
- 55.Mosqueda-Garcia R. Evaluation of autonomic failure. In: Robertson D, Biaggioni I, editors. Disorders of the Autonomic Nervous System. 1 ed. Vol. 5. Harwood Academic; Luxembourg: 1995. pp. 25–59. The Autonomic Nervous System. [Google Scholar]
- 56.Greenwood JP, Stoker JB, Mary DA. Single-unit sympathetic discharge: Quantitative assessment in human hypertensive disease. Circulation. 1999;100:1305–1310. doi: 10.1161/01.cir.100.12.1305. [DOI] [PubMed] [Google Scholar]
- 57.Macefield VG, Wallin BG. The discharge behaviour of single sympathetic neurones supplying human sweat glands. J. Auton. Nervous Syst. 1996;61:277–286. doi: 10.1016/s0165-1838(96)00095-1. [DOI] [PubMed] [Google Scholar]
- 58.Macefield VG, Wallin BG. Firing properties of single vasoconstrictor neurones in human subjects with high levels of muscle sympathetic activity. J. Physiol.-Lond. 1999;516:293–301. doi: 10.1111/j.1469-7793.1999.293aa.x. [DOI] [PMC free article] [PubMed] [Google Scholar]
- 59.Macefield VG, Wallin BG. Respiratory and cardiac modulation of single sympathetic vasoconstrictor and sudomotor neurones to human skin. J. Physiol.-Lond. 1999;516:303–314. doi: 10.1111/j.1469-7793.1999.303aa.x. [DOI] [PMC free article] [PubMed] [Google Scholar]
- 60.Macefield VG, Elam M, Wallin BG. Firing properties of single postganglionic sympathetic neurones recorded in awake human subjects. Auton. Neurosci.—Basic Clin. 2002;95:146–159. doi: 10.1016/s1566-0702(01)00389-7. [DOI] [PubMed] [Google Scholar]