

Abstract
The perirhinal cortex (PRC) is a supra-modal cortical area that collects and integrates information originating from uni- and multi-modal neocortical regions and directed to the hippocampus. The mechanisms that underlie the specific excitable properties of the different PRC neuronal types are still largely unknown, and their elucidation may be important in understanding the integrative functions of PRC. In this study we investigated the expression and properties of resurgent Na+ current (INaR) in pyramidal neurones of rat PRC area 35 (layer II). Patch-clamp experiments in acute PRC slices were first carried out. A measurable INaR was expressed by a large majority of neurones (31 out of 35 cells). INaR appeared as an inward, slowly decaying current elicited upon step repolarization after depolarizations sufficient to induce nearly complete inactivation of the transient Na+ current (INaT). INaR had a peak amplitude of ∼2.5% that of INaT, and showed the typical biophysical properties also observed in other neuronal types (i.e. cerebellar Purkinje and granule cells), including a bell-shaped current–voltage relationship with a peak at approximately −40 mV, and a characteristic acceleration of activation and decay speed at potentials negative to −45 mV. Current-clamp experiments were then carried out in which repetitive action-potential discharge at various frequencies was induced with depolarizing current injection. The voltage signals thus obtained were then used as command waveforms for voltage-clamp recordings. These experiments showed that a Na+ current identifiable as INaR activates in the early interspike phase even at relatively high firing frequencies (20 Hz), thereby contributing to the depolarizing drive and possibly enhancing repetitive discharge. In acutely dissociated area 35 layer II neurones, as well as in nucleated patches from the same neurones, INaR was never observed, despite the presence of typical INaTs. Since in both preparations neuronal processes are lost, we carried out experiments of focal tetrodotoxin (TTX) application in slices to verify whether the channels responsible for INaR are located in compartment(s) different from the soma. We found that TTX preferentially inhibited INaR when applied close to the site of axon emergence from soma, whereas application to the apical pole of the soma had a significantly smaller effect on INaR. Our results indicate that in area 35 pyramidal cells INaR is largely generated in the axon initial segment, where it may participate in setting the coding properties of these neurones.
The parahippocampal region (PHR) is a supra-modal cortical area that receives convergent inputs from a variety of unimodal and multimodal association areas of the cortical mantle, and, being reciprocally connected with the hippocampus, it acts as an ‘interface’ between the hippocampus and the rest of the pallium. A number of behavioural studies have shown that, in keeping with such a key position, the PHR is critically involved in complex functions such as memory, sensory representation and spatial orientation (Eichenbaum, 2000; Witter & Wouterlood, 2000; Murray & Richmond, 2001). The PHR includes the entorhinal cortex (EC) and the perirhinal cortex (PRC), the latter being further subdivided into two distinct regions, named area 35 and area 36, that form two narrow strips parallel to the rhinal sulcus (Burwell, 2001; Suzuki & Amaral, 2003). Anatomical studies suggest that signal transmission from the neocortex to the hippocampus takes place through a cascade of synaptic interactions that involve, in sequence, area 36, area 35, the EC and the dentate gyrus (DG) (Burwell & Amaral, 1998b; Burwell, 2000, 2001). However, PRC should not be considered as a simple relay station towards the EC and hippocampus. Major signal integration and association processes are likely to take place in the PRC, as suggested by the prominent development of associative projections orientated in a rostro-caudal direction in areas 36 and 35 (Witter et al. 1986). Consistent with this view, the PRC appears to play a role in specific memory functions independently of the hippocampus (Zola-Morgan et al. 1993; Young et al. 1997; Murray & Richmond, 2001). On the other hand, electrophysiological evidence indicates that neocortical inputs are transferred with low probability from the PRC to the EC and vice versa (Biella et al. 2002; de Curtis & Paré, 2004). The intrinsic excitable properties of PRC neurones may be important in setting the mechanisms of signal integration by which the PRC selects and amplifies only specific activity patterns, allowing them to be transferred to the subsequent synaptic station. However, the excitability properties of PRC neurones and the underlying membrane mechanisms are still incompletely characterized.
Subthreshold and near-threshold voltage-dependent Na+ currents have emerged as particularly important in signal processing functions in a number of central neuronal populations. Such currents include the persistent Na+ current (INaP) and the resurgent Na+ current (INaR). INaP is a non- or slowly inactivating current component that may have a major influence on membrane voltage in a subthreshold range, thereby sustaining intrinsic subthreshold activities and promoting specific patterns of discharge organization (discussed in Magistretti & Alonso, 2002). INaR has been identified more recently as a current component activated upon repolarization following prominent, brief depolarizations able to inactivate Na+ channels (Raman & Bean, 1997). INaR is believed to result from an atypical return path of inactivated Na+ channel to the open state, namely the transition from a ‘blocked’ state, alternative to the classical inactivated state, to the open state and then to closed states (Raman & Bean, 2001). Given its activation properties, INaR is suitable to provide a depolarizing drive early after the discharge of an action potential (AP), and may thus significantly enhance firing frequency during tonic firing (Khaliq et al. 2003; Akemann & Knöpfel, 2006; Magistretti et al. 2006) or promote discharge of AP doublets in response to brief above-threshold depolarizing stimuli (Raman & Bean, 1997). INaR was originally identified in cerebellar Purkinje cells (Raman & Bean, 1997), and later was found in several other cerebellar neuronal types (Raman et al. 2000; Afshari et al. 2004; Magistretti et al. 2006). So far, INaR has been described only in a few neuronal populations outside the cerebellum, specifically subthalamic neurones (Do & Bean, 2003), mesencephalic trigeminal neurones (Enomoto et al. 2006), neurones of the medial nucleus of the trapezoid body (Leão et al. 2006), and a subgroup of dorsal-root-ganglion neurones (Cummins et al. 2005). However, INaR has not been observed in spinal motoneurones (Pan & Beam, 1999) and hippocampal CA3 pyramidal cells (Raman & Bean, 1997). No information is currently available on the possible expression and role of INaR in cortical structures.
In the present study we investigated INaR expression and properties in layer II pyramidal neurones of rat PRC area 35. We found that an INaR showing typical biophysical properties is expressed at significant levels by these neurones. We also show that INaR provides a specific depolarizing drive in the early interspike phase during tonic firing, and report evidence for axonal location of the underlying channels.
Methods
Slice preparation
The animal experiments described in this article conformed with the rules established by the University of Pavia for the use of animals in experimental studies, in compliance with the guidelines of the Italian Ministry of Health, the national laws on animal research (d.l. 116/92), and the EU guidelines on animal research (N. 86/609/CEE). Young Wistar rats (18–23 days old) were anaesthetized by inhalation of halothane (Sigma-Aldrich S.r.l., Milan, Italy) and decapitated. The brain was quickly extracted under hypothermic conditions and submerged in an ice-cold artificial cerebrospinal fluid (ACSF) composed of (mmol l−1): 125 NaCl, 3 KCl, 24 NaHCO3, 1.25 KH2PO4, 1.2 MgSO4, 2 CaCl2, 10 d-glucose (pH 7.4 by saturation with 95% O2–5% CO2). Two coronal cuts were made to remove the anterior half and the occipital pole of the brain, and the piece thus isolated was blocked on the stage of a Microslicer DTK-1000 vibratome (Dosaka, Kyoto, Japan) using cyanoacrylate glue, with the posterior sectioning plane as a base. During the sectioning procedure the tissue was submerged in ice-cold (∼1–2°C) ACSF. Coronal slices 350 μm thick were cut. The slices selected for recordings on PRC, which lay on frontal planes between approximately −4.0 to −6.0 mm from bregma, were transferred to an incubation chamber filled with ACSF (continuously bubbled with 95% O2–5% CO2), and kept submerged at room temperature for at least 1 h before starting the recording.
Patch-clamp experiments on slices: voltage-clamp recordings
The recording chamber was mounted on the stage of an upright microscope (Axioskop 2 FS; Zeiss, Oberkochen, Germany) equipped with a ×60 water-immersion objective lens and differential-contrast optics. A near-infrared charge-coupled device (CCD) camera was also connected to the microscope, and used to improve cell visualization during the approaching and patching procedures. Slices were transferred, one at a time, to the chamber and perfused with a solution suitable for isolating Na+ currents, containing (mmol l−1): 100 NaCl, 26 NaHCO3, 19.5 tetraethylammonium chloride (TEA-Cl), 3 KCl, 2 MgCl2, 2 CaCl2, 2 BaCl2, 0.5 CdCl2, 4 4-aminopyridine (4-AP), 11 d-glucose (pH 7.4 by saturation with 95% O2–5% CO2). Perfusion rate was about 1 ml min−1. Patch pipettes were fabricated from thick-wall borosilicate glass capillaries (CEI GC 150-7.5; Harvard Apparatus, Edenbridge, UK) by means of a Sutter P-87 horizontal puller (Sutter Instruments, Novato, CA, USA). The pipette solution contained (mmol l−1): 104 CsF, 50 TEA-Cl, 2 MgCl2, 10 N-2-hydroxyethyl piperazine-N-2-ethanesulphonic acid (Hepes), 10 ethylene glycol-bis(β-aminoethyl ether)-N,N,N′,N′-tetraacetic acid (EGTA), 2 adenosine 5-triphosphate (ATP)-Na2, and 0.2 guanosine 5-triphosphate (GTP)-Na (pH adjusted to 7.2 with CsOH). The patch pipettes had a resistance of 3–5 MΩ when filled with the above solution. Liquid–liquid junction potential (Vj) was estimated, based on the composition of the extracellular and intrapipette solutions, using the calculation procedure of the acquisition program, Clampex 8.2 (see below). In the experimental conditions used for Na+-current recordings, junction potential was 5.5 mV. Actual membrane potential (Vm) values were calculated from nominal command potentials (Vcom) as Vm=Vcom−Vj. The voltage values specified in the text and figures are corrected values (Vm), unless otherwise specified.
Neurones located in layer II of PRC area 35 and showing a clear pyramidal morphology were selected for recording. Area 35 was recognized as the narrow cortical region occupying the bottom of the rhinal sulcus and characterized by a layer I much thicker than the contiguous regions. The boundaries that were considered to delimit this region reflected those identified, based on cytoarchitectonic and chemoartitectonic criteria, by morphological studies on the rat (Burwell, 2001). The patch pipette was brought in close proximity to the selected neurone while manually applying positive pressure inside the pipette. Tight seals (> 5 GΩ) and the whole-cell configuration were obtained by suction according to the standard technique (Hamill et al. 1981). Voltage-clamp recordings of Na+ currents were performed at room temperature (21–22°C) by means of an Axopatch 200B patch-clamp amplifier (Axon Instruments, Foster City, CA, USA). Series resistance (Rs) was evaluated on-line by cancelling the whole-cell capacitive transients evoked by −5 mV voltage square pulses with the amplifier built-in compensation section, and reading out the corresponding values. Rs averaged 10.5 ± 0.6 MΩ (n = 35) and was always compensated by 80–90% (average value: 82.1 ± 0.6%, n = 35). Recordings in which Rs levels varied with time by more than 2mΩ were discarded. Voltage protocols were commanded and current signals were acquired with a Pentium personal computer interfaced to a Digidata 1322A interface (Axon Instruments) using program Clampex of the pCLAMP 8.2 software package (Axon Instruments). In all recordings the nominal holding potential was −80 mV (−85.5 mV after correction for junction potential). Current signals were low-pass filtered at 5 kHz and digitized at 50 kHz (step protocols) or 20 kHz (action potential protocols or hybrid protocols). On-line subtraction of leak and capacitive currents was performed using a P/4 routine when step protocols were applied. No on-line subtraction procedure was adopted for action potential protocols or hybrid protocols.
Tetrodotoxin (TTX; Alomone Laboratories, Jerusalem, Israel) was always applied in the bath with the superfusing solution at the end of each experiment, so as to obtain residual TTX-insensitive currents to be subtracted from control tracings and isolate voltage-dependent Na+ currents. In some experiments, aimed at identifying the location of channels responsible for INaR, TTX was applied focally using a pressure microinjector (Transjector 5246, Eppendorf, Hamburg, Germany). The glass pipettes used for focal application were fabricated in the same way as described for patch pipettes, and had approximately the same tip inner diameter (0.9 μm on average).
Patch-clamp experiments on slices: nucleated-patch recordings
In some experiments on slices, recordings on nucleated patches were carried out. The procedure followed for obtaining nucleated patches was basically the same as described in the original studies in which this technique was introduced (Sather et al. 1992). After obtaining the whole-cell configuration, negative pressure was applied inside the patch pipette to attract the cell nucleus towards its tip. The pipette was then gently lifted until a portion of the soma membrane was dragged away, closing around the nucleus. Membrane capacitance compensation was re-adjusted, and Rs compensation was normally kept active. The intracellular and extracellular solutions used in these experiments were the same employed for whole-cell experiments in slices (see the previous paragraph). Signal filtering and acquisition, on-line subtraction of leakage and capacitive currents, and off-line TTX subtraction were carried out as described for whole-cell experiments (see the previous paragraph).
Patch-clamp experiments on slices: current-clamp recordings
For current-clamp recordings, the solution used for the dissection and slicing procedures was composed of (mmol l−1): 210 sucrose, 2 KCl, 26 NaHCO3, 1.25 NaH2PO4, 3 CaCl2, 10 d-glucose (pH 7.4 by saturation with 95% O2–5% CO2). The solution used to incubate slices before recording and to perfuse slices during recording was composed of (mmol l−1): 124 NaCl, 2 KCl, 26 NaHCO3, 1.25 NaH2PO4, 2 MgCl2, 2 CaCl2, 10 d-glucose (pH 7.4 by saturation with 95% O2–5% CO2). The pipette solution contained (mmol l−1): 125 potassium gluconate, 15 KCl, 5 NaCl, 2 MgCl2, 5 Hepes, 1 EGTA (pH 7.3 with KOH). Estimated liquid–liquid junction potential was 13.6 mV, and was subtracted from recorded membrane potential to obtain actual values. Current-clamp recordings were performed at room temperature using a Multiclamp amplifier (Axon Instruments). Bridge balance compensation was activated. Clampex 8.2 and a Digidata 1322A digitiser were used to inject current steps and acquire voltage signals. Sampling frequency was 20 kHz.
Experiments on acutely dissociated neurones
For experiments on acutely dissociated neurones, the procedure of brain extraction was similar to that described above. The brain was cut into 350 μm thick horizontal slices using a McIlwain tissue chopper (Mickle Engineering, Gomshall, UK). Layer II of perirhinal cortex area 35 was carefully dissected from each slice under microscopic control. During this operation the slices were submerged in an ice-cold solution (dissection buffer) composed of (mmol l−1): 115 NaCl, 3 KCl, 3 MgCl2, 0.2 CaCl2, 20 piperazine-N,N′-bis(2-ethanesulphonic acid), 1.5 Na (Pipes-Na), and 25 d-glucose (pH 7.4 with NaOH, bubbled with pure O2). The tissue fragments obtained were then transferred into a 20 ml stirring flask filled with dissection buffer with addition of 1 mg ml−1 pronase (protease type XIV, Sigma) and continuously bubbled with O2. The flask was submerged in a thermostatically controlled bath at 30–32°C and kept gently stirring. The enzymatic reaction was stopped after 7 min by removing the solution and rinsing the tissue with a solution (Ca2+-free buffer) containing (mmol l−1): 113.5 NaCl, 3 KCl, 3 MgCl2, 20 Pipes-Na, 3 EGTA, 25 d-glucose, plus 2 mg l−1 bovine serum albumine (Sigma fraction V) (pH 7.4 with NaOH). The tissue fragments were kept submerged in continuously oxygenated dissection buffer for at least 1 h at room temperature before further dissociation, then re-suspended in Ca2+-free buffer and triturated with a few passages through Pasteur pipettes of progressively decreasing tip diameter. After sedimentation of the undissociated tissue, the supernatant was transferred into the recording chamber, on a concanavaline A (Sigma, type V)-coated, 16 mm diameter round coverslip. The dissociated cells were allowed to settle down for 15 min before starting the recordings.
The experimental conditions and procedures adopted for whole-cell, patch-clamp recordings were the same as described elsewhere (Magistretti et al. 2003). In a first set of experiments, the extracellular recording solution used to perfuse dissociated cells (solution A) contained (mmol l−1): 100 NaCl, 34 TEA-Cl, 3 KCl, 3 CsCl, 5 BaCl2, 2 MgCl2, 0.2 CdCl2, 5 4-AP, 10 Hepes, 19 d-glucose (pH 7.4 with NaOH, continuously bubbled with pure O2). In later experiments, an extracellular recording solution in which the Na+ concentration was the same as in experiments in slices (126 mm instead of 100 mm) was used. This solution (solution B) contained (mmol l−1): 126 NaCl, 20 TEA-Cl, 3 KCl, 3 CsCl, 5 BaCl2, 2 MgCl2, 0.2 CdCl2, 5 4-AP, 10 Hepes, 11 d-glucose (pH 7.4 with NaOH, continuously bubbled with pure O2). Patch pipettes were filled with the same solution used for experiments on slices (see above), and had a resistance of 3–5.5mΩ when filled with this solution. Estimated liquid–liquid junction potential (Vj) was 5.8 mV for the experiments carried out with extracellular solution A, and 5.7 mV for those carried out with extracellular solution B. Vj was subtracted from nominal command potential values to obtain actual membrane potential (Vm) values.
Voltage-clamp recordings of Na+ currents were carried out using an EPC7 patch-clamp amplifier (List Electronics, Darmstadt, Germany). Rs averaged 11.6 ± 1.0mΩ (n = 21), and was always compensated by 55–60% (average value: 55.7 ± 1.3%, n = 21). Nominal holding potential was −80 mV. Voltage protocol generation and current data acquisition were carried out using a Pentium personal computer interfaced to an Axon TL-1 interface, and the Clampex program of the pCLAMP 6.0.5 software package (Axon Instruments). Current signals were filtered at 5 kHz, digitized at 50 kHz, and on-line leak subtracted via a P/4 protocol. TTX subtraction was always carried out as explained for experiments in slices.
To evaluate cell membrane surface area, the properties of passive currents evoked by −10 mV hyperpolarizing voltage square pulses delivered from the normal holding potential (see Fig. 4Bb) were analysed. These currents, which included a capacitive and a resistive component, were recorded after setting the low-pass filter at 10 kHz to better preserve the high-frequency components of capacitive transients. The offset due to the steady-state, resistive component was zeroed, and the area under the capacitive transient was measured to derive the total charge transferred during membrane-capacitance charging (Qtot). This parameter was taken as a rough index of total membrane surface area (see Castelli & Magistretti, 2006).
Figure 4. Lack of INaR in nucleated patches from area 35 layer II neurones.

Aa–d illustrates an experiment carried out in a representative nucleated patch; B shows average data from 12 nucleated patches. Aa, microphotograph of the nucleated patch from which the data shown in Aa–d were obtained (patch no. G7307) (calibration bar: 10 μm). Ab, the currents recorded in response to a 20 ms, −10 mV hyperpolarizing voltage square pulse (top) in the whole-cell condition before nucleated-patch isolation (grey trace), and in the nucleated patch (black trace). Note the marked reduction of both capacitive transients and steady-state currents after nucleated-patch isolation. Ac, the currents recorded in the same patch in response to the INaT activation protocol (top). Ad, the currents recorded in response to the INaR activation protocol (top; only the currents corresponding at the repolarization levels of −35.5, −40.5 and −45.5 mV are shown here). B, average traces obtained from the currents recorded in 12 nucleated patches in response to the INaR activation protocol (top). The vertical, dotted lines in Ad and B correspond to the time points at which INaR peak would be expected, based on data from intact neurones, at each repolarization level. The horizontal, dotted line in B marks the current level corresponding to the expected INaR peak, as determined under the assumption that INaR is equally expressed in somatic membranes as in intact whole cells (see Results for details).
Data analysis
Whole-cell current and voltage signals were analysed by means of program Clampfit of pCLAMP 8.2 or 6.0.5. Na+ currents were re-filtered off-line at 3 kHz. Current amplitude was measured at the peak of each tracing, unless otherwise specified. Na+ permeabilities (PNas) were calculated from current amplitudes (INas) by applying the Goldman–Hodgkin–Katz equation in the form:
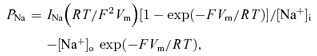 |
in which the nominal intra- and extracellular Na+ concentration values (4.2 mm and 100 or 126 mm, respectively) were introduced. Data fittings with exponential functions,
were carried out using Clampfit. Fittings with Boltzmann functions, y =ymax/{1 + exp[(V−V1/2)/k)]}, were carried out using Origin 6.0 (MicroCal Software, Northampton, MA, USA).
Average values are expressed as mean ±s.e.m. Statistical significance was evaluated by means of the two-tail Student's t test for unpaired data.
Results
Properties of INaR in area 35 layer II pyramidal neurones
Resurgent Na+ current (INaR) expression in pyramidal neurones of PRC area 35 layer II was examined with voltage-clamp experiments in which a depolarizing–repolarizing protocol (Fig. 1Aa) was applied to evoke INaR. The protocol consisted of a 19 ms pulse at −5.5 mV commanded to elicit the fast-inactivating Na+ current (INaT), followed by a 100 ms step repolarization at −20.5 to −90.5 mV (values corrected for junction potential, Vj) in −5 mV increments. All protocols were repeated after application of 1 μm TTX, and tracings recorded under TTX were subtracted from control tracings to isolate voltage-dependent Na+ currents (unsubtracted currents are not shown). The repolarizing step evoked a recognizable INaR in 31 out of 35 cells. At Vm=−20.5 to −50.5 mV, INaR emerged as an inward current that developed and then decayed in a time- and voltage-dependent fashion (see Fig. 1Ab and c). INaR decay was followed by a sustained Na+ current component that could be identified as persistent Na+ current, INaP. INaR amplitude showed a clear tendency to slowly run up in the course of the experiment. The basis of this effect was not further investigated in this study. The measures reported below were obtained within the first 6 min of recording after break-in, when the run-up was still minor, so as to obtain information about INaR under ‘basal’ neuronal conditions. In the cells in which INaR was present, its maximal amplitude (normally observed at Vm=−40.5 mV) was −254.8 ± 14.6 pA (n = 31). Peak INaR amplitude relative to that of INaT averaged 0.0333 ± 0.0020 (n = 31). The latter value is close to those found, under similar experimental conditions, for several cerebellar neuronal types (Afshari et al. 2004). It has been shown elsewhere (Magistretti et al. 2006) that INaR amplitude can be most conveniently estimated by subtracting the amplitude of persistent component observed at the end of the repolarizing pulse (Fig. 1Ab and c, horizontal bars) from that of the inward current peak occurring after repolarization. INaR maximal amplitude measured as above averaged −177.0 ± 9.4 pA (n = 31), and peak INaR amplitude relative to INaT averaged 0.0233 ± 0.0015 pA (n = 31).
Figure 1. Resurgent Na+ current (INaR) in layer II pyramidal neurones of PRC area 35.

A, INaR in two representative pyramidal neurones (cell C6607 in Ab, cell B6607 in Ac). The experimental tracings are the currents recorded in response to the depolarizing–repolarizing voltage command shown in Aa. Voltage values specified in Aa are corrected for junction potential. In Ab and Ac, the voltage level of the repolarizing pulse is specified for some tracings. The horizontal bars indicate the tracing region over which data points were averaged to obtain an estimate of the persistent Na+ current (INaP) amplitude. y-axis calibration bar: 150 pA (Ab), 225 pA (Ac). B, current–voltage dependence of INaR, measured by subtracting INaP amplitude from raw INaR peak amplitude. Data points are average values from 14 cells. C, average voltage dependence of INaR rise time 10–90% (RT10–90: ▴) and INaR decay time constant (τdecay: ^). τdecay was obtained from mono- or biexponential fitting of INaR decay phase. When decay was biexponential, the faster exponential component, which was the prevalent one, was considered. Data points are average values from 14 cells.
Average INaR amplitude is plotted as a function of repolarization potential in Fig. 1B. INaR amplitude increased with increasing repolarization in the −20.5 to −40.5 mV window, then decreased to reach, at −65.5 to −90.5 mV, a more steady value equal to approximately 40–45% that of peak amplitude. INaR activation speed was analysed by measuring the rise time 10–90% (RT10-90) of its rising phase. The plot of RT10-90 as a function of voltage was bell-shaped (Fig. 1C, triangles), with a maximum of ∼4.3 ms at −30.5 to −40.5 mV. At −60.5 to −70.5 mV, RT10-90 was ∼1.5–2 ms, whereas at more negative potentials INaR rising phase was too steep to allow for reliable measurements. INaR decay could be appropriately described by a single exponential function at −20.5 to −65.5 mV, or with a double exponential function at more negative potentials (in the latter case, the faster exponential component, which was the more represented, was considered). The decay time constant was highest (30 ms) at −30.5 to −40.5 mV, and decreased to reach values around 7.5 ms at potentials negative to −65.5 mV (Fig. 1C, circles). These properties are qualitatively similar to those observed for INaR in other neurones, including Purkinje neurones (Raman & Bean, 1997), cerebellar granule cells (Magistretti et al. 2006), subthalamic neurones (Do & Bean, 2003) and mesencephalic trigeminal neurones (Enomoto et al. 2006).
INaR contributes to depolarizing drive during tonic firing
Due to its ability to generate an extra inward current upon repolarization after depolarizations able to inactivate Na+ channels, the mechanism of resurgence may potentially provide a depolarizing drive after the discharge of single action potentials (APs), thus enhancing repetitive firing (Raman & Bean, 1997; Khaliq et al. 2003; Magistretti et al. 2006). This idea was tested in the cells under study by using APs generated during normal tonic firing as voltage command waveforms. In current-clamp conditions, stimulation with 2 s above-threshold depolarizing current steps induced a tonic repetitive firing in 21 out of 35 cells (Fig. 2Aa). Among the 21 regular spiking cells, 10 were classified as non-adapting (Fig. 2Aa) and 11 as adapting. The remaining 14 cells were single spiking. We selected the voltage signal recorded in a representative non-adapting cell at three different levels of stimulation and firing frequency (∼5, 13 and 20 Hz) to construct voltage command waveforms (Fig. 2Ab). In the voltage protocols applied, the selected current-clamp tracing segments were preceded by a 5 s step at −68.5 mV (corrected Vm value), a level approximately equal to the maximal post-spike hyperpolarization observed during the 5 Hz discharge (see Fig. 2Ab, bottom). Voltage-clamp recordings were carried out using such protocols and Na+ currents were isolated via TTX subtraction (n = 8). As expected, during the fast depolarizing and repolarizing phases of APs, prominent Na+ currents were elicited (Fig. 2Ba, black trace). In addition, a smaller TTX-sensitive inward current also flowed during the interspike interval, in a subthreshold voltage range (Fig. 2Bb, C and D). In this current, two phases could be recognized: an initial phase, largely concomitant with the post-spike hyperpolarization, in which the current decayed slowly to a minimum; and a second phase, corresponding to the interspike ramp-like depolarization, in which the current rose back gradually. In principle, the interspike current, and especially its initial phase, could be produced by the resurgence mechanism responsible for INaR generation, alone or with a contribution from a background, or steady-state, component (identified as INaP in step protocols) and/or a tail Na+ current. To test this hypothesis, we first attempted to establish the possible contribution of a background component. In the case of the 5 Hz discharge, this could be done by applying a modified protocol shown as a blue line in Fig. 2Ab (bottom). In this protocol, the first AP, the ramp depolarization that preceded it, and part of the post-spike hyperpolarization were replaced by a steady baseline (Vbas) at −67.0 mV, a level slightly positive to the hyperpolarization peak (−68.5 mV); then the original waveform resumed starting from the time point at which the ramp-like depolarization crossed the −67.0 mV level. The background component activated during Vbas should be equal to, or greater than, that activated during the post-spike hyperpolarization of the original AP waveform, for two reasons: (1) being slightly positive to the post-spike hyperpolarization level, Vbas is expected to recruit depolarization-activated background currents at least as much; and (2) differently from the original AP waveform, in the modified protocol the interspike ramp depolarization was not preceded by the prominent depolarization due to the AP, which may affect the background Na+ current component by causing, if anything, some degree of inactivation (see Fleidervish & Gutnick, 1996; Magistretti & Alonso, 1999; see also below). The comparison of the currents evoked by the two protocols (Fig. 2Bb and d, black and blue lines) clearly revealed that in most cells (6 out of 8) the interspike current was largely unrelated to any background components, at least for the first 30 ms of its initial phase (namely, during the hyperpolarization phase). Evidence of the same could not be obtained directly for higher discharge frequencies (13 Hz and 20 Hz), during which the interspike potential became more positive (see Fig. 2Ab). In these cases, indeed, the approach of replacing the first spike(s) with a Vbas slightly positive to peak post-spike hyperpolarization to evaluate INaP contribution could not be adopted, since it led to overestimation of the background current. Such overestimation was clearly revealed by the Na+ current activated by the ramp depolarization that followed Vbas, which was always much greater than that observed with the original waveform (see Supplemental Fig. A). This phenomenon probably reflected the fact that cumulative Na+ channel inactivation preliminarily induced by repetitive AP depolarizations was lacking when the modified protocols were applied. Hence, the contribution of the background component could be evaluated only indirectly. This was done by comparing interspike current amplitude at time points that preceded or followed the maximal post-spike hyperpolarization in the command waveform trajectory, but corresponded to the same absolute voltage level (Fig. 2C and D). It can be seen that current amplitude was clearly higher at earlier than at later time points (see arrows in Fig. 2C and D). This is inconsistent with the properties of a background component, the amplitude of which is expected to depend basically only on absolute membrane potential in the absence of strong and/or prolonged depolarizations able to induce inactivation. These data strongly suggest that the initial phase of the interspike, subthreshold Na+ current cannot be explained by mechanisms generating simple background Na+ current(s), and, hence, INaP.
Figure 2. INaR recruitment during repetitive firing.

Aa, repetitive action potential (AP) discharge evoked, under current-clamp conditions, in a representative regular spiking neurone (cell 06721) in response to three depolarizing current steps of increasing amplitude (bottom panel). Firing frequencies were ∼5, 13 and 20 Hz. The tracing regions embraced by the dotted-line boxes were used to construct waveform commands for voltage-clamp recordings. Ab, voltage-clamp waveform commands derived from the 5 Hz (bottom), 13 Hz (middle) and 20 Hz (top) tonic discharges shown in Aa. Black lines are protocols consisting of the original, unmodified voltage trajectories. Red lines are protocols in which the repolarizing phase of each AP was preceded by a 5 ms square pulse at the AP peak level. The blue line is a modified protocol in which the initial ramp depolarization and the first AP and afterhyperpolarization were replaced by a fixed, basal voltage level (Vbas) of −67.0 mV. The horizontal, dashed lines indicate the −67.0 mV voltage level. B, currents recorded in response to the 5 Hz discharge protocol (top). Ba and Bc show the currents recorded in a single representative neurone (cell B6026), and average currents from 6 neurones, respectively. Bb and Bd are a detail, over expanded time and amplitude scales, of the tracings shown in Ba and Bc, respectively. The portions of voltage protocols and current tracings highlighted in Bb and Bd are indicated by the dotted-line boxes in Ba and Bc, and by the horizontal bar in Ab, bottom. Each current tracing corresponds to the voltage command identified by the same colour. The arrows point to the early interspike inward Na+ current (black line), which largely superimposes to the INaR component elicited by the hybrid protocol (red line). The vertical, dashed line indicates the time point at which the repolarization phase of the original AP waveform crossed the −67.0 mV voltage level. The inset in Bd shows a further detail of the current evoked by the hybrid protocol. The current portion illustrated corresponds to that contained in the dotted-line box in the main panel. Each x- and y-axis subdivision is 5 ms and 100 pA, respectively. The horizontal dashed line in the inset is 0 pA, the vertical dotted line indicates the time point corresponding to the maximal slope of the command waveform repolarizing phase. C and D, detail of the currents recorded in response to the 13 Hz and 20 Hz protocols. The tracing segments illustrated here correspond to the portions of command voltage waveforms indicated by the horizontal bars in Ab (middle and top). Each tracing is the average of the currents recorded in 6 neurones. The two arrows of each panel indicate two time points corresponding to the same voltage level in the command waveform (−61.0 mV in C, −54.5 mV in D), the first one preceding and the second one following the peak post-spike hyperpolarization.
The possible contribution of tail Na+ currents was then evaluated using hybrid voltage protocols (see Do & Bean, 2003; Enomoto et al. 2006). Tail currents are elicited by fast repolarization in the presence of incomplete channel inactivation. To minimize this process, Na+ channel inactivation was maximized by replacing the AP rising phase with a more prolonged (5 ms) step membrane depolarization at a voltage level equal to the peak of each AP (∼+25 mV), followed by the original AP repolarizing phase (red lines in Fig. 2Ba and b, top). At the end of the 5 ms step depolarization, Na+ current inactivation induced in this way was prominent although still not complete (Fig. 2Bd, inset), which might be explained by slowed Na+ current kinetics due to space clamp limitations. However, the repolarization phase of the hybrid waveform was followed by fast deactivation of the residual Na+ current (arrow in Fig. 2Bd, inset), at the end of which the possible contribution of tail currents could be considered largely terminated. After this process, a new inward current developed, reaching a peak in a few milliseconds and then showing a slower decay (red lines in Fig. 2Bb and d, C and D). This current component, activated upon repolarization after INaT decay, can be interpreted as INaR (Do & Bean, 2003; Enomoto et al. 2006). Remarkably, the decay phase of this current overlapped with that observed when the original AP waveform commands were applied (Fig. 2Bb and d, arrows; Fig. 2C and D). All the above results show that the early interspike Na+ current is largely not due to background or tail components, whereas it is closely paralleled by INaR when the latter current is activated under similar conditions. We conclude therefore that the resurgence mechanism gives the main contribution to the early interspike Na+ current during tonic firing in the frequency range considered here (5–20 Hz).
The peak amplitude of the INaR flowing after pulse depolarization in the hybrid protocol averaged −61.2 ± 2.9 pA in the 5 Hz protocol; −31.8 ± 3.3 pA in the 13 Hz protocol; and −35.4 ± 1.6 pA in the 20 Hz protocol (n = 6). At least for the 5 and 13 Hz protocols, these values are likely to represent appropriate and conservative estimations of the INaR flowing in the early interspike phases of the original AP protocols, because in such cases possible contamination by INaP was negligible (see Fig. 2Bd and C), and the amplitude of the peak INaR evoked by the hybrid protocol was always similar to, or smaller than, that of the inward current recorded in response to the original AP protocol at the same time point. For comparison, command currents applied in current-clamp experiments to evoke 5 Hz, 13 Hz and 20 Hz discharges averaged 75.3 ± 15.2 pA (n = 12), 138.4 ± 19.1 pA (n = 14) and 206.8 ± 23.8 pA (n = 14), respectively.
Location of channels responsible for INaR
As a further step, we attempted to also characterize INaR in acutely isolated neurones, thus avoiding space clamp limitations present in recordings from intact neurones in slices. Neurones were acutely isolated from area 35 layer II using an enzymatic and mechanical dissociation procedure (see Methods), and recordings were carried out using either a 100 mm Na+ extracellular solution (solution A, see Methods) in initial experiments, or a 126 mm Na+ extracellular solution (solution B) in later experiments. In these cells, prominent fast-decaying Na+ currents were elicited by INaT activation protocols (Fig. 3Aa). Maximal INaT amplitude measured at the peak of the current–voltage (I–V) relationship averaged −3639.0 ± 306.5 pA (n = 9) in solution A, and −2655.5 ± 454.1 pA (n = 12) in solution B. INaT amplitude normalized to the index of total membrane surface area, Qtot (see Methods), averaged 43.3 ± 7.5 pA fC−1 (n = 9) in solution A, and 31.0 ± 4.2 pA fC−1 (n = 12) in solution B. In 11 cells in which optimal clamp conditions were obtained, the I–V relationship of INaT showed a peak at −25 mV (Fig. 3Ab, open circles). Botzmann fittings of activation plots (Fig. 3Ab, filled circles) returned average half-activation potential (V1/2) and slope coefficient (k) equal to −34.9 ± 1.5 mV and −4.5 ± 0.2 mV, respectively (n = 11).
Figure 3. INaR is absent in acutely dissociated area 35 layer II neurones.

A, INaT in a representative acutely dissociated neurone (cell A5624). Aa shows current tracings recorded in response to an INaT activation protocol (top of the panel). Specified voltage values are corrected for junction potential. Ab illustrates the current–voltage relationship of INaT (^) and voltage dependence of the underlying permeability (•) for the same cell. Permeability values were calculated from peak-current values as explained in Methods. The smooth line interpolating permeability data points is the best Boltzmann fitting (V1/2 and k are −38.5 mV and −5.0 mV, respectively). The smooth line interpolating current data points has been obtained from the same Boltzmann fitting by converting permeability into current on the basis of the Goldmann–Hodgkin–Katz equation (see Methods). B, the currents recorded in the same neurone in response to an INaR activation protocol (top of the panel). For clarity, only currents corresponding to repolarization levels of −25.8 to −85.8 mV in −10 mV increments are shown in the main panel. The inset shows a detail of the currents recorded at the repolarization levels of −35.8 mV (top) and −40.8 mV (bottom) (calibration bars in inset: 20 ms, 75 pA). The vertical, dotted lines mark the time points at which INaR peak would be expected, based on data from intact neurones. Note the lack of INaR. C, the currents recorded in a representative acutely dissociated Purkinje neurone (cell D5304) in response to the INaR activation protocol. Note the prominent INaR component.
Although dissociated neurones maintained prominent INaTs showing the properties expected for this current type, they appeared to be devoid of any INaR component. In 0 of 9 cells recorded in extracellular solution A and 12 cells recorded in solution B was a measurable INaR observed in response to the INaR activation protocol (Fig. 3B; see also Supplemental Fig. B, panel A). As the clamp control of INaT was most often imperfect in slices, but normally much better in dissociated neurones, it could be hypothesized that INaR is differently detected in the two neuronal preparations as a consequence of clamp artefacts. In particular, if the depolarizing pulse of the INaR activation protocol locally elicits an unclamped spike, instead of a well-clamped current, an extra depolarization could be generated in some region of the membrane, thus enhancing channel inactivation and the resurgence mechanism. Such an effect could make INaR emerge more clearly in the poorly clamped intact neurones than in the better-clamped dissociated cells. To compensate for such a possible source of error, in dissociated cells a modified INaR activation protocol was also run in which a double step pulse at +24.3 mV (2 ms) and −5.7 mV (17 ms) was applied to elicit INaT, instead of a single 19 ms step at −5.7 mV (see Supplemental Fig. B, panel B1). The step at +24.3 mV (a level similar to that of AP peak: see Fig. 2Aa) was delivered to mimic the extra depolarization that could be produced in intact neurones by an unclamped spike triggered by the depolarizing step at −5.7 mV. Also when commanding this protocol, however, no detectable INaR could be revealed in dissociated neurones (n = 7; see Supplemental Fig. B, panel B2).
Three hypotheses can be considered to explain INaR absence in dissociated neurones: (1) the enzymatic treatment used for the dissociation procedure may modify Na+ channels making them unable to generate the INaR component; (2) the dissociation procedure may cause modifications of the intracellular environment affecting Na+ channels and resulting in INaR abolishment; (3) Na+ channels responsible for INaR generation may be specifically located in a membrane compartment that is lost after cell dissociation, i.e. the axon or distal dendrites. To test hypothesis 1, we used the same dissociation procedure adopted for PRC neurones to prepare dissociated Purkinje cells from cerebellar cortex, a cell type that provides a suitable positive control. Indeed, INaR is known to be present in Purkinje cells acutely isolated using a dissociation procedure different from the one we employed (Raman & Bean, 1997), as well as in excised patches from Purkinje cell somata (Grieco et al. 2002). We found that prominent INaR components were maintained in dissociated Purkinje cells (n = 8 out of 8 cells) (Fig. 3C). Average INaR peak amplitude was −269.5 ± 37.5 pA in absolute terms, and 0.045 ± 0.004 relative to peak INaT amplitude (n = 8). These results suggest that enzymatic alterations of Na+ channels are not responsible for INaR absence in dissociated PRC neurones.
Hypothesis 2, which is difficult to test directly, was indirectly addressed by evaluating INaR presence, or lack thereof, in the somatic membrane of PRC neurones independently of a cell dissociation procedure. This was done by resorting to the nucleated-patch technique, in which, starting from the whole-cell configuration in experiments on slices, a sizeable portion of the somatic membrane is mechanically removed from the recorded cell (see Methods) forming a large, nucleated outside-out patch (see Fig. 4Aa). Twelve nucleated patches were successfully recorded. Input resistance (Rin) and membrane capacitance (Cm) of nucleated patches were evaluated by analysing the passive currents evoked by −10 mV hyperpolarizing voltage square pulses (Fig. 4Ab). Rin, calculated from the steady-state current's amplitude, averaged 482.2 ± 61.3 MΩ (n = 12). Cm, calculated from the total charge transferred during capacitive-current flow (Qtot: see Methods) averaged 2.7 ± 0.2 pF (n = 12). Small, typical INaTs could be evoked in nucleated patches (Fig. 4Ac), with INaT amplitude, measured at the peak of the I–V relationship, averaging −271.6 ± 95.6 pA (n = 12). Given the small size of Na+ currents observed in nucleated patches, signal discrimination from noise was improved by means of current averaging. In particular, in each recording the INaR activation protocol was commanded repetitively (10–20 times), and the currents thus recorded in each patch were averaged, thus substantially increasing the signal-to-noise ratio. Figure 4Ad illustrates the results obtained in a representative patch. In none of the 12 patches was a detectable INaR observed. This is further illustrated in Fig. 4B, in which average currents from all the available recordings are shown. The horizontal, dotted line in Fig. 4B corresponds to the level of the expected INaR amplitude as calculated, assuming INaR relative amplitude to be the same in the soma as in intact neurones, as the product  fINaR+, where is the average INaR-to-INaT amplitude ratio observed at −40.5 mV in intact neurones (0.0233), is the average, peak INaT amplitude in nucleated patches (−271.6 pA), and fINaR+ is the fraction of INaR-positive cells (0.89). It can be seen that this amplitude level was considerably large as compared with background noise (root-mean-square noise ∼0.8 pA in the tracings shown in Fig. 4B). Hence, it can be concluded that the somatic membrane of area 35 layer II neurones is devoid of channels generating INaR at detectable levels, and that INaR must arise in some of the neuronal processes that are lost after cell dissociation (hypothesis 3).
To identify the membrane compartment responsible for INaR generation, we examined the effects of focal application of TTX on INaR. A pressure microinjector (see Methods) was used to deliver TTX (100 nm, dissolved in the extracellular perfusion solution) to different regions of pyramidal neurones. The tip of the microinjection pipette was positioned either in proximity to the presumed site of axon emergence from the soma, or close to the apical pole of the soma. In the former case, the axon was assumed to emerge approximately at the mid-point of the basal side of the triangle corresponding to the pyramidal cell's soma contour (see Faulkner & Brown, 1999). Thus, the pipette tip was positioned within a range of less than 10 μm from this point, slightly deep to the soma's basal side (Fig. 5A). In the latter case, the pipette tip was positioned at the same level of the main apical dendrite's emergence from the soma, at a distance of less than 10 μm from it (Fig. 5C). As noted above, the space clamp limitations typical of intact neurones could make Na+ currents to locally generate uncontrolled extra depolarizations, and Na+ current inhibition via Na+ channel block could reduce such extra depolarizations, thus modifying the conditions of INaT as well as INaR activation. To minimize this possible source of error, in the experiments of focal TTX application an INaR activation protocol was applied in which the routinely used 19 ms step depolarization at −5.5 mV was replaced by a 10 ms step at +25.5 mV. This depolarization level, which is closer to the maximal one that a Na+ current could cause, is expected to minimize the weight of possible, artefactual extra depolarizations generated by local escape from clamp, and, by eliciting smaller-amplitude Na+ currents (the driving force for Na+ currents being smaller at +25.5 mV than at −5.5 mV), to also improve clamp conditions. The +25.5 mV step was followed by a 100 ms step repolarization at −40.5 mV (Fig. 5Ba and Da). To monitor the effects of focal TTX application on INaR, this protocol was repetitively commanded once every 5 s. The pressure and duration of TTX puff application were adjusted to obtain a 25–35% inhibition of the INaT component activated by the +25.5 mV step. Normally, this was achieved with puff applications of 50–80 kPa in pressure and 300–500 ms in duration. Under such conditions, when TTX was applied close to the axon's emergence from the soma, INaR amplitude was reversibly reduced by 32.8 ± 3.3% (n = 6) (see Fig. 5Bb). When TTX was applied close to the apical pole of the soma, INaR amplitude inhibition was significantly smaller (18.6 ± 2.5%, n = 6; P < 0.01) (see Fig. 5Db), despite an average percentage reduction of INaT amplitude that was very similar in both cases (28.8 ± 5.7%versus 29.2 ± 2.4%, P = 0.95). These results are consistent with the channels responsible for INaR in area 35 layer II pyramidal neurones being mostly located in a membrane compartment different from the soma, and possibly corresponding to the axon initial segment.
Figure 5. INaR is preferentially inhibited by focal TTX application to the proximal axon.

A and C, scheme of puff TTX application close to the proximal axon (A) or at the boundary between the soma and the main apical dendrite (B) of area 35 layer II pyramidal neurones during whole-cell recordings. B, currents recorded in response to an INaR activation protocol (Ba) in a pyramidal neurone (cell C7328) before (black line) and 2 s after puff TTX application close to the proximal axon (see A). D, currents recorded in response to the same INaR activation protocol (Ba) in another pyramidal neurone (cell A7413) before and 2 s after puff TTX application close to the apical portion of the soma (see C). The insets in Bb and Db show a detail of the effect of TTX application on INaR. Each division of the x and y axes is 20 ms and 200 pA, respectively.
Discussion
The present study contributes to the knowledge of Na+ current properties and roles in cortical neurones of the PHR, and provides the first demonstration of INaR expression by a population of cortical neurones. The neurones we investigated, namely layer II pyramidal cells of PRC area 35, appear as especially important in the intrinsic and extrinsic connectivity of the PHR. The superficial layers of PRC receive prominent afferent projections from several cortical areas, including piriform cortex and lateral entorhinal cortex (Burwell & Amaral, 1998a,b), and their neurones represent the most important source of association fibres within, and between, area 35 and area 36 (Burwell & Amaral, 1998a). Moreover, neurones of area 35 layer II provide most projection fibres from the PRC to medial and lateral entorhinal cortex (Burwell & Amaral, 1998a). Therefore, these neurones are likely to play a key role in the processes of signal integration and association that take place in the parahippocampal region, and which, in turn, are believed to represent a fundamental aspect of information transmission to the hippocampus and memory function (see Introduction). This underscores the importance of understanding the bases of excitable and computational properties of such neurones.
A large majority of area 35 layer II neurones proved to be endowed with INaR. The peak amplitude of this current was ∼2–2.5% that of INaT, a level of expression not dissimilar from those observed in various cerebellar neurones (Afshari et al. 2004; Magistretti et al. 2006), in which INaR appears to significantly contribute to control excitability (see Magistretti et al. 2006). INaR's property of activating upon repolarization following strong, brief depolarizations (such as the AP) makes this current suitable to be recruited following single APs or during a repetitive discharge. The firing behaviour of PRC layer II neurones have been reported to be, in a vast majority of cases, of the late-spiking type (Faulkner & Brown, 1999) or regular-spiking type (Faulkner & Brown, 1999; this study). Both late-spiking cells and regular-spiking cells produce, upon application of strong, sustained depolarizing current, regular trains of APs of frequencies up to 20–25 Hz (Faulkner & Brown, 1999). Therefore, we verified whether the mechanism responsible for INaR generation can contribute to the inward current flowing in the interspike phase during tonic firing in the 5–20 Hz frequency range. Our results indicate that in the early interspike phase the current provided by the resurgence mechanism represents the greatest fraction of the total Na+ current in the whole frequency range explored. The estimated peak amplitude of this current was such that, for discharges at 5 and 13 Hz, it represented approximately 80 and 23%, respectively, of the command current applied to elicit firing. Hence, in area 35 layer II pyramidal neurones INaR provides, during repetitive AP discharge, a depolarizing drive which is likely to significantly contribute to the balance of transmembrane currents and therefore to enhance firing activity and frequency. A role for INaR in enhancing evoked or spontaneous repetitive firing has also been shown in cerebellar Purkinje and granule cells (Khaliq et al. 2003; Akemann & Knöpfel, 2006; Magistretti et al. 2006) and neurones of mesencephalic trigeminal nucleus (Enomoto et al. 2006).
The biophysical properties of the INaR present in area 35 layer II neurones were qualitatively similar to those reported for cerebellar and subcortical neurones (Raman & Bean, 1997; Do & Bean, 2003; Magistretti et al. 2006; Enomoto et al. 2006). Such properties included an amplitude peak at about −40 mV, monoexponential decay kinetics with a decay time constant of approximately 30 ms in the peak region, and a marked acceleration of the decay kinetics at potentials negative to −50 mV. It should be noted that these results were obtained in intact neurones, in which space clamp problems due to the cells' complex geometry may affect the measurements of the current's voltage-dependent and kinetic properties. For instance, INaR onset, or fast INaR decay at negative voltage levels, could be slowed if clamp speed is insufficient in the membrane compartment in which the current is generated. However, other parameters, such as INaR voltage dependence of activation, or INaR decay speed at positive voltage levels, are not expected to be strongly altered, due to the current's small size and relatively slow kinetics.
INaR properties could not be further analysed in acutely dissociated neurones because such cell preparations proved to be completely devoid of the current, despite the fact that a prominent INaT showing typical biophysical properties was maintained. This observation indicates that acutely dissociated neurones may not always be an appropriate preparation for studies on INaR expression and function. However, in Purkinje cells and other cerebellar neuronal types, prominent INaRs have been observed even after acute dissociation (Raman & Bean, 1997; Afshari et al. 2004), although in such cases the dissociation protocol applied was different from ours. In Purkinje cells dissociated with the same enzymatic and mechanical procedure used for area 35 neurones, we found that a prominent INaR was still present, which suggests that the enzymatic treatment we applied is not sufficient, per se, to abolish INaR. Moreover, in nucleated patches from area 35 neurones INaR was not observed, which confirms the lack of this current from the somatic membrane of the cells under study. Experiments of focal pressure TTX application provided support to a preferential (or exclusive) axonal expression of the Na+ channels specifically responsible for INaR. In pyramidal neurones of PRC layer II the axon consistently emerges from the basal pole of the soma, and is directed towards the deeper layers (Faulkner & Brown, 1999). Since INaR could be inhibited to a significantly higher extent when TTX was focally applied slightly deep to the soma's basal pole than close to the soma's apical pole, it is likely that the channels that generate INaR are mostly located in the axon initial segment. Since the axon initial segment is believed to represent the site of neuronal signal encoding, the latter observation is not surprising in view of the contribution provided by INaR to depolarizing drive during tonic firing (see above), and therefore of its likely role in controlling neuronal discharge. Selective expression of INaR in the site of encoding would prevent passive attenuation effects that may be produced if the channels were located at some electrotonic distance from the encoder, thus making its contribution to the determination of firing properties stronger. Similarly, in neocortical pyramidal cells, the persistent component of the Na+ current, INaP, which may also importantly influence neuronal activity modalities, has been shown to rely on channels specifically located in the proximal axon (Astman et al. 2006).
Recent evidence supports a role for the Na+ channel auxiliary subunit, β4, as the molecular correlate of the resurgence mechanism in Purkinje cells (Grieco et al. 2005). It has been shown that a portion of this subunit's cytoplasmic tail (β4154–167) can restore INaR in neurones in which the current has been abolished by intracellular application of proteases (Grieco et al. 2005). Such data have been interpreted to mean that the β4154-167 region can bind to the main (α) subunit after channel opening, thus behaving as an open-channel blocker. The channel-blocking process is believed to prevent channel transition to the classical inactivated state, and the resurgence mechanism would consist of block removal by ion inflow upon repolarization (Raman & Bean, 2001). The β4 subunit is indeed expressed at high levels in Purkinje neurones (Yu et al. 2003). However, it does not appear to be expressed by PRC neurones in the mouse (Allen Brain Atlas, http://www.brain-map.org; see also Lein et al. 2007). Similarly, cerebellar granule cells, a majority of which are endowed with a prominent INaR, do not express the β4 subunit at high levels (Yu et al. 2003). This indicates that, although β4 could sustain the resurgence mechanism in Purkinje cells, the expression of this subunit and the presence of INaR are not necessarily correlated, and points to the possibility that multiple molecular substrates of INaR exists and are differentially expressed in different neuronal populations.
Acknowledgments
The authors thank Maximiliano J. Nigro for participating in some of the experiments, and Gabriele Ferrari for excellent technical assistance in the preparation of the pressure application system. This study was supported by a grant (PRIN 2005 no. 2005059453-003) from the Italian Ministry of Education, University and Research (MIUR) to G.B and J.M.
Supplemental material
Online supplemental material for this paper can be accessed at:
http://jp.physoc.org/cgi/content/full/jphysiol.2007.135350/DC1 and
http://www.blackwell-synergy.com/doi/suppl/10.1113/jphysiol.2007.135350
References
- Afshari FS, Ptak K, Khaliq ZM, Grieco TM, Slater NT, McCrimmon DR, Raman IM. Resurgent Na+ currents in four classes of neurons of the cerebellum. J Neurophysiol. 2004;92:2831–2843. doi: 10.1152/jn.00261.2004. [DOI] [PubMed] [Google Scholar]
- Akemann W, Knöpfel T. Interaction of Kv3 potassium channels and resurgent sodium current influences the rate of spontaneous firing of Purkinje neurons. J Neurosci. 2006;26:4602–4612. doi: 10.1523/JNEUROSCI.5204-05.2006. [DOI] [PMC free article] [PubMed] [Google Scholar]
- Astman N, Gutnick MJ, Fleidervish IA. Persistent sodium current in layer 5 neocortical neurons is primarily generated in the proximal axon. J Neurosci. 2006;26:3465–3473. doi: 10.1523/JNEUROSCI.4907-05.2006. [DOI] [PMC free article] [PubMed] [Google Scholar]
- Biella G, Uva L, de Curtis M. Propagation of neuronal activity along the neocortical-perirhinal-entorhinal pathway in the guinea pig. J Neurosci. 2002;22:9972–9979. doi: 10.1523/JNEUROSCI.22-22-09972.2002. [DOI] [PMC free article] [PubMed] [Google Scholar]
- Burwell RD. The parahippocampal region: corticocortical connectivity. Ann N Y Acad Sci. 2000;911:25–42. doi: 10.1111/j.1749-6632.2000.tb06717.x. [DOI] [PubMed] [Google Scholar]
- Burwell RD. Borders and cytoarchitecture of the perirhinal and postrhinal cortices in the rat. J Comp Neurol. 2001;437:17–41. doi: 10.1002/cne.1267. [DOI] [PubMed] [Google Scholar]
- Burwell RD, Amaral DG. Perirhinal and postrhinal cortices of the rat: interconnectivity and connections with the entorhinal cortex. J Comp Neurol. 1998a;391:293–321. doi: 10.1002/(sici)1096-9861(19980216)391:3<293::aid-cne2>3.0.co;2-x. [DOI] [PubMed] [Google Scholar]
- Burwell RD, Amaral DG. Cortical afferents of the perirhinal, postrhinal, and entorhinal cortices of the rat. J Comp Neurol. 1998b;398:179–205. doi: 10.1002/(sici)1096-9861(19980824)398:2<179::aid-cne3>3.0.co;2-y. [DOI] [PubMed] [Google Scholar]
- Castelli L, Magistretti J. High-voltage-activated Ca2+ currents show similar patterns of expression in stellate and pyramidal cells from rat entorhinal cortex layer II. Brain Res. 2006;1090:76–88. doi: 10.1016/j.brainres.2006.03.037. [DOI] [PubMed] [Google Scholar]
- Cummins TR, Dib-Hajj SD, Herzog RI, Waxman SG. Nav1.6 channels generate resurgent sodium currents in spinal sensory neurons. FEBS Lett. 2005;579:2166–2170. doi: 10.1016/j.febslet.2005.03.009. [DOI] [PubMed] [Google Scholar]
- de Curtis M, Paré D. The rhinal cortices: a wall of inhibition between the neocortex and the hippocampus. Prog Neurobiol. 2004;74:101–110. doi: 10.1016/j.pneurobio.2004.08.005. [DOI] [PubMed] [Google Scholar]
- Do MT, Bean BP. Subthreshold sodium currents and pacemaking of subthalamic neurons: modulation by slow inactivation. Neuron. 2003;39:109–120. doi: 10.1016/s0896-6273(03)00360-x. [DOI] [PubMed] [Google Scholar]
- Eichenbaum H. A cortical-hippocampal system for declarative memory. Nat Rev Neurosci. 2000;1:41–50. doi: 10.1038/35036213. [DOI] [PubMed] [Google Scholar]
- Enomoto A, Han JM, Hsiao CF, Wu N, Chandler SH. Participation of sodium currents in burst generation and control of membrane excitability in mesencephalic trigeminal neurons. J Neurosci. 2006;26:3412–3422. doi: 10.1523/JNEUROSCI.5274-05.2006. [DOI] [PMC free article] [PubMed] [Google Scholar]
- Faulkner B, Brown TH. Morphology and physiology of neurons in the rat perirhinal-lateral amygdala area. J Comp Neurol. 1999;411:613–642. [PubMed] [Google Scholar]
- Fleidervish IA, Gutnick MJ. Kinetics of slow inactivation of persistent sodium current in layer V neurons of mouse neocortical slices. J Neurophysiol. 1996;76:2125–2130. doi: 10.1152/jn.1996.76.3.2125. [DOI] [PubMed] [Google Scholar]
- Grieco TM, Afshari FS, Raman IM. A role for phosphorylation in the maintenance of resurgent sodium current in cerebellar Purkinje neurons. J Neurosci. 2002;22:3100–3107. doi: 10.1523/JNEUROSCI.22-08-03100.2002. [DOI] [PMC free article] [PubMed] [Google Scholar]
- Grieco TM, Malhotra JD, Chen C, Isom LL, Raman IM. Open-channel block by the cytoplasmic tail of sodium channel β4 as a mechanism for resurgent sodium current. Neuron. 2005;45:233–244. doi: 10.1016/j.neuron.2004.12.035. [DOI] [PubMed] [Google Scholar]
- Hamill OP, Marty A, Neher E, Sakmann B, Sigworth FJ. Improved patch-clamp techniques for high-resolution current recording from cells and cell-free membrane patches. Pflugers Arch. 1981;391:85–100. doi: 10.1007/BF00656997. [DOI] [PubMed] [Google Scholar]
- Khaliq ZM, Gouwens NW, Raman IM. The contribution of resurgent sodium current to high-frequency firing in Purkinje neurons: an experimental and modeling study. J Neurosci. 2003;23:4899–4912. doi: 10.1523/JNEUROSCI.23-12-04899.2003. [DOI] [PMC free article] [PubMed] [Google Scholar]
- Leão RN, Naves MM, Leão KE, Walmsley B. Altered sodium currents in auditory neurons of congenitally deaf mice. Eur J Neurosci. 2006;24:1137–1146. doi: 10.1111/j.1460-9568.2006.04982.x. [DOI] [PubMed] [Google Scholar]
- Lein ES, Hawrylycz MJ, Ao N, Ayres M, Bensinger A, Bernard A, et al. Genome-wide atlas of gene expression in the adult mouse brain. Nature. 2007;445:168–176. doi: 10.1038/nature05453. [DOI] [PubMed] [Google Scholar]
- Magistretti J, Alonso A. Biophysical properties and slow-voltage dependent inactivation of a sustained sodium current in entorhinal cortex layer-II principal neurons: a whole-cell and single-channel study. J Gen Physiol. 1999;114:491–509. doi: 10.1085/jgp.114.4.491. [DOI] [PMC free article] [PubMed] [Google Scholar]
- Magistretti J, Alonso A. Fine gating properties of channels responsible for persistent-sodium-current generation in entorhinal-cortex neurons. J Gen Physiol. 2002;120:855–873. doi: 10.1085/jgp.20028676. [DOI] [PMC free article] [PubMed] [Google Scholar]
- Magistretti J, Castelli L, Forti L, D'Angelo E. Kinetic and functional analysis of transient, persistent, and resurgent sodium currents in rat cerebellar granule cells in situ: an electrophysiological and modelling study. J Physiol. 2006;573:83–106. doi: 10.1113/jphysiol.2006.106682. [DOI] [PMC free article] [PubMed] [Google Scholar]
- Magistretti J, Castelli L, Taglietti V, Tanzi F. Dual effect of Zn2+ on multiple types of voltage-dependent Ca2+ currents in rat palaeocortical neurons. Neuroscience. 2003;117:249–264. doi: 10.1016/s0306-4522(02)00865-5. [DOI] [PubMed] [Google Scholar]
- Murray EA, Richmond BJ. Role of perirhinal cortex in object perception, memory, and associations. Curr Opin Neurobiol. 2001;11:188–193. doi: 10.1016/s0959-4388(00)00195-1. [DOI] [PubMed] [Google Scholar]
- Pan F, Beam KG. The absence of resurgent sodium current in mouse spinal neurons. Brain Res. 1999;849:162–168. doi: 10.1016/s0006-8993(99)02060-0. [DOI] [PubMed] [Google Scholar]
- Raman IM, Bean BP. Resurgent sodium current and action potential formation in dissociated cerebellar Purkinje neurons. J Neurosci. 1997;17:4517–4526. doi: 10.1523/JNEUROSCI.17-12-04517.1997. [DOI] [PMC free article] [PubMed] [Google Scholar]
- Raman IM, Bean BP. Inactivation and recovery of sodium currents in cerebellar Purkinje neurons: evidence for two mechanisms. Biophys J. 2001;80:729–737. doi: 10.1016/S0006-3495(01)76052-3. [DOI] [PMC free article] [PubMed] [Google Scholar]
- Raman IM, Gustafson AE, Padgett D. Ionic currents and spontaneous firing in neurons isolated from the cerebellar nuclei. J Neurosci. 2000;20:9004–9016. doi: 10.1523/JNEUROSCI.20-24-09004.2000. [DOI] [PMC free article] [PubMed] [Google Scholar]
- Sather W, Dieudonné S, MacDonald JF, Ascher P. Activation and desensitization of N-methyl-d-aspartate receptors in nucleated outside-out patches from mouse neurones. J Physiol. 1992;450:643–672. doi: 10.1113/jphysiol.1992.sp019148. [DOI] [PMC free article] [PubMed] [Google Scholar]
- Suzuki WA, Amaral DG. Perirhinal and parahippocampal cortices of the macaque monkey: cytoarchitectonic and chemoarchitectonic organization. J Comp Neurol. 2003;463:67–91. doi: 10.1002/cne.10744. [DOI] [PubMed] [Google Scholar]
- Witter MP, Room P, Groenewegen HJ, Lohman AH. Connections of the parahippocampal cortex in the cat. V. Intrinsic connections; comments on input/output connections with the hippocampus. J Comp Neurol. 1986;252:78–94. doi: 10.1002/cne.902520105. [DOI] [PubMed] [Google Scholar]
- Witter MP, Wouterlood FL. The Parahippocampal Region. Organization and Role in Cognitive Function. Oxford, UK: Oxford University Press; 2000. [Google Scholar]
- Young BJ, Otto T, Fox GD, Eichenbaum H. Memory representation within the parahippocampal region. J Neurosci. 1997;17:5183–5195. doi: 10.1523/JNEUROSCI.17-13-05183.1997. [DOI] [PMC free article] [PubMed] [Google Scholar]
- Yu FH, Westenbroek RE, Silos-Santiago I, McCormick KA, Lawson D, Ge P, Ferriera H, Lilly J, DiStefano PS, Catterall WA, Scheuer T, Curtis R. Sodium channel β4, a new disulfide-linked auxiliary subunit with similarity to β2. J Neurosci. 2003;23:7577–7585. doi: 10.1523/JNEUROSCI.23-20-07577.2003. [DOI] [PMC free article] [PubMed] [Google Scholar]
- Zola-Morgan S, Squire LR, Clower RP, Rempel NL. Damage to the perirhinal cortex exacerbates memory impairment following lesions to the hippocampal formation. J Neurosci. 1993;13:251–265. doi: 10.1523/JNEUROSCI.13-01-00251.1993. [DOI] [PMC free article] [PubMed] [Google Scholar]
Associated Data
This section collects any data citations, data availability statements, or supplementary materials included in this article.
Supplementary Materials
Online supplemental material for this paper can be accessed at:
http://jp.physoc.org/cgi/content/full/jphysiol.2007.135350/DC1 and
http://www.blackwell-synergy.com/doi/suppl/10.1113/jphysiol.2007.135350