Abstract
We studied the flow and mixing regimes in isolated segments of the terminal ileum of brushtail possums during spontaneous circumferential and longitudinal contractions under conditions that allowed backflow and compared them with those of inactive segments. Residence time distributions (RTDs) were determined by perfusion with two probes of different rheological properties to which an inert dye marker was added. Ileal segment volume and oscillatory flow during the period of RTD determination were derived from spatiotemporal maps. High viscosity guar gum solution generated RTDs characteristic of laminar flow in inactive ileal segments which confirmed that no slip was occurring at the mucosal layer. In active segments, motility and consequent oscillatory flow imparted significant additional axial dispersion to the flow patterns of both probes. Mixing occurred episodically during periods when intestinal volume was reduced and onflow was augmented by peristalsis, which may prevent the establishment of steady state conditions. Marker concentration rose more steeply when active ileal segments were being perfused with a probe of similar viscosity to normal digesta than with low viscosity Earle's/Hepes solution, each being subject to similar levels of oscillatory flow. This indicated that a coarser mixing regime prevailed and that absorption of nutrients from viscous digesta would rely to a greater degree on molecular diffusion.
A longstanding problem in intestinal physiology is whether mixing of intestinal contents that is sufficient to secure optimal digestion and absorption can be established in a tubular structure by wall movements that are too slow to impart turbulence even with digesta of watery consistency (Melville et al. 1975; Macagno & Christensen, 1981; Weems, 1982).
From a fluid dynamics perspective, the intestine may be most simply represented as a pipe with constant through flow. In such a system the flow regime will be laminar or turbulent depending on the relative magnitudes of viscous and inertial forces as characterized by the Reynolds number (Re). When viscous forces predominate the flow is laminar, or conversely when inertial forces dominate, the fluid will form eddies with widely different length and time scales, and the flow becomes turbulent.
Thus, the flow rate and physical properties of a Newtonian fluid may be used to predict its pattern of flow in a simple round pipe, with laminar flow generally occurring when Re is < 2000 and turbulent flow when Re is > 3000. However such predictions become more difficult in tubular systems where flow is pulsatile, and radial and axial geometries are inconstant, as these parameters may influence the calculation of inertia. The situation is further complicated if the contained fluid is non-Newtonian as with herbivore digesta (Lentle et al. 2005).
Modelling the flow of non-Newtonian fluids in simple tubular systems indicates that some types of wall movement may be sufficient to induce the formation of mixing vortices (Melville et al. 1975; Macagno & Christensen, 1981; Jeffrey et al. 2003). However, few models have incorporated real physical properties of digesta and intestinal wall dynamics, which may have profound effects on the establishment and extent of such vorticeal motion.
A body of work has been based on models that assume that mixing in the small intestine approaches that of a series of continuous stirred tank reactors (CSTRs) (Penry & Jumars, 1987; Jumars, 2000a,b). Thus as the number of CSTRs in a linear series increases and their relative volume decreases, the flow dynamics approach those of a tube with perfect radial but little axial mixing. Such a system would progressively and efficiently (Jumars, 2000b) reduce the ambient concentrations of reactants and products of digestion, provided the physical properties of digesta permit the establishment of successive regions of radial turbulence each with little axial mixing, i.e. axial dispersion. However recent work indicates that small intestinal digesta is sufficiently viscous and viscoelastic (Lentle et al. 2002, 2005, 2006) as to reduce the likelihood of such fluid dynamics occurring. Further, that the presence of significant quantities of particulate matter may cause the fluid phase to be peripherally extruded from the solid phase of digesta during peristalsis and to interfere with the propagation of shear from the wall, promoting unstirred plug flow (Lentle et al. 2005).
Differing types of intestinal motility may have differing effects on contained fluids when they behave in a non-Newtonian manner Thus peristalsis, the concerted action of longitudinal and circular smooth muscles (Bayliss & Starling, 1899; Spencer et al. 1999; Stevens et al. 2000), sleeve contraction, the isolated contraction of longitudinal muscle (Christensen, 1960; Melville et al. 1975; Macagno & Christensen, 1980) and segmentation, the isolated action of circular smooth muscle (Davenport, 1977), may each induce different types and extents of flow. Again the extent of propagation of contractions along the small intestine and the timing between successive contractions may also influence the degree of mixing. Thus when a contraction propagates over an upwardly curved segment of bowel (Amidon et al. 1991; Arun, 2004) a sufficient period of relaxation may permit backflow from the vertical to the conjoined horizontal component. As far as we are aware the latter situation has not been incorporated into a model nor has it been evaluated in physiological preparations. Indeed, the bulk of work characterizing the activity of isolated segments of gut has been concerned with motility rather than with mixing of the contents (Weems, 1982). Moreover, physiologists have tended to use experimental set-ups with one-way valves or with direct draining of the aboral end of the gut segment (Trendelenburg, 1917; Lammers et al. 2006) that preclude backflow.
An alternative method to mathematical modelling for investigating the extent and type of mixing is the measurement of flow outcomes in real biological systems. Thus the predominant type of flow regime existing in a tubular or other reactor system may be inferred from differences in the amounts of time that particular ‘marked’ elements of fluid spend in the system. The pattern of mixing of early with later arriving elements in material exiting the system, i.e. the residence time distribution (RTD) will differ under laminar or turbulent flow conditions (Danckwerts, 1953; Levenspiel, 1999).
Similar marker based methods have been used in determining whole gut transit time but their use in accurately determining the flow regime in particular gut segments is complicated by the passage of the solid or liquid phase markers though a sequence of ‘reactors’ each with differing flow regimes. Further complications arise from the relative retention of particulate markers with respect to the liquid phase in particular gut segments (Forbes & Tribe, 1970; Dellow, 1982; Hume, 1999) and from changes in the relative concentrations of the markers following absorption of the fluid phase and digestion of the solid phase.
The purpose of the current work was to quantify the flow pattern and the extent of mixing in active isolated segments of possum ileum under standardized physiological conditions. We evaluated flow patterns and mixing during step perfusions of dye-marked rheometric probes whilst simultaneously determining the cumulative volumetric change that resulted from spontaneous peristaltic contractions by spatiotemporal mapping so as to standardize between probes for intestinal activity.
Methods
A 14 cm segment of terminal ileum was mounted in an organ bath in the configuration described by Lentle et al. (2007). This configuration simulated in vivo flow and pressure conditions in vertically curved gut by use of an aborally mounted simple ‘L’ fitting of large internal diameter (0.8 cm) with a 3 cm vertical effluent arm which limited the hydrostatic head and allowed transient backflow.
Each ileal segment was perfused with a rheometric probe comprising either Earle's/Hepes buffer solution (HBS) or a solution of guar gum rather than with rheometrically characterized digesta. The use of these probes avoided any confounding effects of nutrients so that, any differences in RTDs between probes would result only from differences in their rheometric properties and flow characteristics.
Preparation of ileal segments
All procedures were approved by Massey University Animal Ethics Committee (no. 06/21). Four freshly trapped brushtail possums of either sex of between 2 and 3 kg body weight were each fasted for 4 h and then anaesthetized in an induction chamber with 5% halothane in 33% oxygen and 66% nitrous oxide. They were subsequently maintained on 1.5% halothane in oxygen and nitrous oxide via a face mask attached to a Bain's circuit during the surgery. The small intestine was accessed via a ventral midline abdominal incision and a 30 cm length of terminal ileum immediately orad to the ileocaecal junction was resected. The possum was subsequently killed with intracardiac pentobarbitone (125 mg kg−1).
The excised portion of ileum was placed immediately in oxygenated HBS maintained at 37°C and divided in two. The distal half of the excised segment was flushed clean of digesta with physiological saline, cannulated at the oral and aboral ends, and mounted in a heated organ bath containing HBS, pH 7.35, with the following composition (mm): NaCl 124.0, KCl 5.4, MgSO4 0.8, NaH2PO4 1.0, NaHCO3 14.3, Hepes 10.0, CaCl2 1.8 and glucose 5.0. The solution was continuously oxygenated (95% O2–5% CO2) and kept at 37°C.
The proximal half of the excised segment was rendered inactive by placing it in anoxic HBS for 5 h. This inactive segment was subsequently attached to the apparatus in the same manner as the active segment. This procedure was adopted, rather than repeating the step response measurement on the active segment after it had been inactivated, to avoid contamination from residual dye from the first measurement.
Preparation of probes
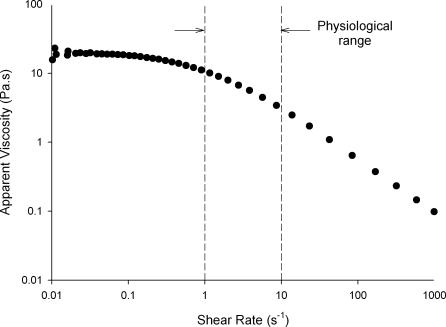
Two probes were used; HBS or 1% guar gum (Hawkins Watts, New Zealand). The guar gum was dispersed in deionized water, mixed with a magnetic stirrer and heated briefly to 80°C in water bath for 30 min. A sample of each probe was coloured by the addition of 0.1% w/v Brilliant Blue (Bronson and Jacobs, New Zealand). The flow curve of the guar gum probe was determined at 37°C on a SR-5000 rheometer (Rheometric Scientific, USA) using a cone (2 deg and 40 mm diameter) and plate geometry. The curve in (Fig. 1 shows a pseudoplastic effect, i.e. decrease in apparent viscosity with increase in shear rate, at physiological shear rates.
Figure 1. Flow curve for guar gum solution used as a viscous probe.
Theoretical considerations in determination of flow regime from RTDs
RTDs may be determined following the orderly injection of a marker into the feed stream either as a single bolus (impulse) or as a prolonged (step) change. In the case of an impulse injection, the area under the curve describing the changes in concentration of dye over time in the emerging fluid is usually scaled to unity to give an ‘E-curve’ (Levenspiel, 1999). In the case of step response curves, the dye concentrations are usually each divided by the final concentration to give an ‘F-curve’ (Levenspiel, 1999). In both curves the actual time is divided by the mean residence time  to give the normalized time θ. Treatment of marker concentration data in this manner facilitates comparison of the RTDs of systems with differing volumes, flow rates and dye concentrations. Moreover, E-curves can be converted to F-curves by integration or vice versa by differentiation.
The RTD of a single tubular element varies according to the flow regime and type of mixing within it. If the regime is laminar and there is little radial mixing, then for Newtonian fluids the velocity profile across the radial dimension of the tube is parabolic and the RTD is given by:
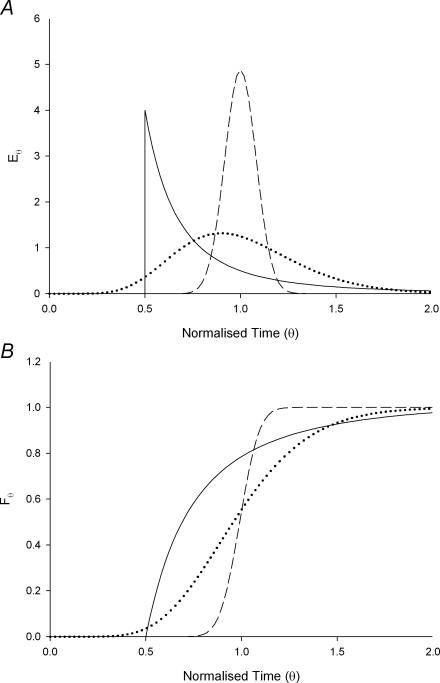
where c(t) is the marker concentration at time t. This results in an RTD profile of the form shown in Fig. 2A. Under such conditions the fluid at the centre of the tube moves the fastest, at twice the mean velocity whilst the fluid adjacent to the wall will have a much longer residence time so as to give the RTD a long tail.
Figure 2. Theoretical impulse E-curves (A) and step response F-curves (B) for a tube with laminar (continuous line) and turbulent flow regimes (dashed line), and for a tanks-in-series model (dotted line).
The E-curves are scaled so that the area under each curve is the same. The turbulent regime has a Peclet number of 300 and tanks-in-series model consists of 10 equal volume tanks.
Turbulent flow regimes will cause the velocity profile to be more evenly distributed across the radial dimension of the tube, but there will be appreciable admixture of late and early arriving elements from eddies (axial dispersion) causing the E-curve to broaden to a bell shaped appearance (Fig. 2A). The latter effect causes the RTD curve of turbulent flow to differ from that of true plug flow, where the velocity profile is also distributed evenly across the radial dimension of the tube but with no axial dispersion so that undisturbed viscous material progresses with a square ended velocity profile in a manner similar to tooth paste though a tube. The relative importance of axial dispersion is quantified by the Peclet number (the ratio of advective movement to diffusivity). In true plug flow, the peak of the impulse in the E-curve occurs  seconds after the time of introduction, i.e. all portions of the injected fluid have the same residence time. In practice many systems have an RTD conformation that results from a combination of the idealized RTDs discussed above.
Complications often arise from the tracer injector or the outlet sampling mechanism acting as an additional mixing component and contributing to the final mixing outcome. These effects may be removed from that of the element of interest by ‘deconvolution’ (Levenspiel, 1999). This process depends on the fact that when fluid flows though a succession of functionally independent components the overall RTD is a summation of their consecutive (convoluted) effects. Thus deconvolution involves separately determining the contribution of individual compartments such as the tracer injector and mathematically subtracting these from the overall RTD (Levenspiel, 1999).
Step response measurement
Replicate step responses were measured for each of the two probes using a fresh active specimen for each measurement. The segments were perfused at a rate of 30.4 ml h−1, which was calculated to match that used for guinea pig small intestine by other workers (Hennig et al. 1999) on the basis of the larger diameter and consequent volume of the possum ileum. Clear probe was perfused for 30 min pending recovery of the organ from anaesthesia characterized by the resumption of regular peristalsis. Image acquisition and collection of effluent samples (every minute for 80 min) were commenced with the switch from colourless to coloured probe solution. Samples were omitted in situations where flow had ceased at the sampling time as a result of the relaxation of a contraction with consequent backflow.
The dye concentration of each effluent sample was measured by diluting 50 μl of sample with 4950 μl of deionized water and further diluting 500 μl of this solution with 4500 μl of water. The absorbances of these diluted solutions were determined at 630 nm using a U-2001 spectrophotometer (Hitachi, Ibaraki, Japan).
Flow calibration of apparatus and other non-ileum RTDs
Similar procedures were used to determine the step response RTD of a length of silicone tubing of similar length and internal diameter to that of the ileal segments in order to assess the flow regime with each of the probes in a rigid walled tube of similar dimensions to the ileal segments but with no mucosa. Similarly the step response of the juxtaposed inlet and outlet fittings (with no ileal segment or silicone tube present) was determined so as to provide a further basis of comparison.
Mapping of motility
A monochrome video camera (Leutron Vision LV-75 CE, Glattbrugg, Switzerland) with a zoom lens (Cosmicar 12.5–75 mm) was mounted 45 cm above the organ bath. The output from this unit was directly connected to a PC equipped with a frame grabber card (National Instruments IMAQ PCI-1409). Images of 752 × 400 pixels were captured at 5 frames s−1 with one pixel corresponding to 0.17 mm.
The procedures used to map ileal motility from the image sequences are described in Lentle et al. (2007) and were similar to those used by other researchers (Hennig et al. 1999). The D map was compiled with the long axis of the intestine in the horizontal (x) direction and with successive scans stacked sequentially in the vertical (y) dimension, i.e. with run time increasing downwards from the top of the map. Thus each row of the D map corresponded to a single frame with the intensity of each map pixel at a given point along the length corresponding to the diameter at that point. A smaller diameter was represented by a lighter pixel shade and a larger diameter by a darker shade.
Determination of oscillatory flow index and derivation of RTD curves
A number of parameters were derived from the D map. The mean frequency of peristalsis was determined from the distance in the y direction between such events. The mean peristaltic velocity was calculated from the slope of the front of these events. The volume of an ileal segment at a particular time was determined from the corresponding row of the D map assuming it was a cylinder of variable diameter and had a constant wall thickness of 0.5 mm. The mean ileal volume was calculated over the measurement period between the commencement and the termination of marker perfusion.
In order to obtain a realistic comparison between the effects of the various rheometric probes we needed to standardize for the total of mixing movements that had taken place during the period of perfusion of the probe, particularly in view of the fact that each segment was perfused with only one of the probes. This was done by deriving an index for the cumulative change in the volume of the gut from the D maps taken over the perfusion period which we term the ‘oscillatory flow index’ and is given by the formula given below. The oscillatory flow index can be understood as the time taken for the cumulative oscillatory flow to equal the ileal segment volume.
 |
where  is the mean segment volume, ΔV is the change in volume between two D map rows, n is number of D map rows, and Δt is the time between frames (i.e. 0.2 s).
To generate an RTD curve in the manner described above, the dye concentrations were each divided by the final dye concentration and the time axis was normalized by division by the average residence time  . The volume of the inlet and outlet fittings was added to the mean of the ileal volumes computed from the D maps to derive the mean system volume. The latter was divided by the perfusion rate to obtain
  .
.
Results
RTDs of simple tubes
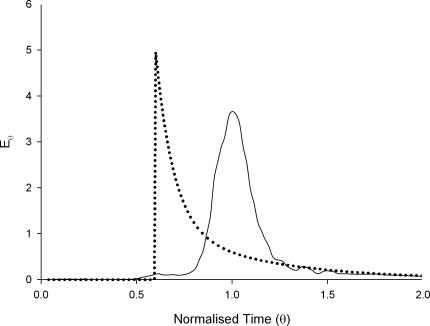
The step responses of marker concentration were measured for both probes following flow though a silicon rubber tube. The responses were differentiated and scaled to generate the impulse responses (E-curves) shown in Fig. 3. The E-curve of HBS was bell shaped and peaked at a normalized time θ of 1, a position that is characteristic of a turbulent flow regime. The guar gum solution had an exponential decay E-curve typical of a laminar flow regime with maximal residence time occurring at a θ-value of 0.6.
Figure 3. Impulse response RTDs for HBS (continuous line) and guar gum (dotted line) solutions in silicon rubber tubing.
RTDs of inactive terminal ileum
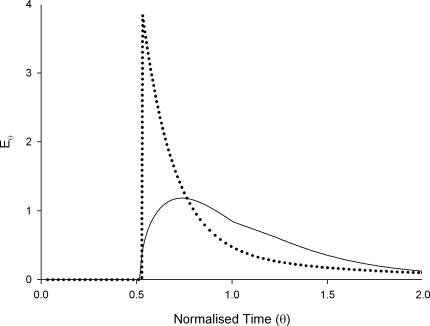
The step responses obtained when both probes were perfused through the inactivated ileal segments were smoothed, differentiated and scaled to generate E-curves (Fig. 4). The guar gum solution had an exponential decay E-curve typical of a laminar flow regime. The HBS curve was of a more complex humped form indicative of turbulence.
Figure 4. Impulse response RTDs for HBS (continuous line) and guar gum (dotted) perfusates in inactive ileal segments.
RTDs of active terminal ileum
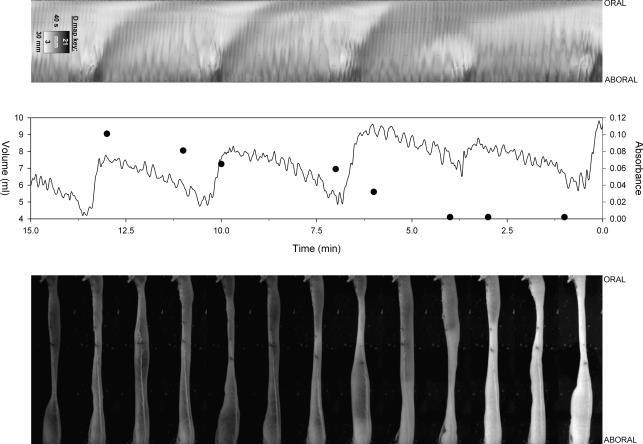
A synchronized set of graphs of raw data and video images taken from the second guar gum replicate is shown in Fig. 5. This sample was chosen because the comparatively small ileum (average volume 6.5 ml) allowed the progression of the marked perfusate to be followed in the original images to the right. The D map (left) showed an underlying and continuing high frequency ‘fast activity’ of alternate faint light and dark lines of shallow slope corresponding to a basal frequency of 9.2 cycles min−1 as reported in previous work by us (Lentle et al. 2007). More persistent but less frequent peristaltic events were seen on the D map as less frequent broader bands of lighter tone that were more steeply angled as they traversed the length of the ileal segment more slowly. The peristaltic events were each preceded by a darker region due to transient aboral radial distension as has been previously reported (Lentle et al. 2007).
Figure 5. D map, graph of volume (continous line) and effluent absorbance (•), and original images of active ileal segment with guar gum perfusate.
The images were taken every 1.25 min over the period 0–15 min.
The graphs of changes in the total volume of the ileal segment over time (Fig. 5) showed a fast oscillation of similar frequency to the fast activity in the D map and less frequent larger oscillations that were concurrent with peristaltic events. Marker concentration increased periodically at times that were concurrent with large volume reductions due to peristaltic events. Direct observation of the dye fronts showed that large increases in the total volume of the ileum were accompanied by temporary reversals of the direction of flow (from aborad to orad) at the outlet. This led to temporary cessations of outflow which periodically prevented determination of marker concentration, as seen by the missing absorbance data points.
There were no significant differences between the probes in mean frequency of peristalsis, rate of progression of peristalsis, segment volume and oscillatory flow index value during step perfusion (Table 1). Judging by the relative frequency and magnitude of the two types of oscillations (Fig. 5), low volume fast activity was the main contributor to the oscillatory flow index.
Table 1.
Peristalsis parameters derived from D maps
| Probe type§ | Peristalsis frequency† (min−1) | Peristaltic velocity† (cm min−1) | Mean segment volume (ml) | Oscillatory flow index (min) |
|---|---|---|---|---|
| HBS | 0.43 (0.11) | 3.0 (1.0) | 9.1 | 0.99 |
| 0.36 (0.09) | 4.5 (0.8) | 10.7 | 1.45 | |
| Guar gum | 0.58 (0.07) | 4.8 (0.8) | 16.6 | 0.89 |
| 0.49 (0.15) | 6.2 (1.5) | 6.5 | 1.08 |
Two replicates are shown for each probe.
Standard deviation given in parentheses.
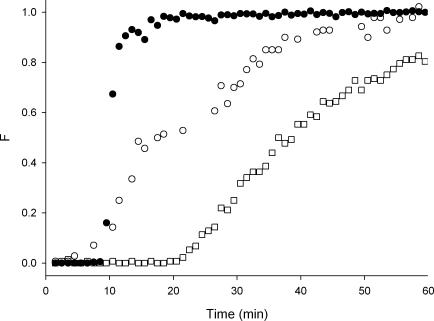
The step responses following perfusion of an active ileal segment with HBS are shown in Fig. 6. These graphs are plotted in real rather than normalized time to allow a direct temporal comparison of the step response for the juxtaposed inlet and outlet fittings, with that of an inactive and active segment. Marker appeared in the outflow from the active segment prior to the time that it appeared in that from the juxtaposed fittings even though the overall volume of the former was much larger.
Figure 6. Step responses for HBS perfusate in juxtaposed fittings only (•), and in active (^) and inactive (□) ileal segments.
Note that the time axis has not been normalized in this graph.
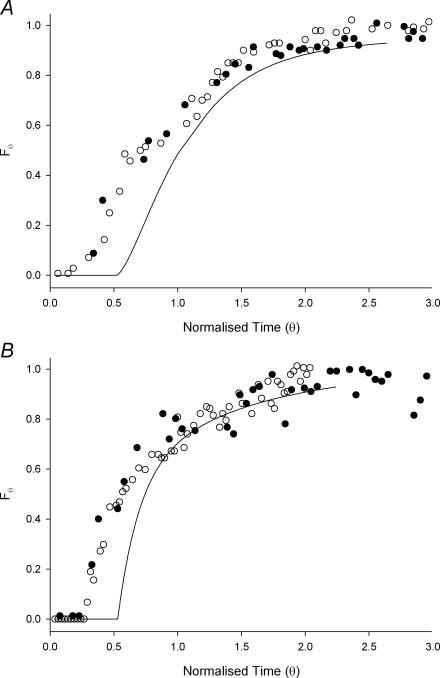
The RTD profiles following perfusion of active segments of ileum with both probes are shown as normalized step response concentration measurements (Fig. 7). These are shown in F-curve form as it was not possible to smooth and differentiate these curves to obtain reliable E-curves because of short-term fluctuations in marker concentration. The two replicates shown in Fig. 7B, with ileal volumes of 16.6 ml and 6.5 ml, respectively, had markedly different step responses but produced very similar RTD curves.
Figure 7. Step responses (F-curves) for HBS (A) and guar gum (B) perfusates.
Each graph shows two replicates (^, •) from active ileal segments and one from an inactive segment (continous line).
Discussion
This paper is the first to apply marker residence time methodologies developed for chemical reactors to an isolated living segment of the intestinal tract. This methodology shows acceptable levels of reproducibility of F-curves obtained from different animals with widely differing ileal volumes (Fig. 7B). However, the use of classical deconvolution procedures to separate the RTDs of the ileum from those of the inlet and outlet fittings was not possible as periodic backflow meant that the flow elements were not independent (Levenspiel, 1999).
RTDs of simple tubes
We compared the RTDs of the probe solutions (Fig. 3) flowing through a plain rubber tube of similar dimensions to the ileal segments with the theoretical RTD outcomes shown in Fig. 2A. The E-curve peaks for guar gum solution appeared at a θ-value of 0.6. Fully developed laminar flow of Newtonian fluids in a circular pipe should give an exponentially decaying E-curve with an initial peak at a θ of 0.5. However shear thinning (pseudoplastic) fluids such as the guar gum solution should produce a flatter velocity profile with the peak θ shifted to a value > 0.5. Thus the results confirmed that this probe exhibited visocelasticity in the experimental system. The E-curve for the viscid probe (i.e. guar gum) had the shape characteristic of the laminar flow regime. This was in line with expectations as the calculated Reynolds number was very low (10−4). This is likely to be a form of laminar flow termed creep flow where inertial forces are so low they can be completely neglected (Sakiadis, 1984).
The E curve for HBS was bell shaped and centred on a θ-value of 1 indicating that some turbulence was present, in spite of the fact that the Reynolds number was estimated to be between 1 and 2, i.e. was low. This was probably because some residual turbulence from the inlet fitting had persisted along the length of the pipe. The distance required before a laminar flow regime becomes established is typically around 50–100 pipe diameters in engineering systems (Sakiadis, 1984) but depends strongly on the Reynolds number. This distance requirement is due to the finite time needed for viscous forces to dissipate eddies, which differs between watery and viscid digesta.
RTDs of the terminal ileum
Inactive ileum
The impulse response curve of guar gum solution flowing through a section of inactive ileum also showed a pattern of exponential decay characteristic of laminar flow (Fig. 4). This curve form indicated that there was no slip at the mucosal wall as this would have had ‘squared up’ the velocity profile to give a narrow bell-shaped curve centred on a θ-value of 1. This lack of slip occurred under conditions that were similar to those in vivo in that the mucosa was intact at the completion of each run, i.e. showed no areas of roughness or sloughing due to anoxia (a similar lack of slip was demonstrated in the RTD curve obtained from a segment of ileum that had been rendered inactive with 10 μm verapamil, a calcium channel blocker). Moreover if anoxic conditions caused mucus thickness to be augmented it would be expected that slip at the wall would have been enhanced.
The RTD for HBS in the inactive ileum was slightly less turbulent than for a plain rubber tube. This is likely to be a consequence of the larger diameter of the distended inactive segment of ileum giving a lower Reynolds number and hence shortening the length of intestine required for laminar flow to become established.
Active ileum
The fact that the oscillatory index values were of the same order of magnitude and range for both probes indicated that they were subject to the same degree of contractile mixing and thus that comparisons of their RTDs were meaningful. It is interesting to note that the peristaltic frequency and velocity were of the same order of magnitude during the perfusion of both probes, a finding supporting earlier directly comparative work (Lentle et al. 2007).
The non-normalized step responses for HBS show that marked material transited the active ileal segment and fittings more quickly than it did the juxtaposed fittings alone (Fig. 6). This finding was significant considering the much larger volume (12.7 ml for the ileum plus ends versus 3.6 ml for the ends alone). Thus the oscillatory flow due to the combination of fast activity and peristalsis generated significant additional turbulence and axial dispersion both in the ileal segment and in the ‘L’ shaped outlet fitting. The early commencement of the RTD curve for HBS (Fig. 7A) at a θ-value of 0.2 and the small oscillatory flow indexes in Table 1 indicate the strength of this mixing effect.
When active ileal segments were perfused with viscous guar gum solution (Fig. 7B) the marked material also appeared more promptly in solutions exiting from active than from inactive ileal segments. Marked viscous material first appeared from active segments at θ-values of 0.25–0.3, less than the value of 0.5 expected for simple laminar flow. Thus ileal motility was able to induce axial mixing of viscous probes that had exhibited laminar flow when traversing inactive ileal segments. Given that the apparent viscosity of this probe was close to that of naturally occurring digesta (Lentle et al. 2005) this indicates that small intestinal motility is able to generate significant mixing to improve mass transfer of digesta and hence absorption of nutrients.
The F-curves for the viscid probe (Fig. 7B) rose more steeply in their initial segments than those for HBS (Fig. 7A). While not differentiating absolutely between laminar mixing and turbulence, this finding indicates that the flow/mixing regimes differ between viscous and watery perfusates. Hence, when low viscosity solutions traverse an active length of ileum a turbulent flow with a wide range of eddy sizes which include microscale eddies is produced whilst a laminar mixing regime with larger eddies is produced when viscous solutions traverse the active ileum. In the latter case, the mass transfer of nutrients to the mucosa will rely to greater degree on molecular diffusion and hence will be less efficient when there are time constraints on the process of digestion (Penry & Jumars, 1987).
It is likely that mixing was aided by the experimental configuration, in particular the use of an ‘L’ outlet fitting, which is broadly analogous to the abutment of a passive vertical element with an active length of small intestine allowing for backflow (Amidon et al. 1991). In vivo mixing may be further augmented by the tortuous nature of the small intestinal lumen (Arun, 2004). Systems of twisted pipes are known to improve the RTDs of chemical reactors containing fluids with low Reynolds numbers (Castelain et al. 1997). The bends in these systems induce regular vortices termed Dean roll-cells that can assist with radial mixing, especially if the angles between bends are chosen chaotically rather than helically so that chaotic advection is induced.
It is noteworthy that in at least one run the marker concentration did not appear to be uniform along the ileum but formed islands of darker colour that progressed in a pulsatile manner. These islands were observed directly during perfusion of viscous pseudoplastic probes and may have resulted from a tendency for backflow to lower the viscosity of perfusate at the wall at the point of greatest shear stress rather than in the centre of the perfusate plug. This would allow unmarked material to be drawn around the periphery of, and accumulate orad to, an island of marked material during relaxation.
The finding that mixing of viscous digesta occurs in steps that are temporally related to peristaltic events suggests that ileal mucosa is exposed to significant fluctuations in the concentrations of nutrients rather than a particular nutrient concentration. This brings into question the use of models based on the orderly reduction of nutrient concentrations along the length of the small intestine (Jumars, 2000a).
References
- Amidon GL, Debrincat GA, Najib N. Effects of gravity on gastric emptying, intestinal transit and drug absorption. J Clin Pharamacol. 1991;31:968–973. doi: 10.1002/j.1552-4604.1991.tb03658.x. [DOI] [PubMed] [Google Scholar]
- Arun CP. The importance of being asymmetric: the physiology of digesta propulsion on earth and in space. Ann N Y Acad Sci. 2004;1027:74–84. doi: 10.1196/annals.1324.008. [DOI] [PubMed] [Google Scholar]
- Bayliss W, Starling EH. Movements and innervation in the small intestine. J Physiol. 1899;24:99–143. doi: 10.1113/jphysiol.1899.sp000752. [DOI] [PMC free article] [PubMed] [Google Scholar]
- Castelain C, Mokrani A, Legentilhomme P, Peerhossaini H. Residence time distribution in twisted pipe flows: helically coiled system and chaotic system. Exp Fluids. 1997;22:359–368. [Google Scholar]
- Christensen J. Responses of smooth muscle to quick stretch; relation of stretch to conduction. Am J Physiol. 1960;198:921–925. doi: 10.1152/ajplegacy.1960.198.5.921. [DOI] [PubMed] [Google Scholar]
- Danckwerts PV. Continuous flow systems; distribution of residence times. Chem Eng Sci. 1953;2:1–13. [Google Scholar]
- Davenport HW. Physiology of the Digestive Tract: An Introductory Text. 4. Chicago: Year Book Medical Publishers; 1977. [Google Scholar]
- Dellow DW. Studies on the nutrition of macropodine marsupials. III. The flow of digesta through the stomach and intestine of macropodines and sheep. Aust J Zoo. 1982;30:391–398. [Google Scholar]
- Forbes DK, Tribe DE. The utilisation of roughages by sheep and kangaroos. Aust J Zoo. 1970;18:247–256. [Google Scholar]
- Hennig GW, Costa M, Chen BN, Brookes SJH. Quantitative analysis of peristalsis in the guinea-pig small intestine using spatio-temporal maps. J Physiol. 1999;517:575–590. doi: 10.1111/j.1469-7793.1999.0575t.x. [DOI] [PMC free article] [PubMed] [Google Scholar]
- Hume ID. Marsupial Nutrition. Cambridge: Cambridge University Press; 1999. [Google Scholar]
- Jeffrey B, Udaykumar HS, Schultze KS. Flow fields generated by peristaltic reflex in isolated guinea pig ileum: Impact of contraction depth and shoulders. Am J Physiol Gastrointest Liver Physiol. 2003;285:G907–G918. doi: 10.1152/ajpgi.00062.2003. [DOI] [PubMed] [Google Scholar]
- Jumars PA. Animal guts as ideal chemical reactors; maximising absorption rates. Am Nat. 2000a;155:527–543. doi: 10.1086/303333. [DOI] [PubMed] [Google Scholar]
- Jumars PA. Animal guts as non-ideal chemical reactors; partial mixing and axial variation in absorption kinetics. Am Nat. 2000b;155:544–555. doi: 10.1086/303334. [DOI] [PubMed] [Google Scholar]
- Lammers WJEP, Lammers-van de Berg AM, Morrison JFB, Petroianu GA. Translating Trendelenberg; back to the future. Naunyn-Schmiedebergs's Arch Pharmacol. 2006;373:134–138. doi: 10.1007/s00210-006-0051-8. [DOI] [PubMed] [Google Scholar]
- Lentle RG, Hemar Y, Hall CE. Viscoelastic behaviour aids extrusion from and reabsorption of the liquid phase into the digesta plug: creep rheometry of hindgut digesta in the common brushtail possum Trichosurus vulpecula. J Comp Physiol B. 2006;176:469–475. doi: 10.1007/s00360-006-0068-9. [DOI] [PubMed] [Google Scholar]
- Lentle RG, Hemar Y, Hall CE, Stafford KJ. Periodic fluid extrusion and models of digesta mixing in the intestine of a herbivore, the common brushtail possum (Trichosurus vulpecula) J Comp Physiol B. 2005;175:337–347. doi: 10.1007/s00360-005-0490-4. [DOI] [PubMed] [Google Scholar]
- Lentle RG, Janssen PWM, Asvarujanon P, Chambers P, Stafford KJ, Hemar Y. High definition mapping of circular and longitudinal motility in the terminal ileum of the brushtail possum Trichosurus vulpecula with watery and viscous perfusates. J Comp Physiol B. 2007 doi: 10.1007/s00360-007-0153-8. (in press, DOI: 10.1007/s00360-007-0153-8) [DOI] [PubMed] [Google Scholar]
- Lentle RG, Stafford KJ, Kennedy MS, Haslett SJ. Rheological properties of digesta suggest little radial or axial mixing in the forestomach of the tammmar (Macropus eugenii) and the parma (Macropus parma) wallaby. Physiol Zoo. 2002;75:572–582. doi: 10.1086/345484. [DOI] [PubMed] [Google Scholar]
- Levenspiel O. Chemical Reaction Engineering. 3. New York: John Wiley; 1999. [Google Scholar]
- Macagno EO, Christensen J. Fluid mechanics in the duodenum. Ann Rev Fluid Mech. 1980;12:139–158. [Google Scholar]
- Macagno EO, Christensen J. Fluid mechanics of gastrointestinal flow. In: Johnson LR, editor. Physiology of the Gastrointestinal Tract. 1. New York: Raven Press; 1981. pp. 335–358. [Google Scholar]
- Melville J, Macagno EO, Christensen J. Longitudinal contractions in the duodenum: their fluid-mechanical function. Am J Physiol. 1975;228:1887–1892. doi: 10.1152/ajplegacy.1975.228.6.1887. [DOI] [PubMed] [Google Scholar]
- Penry DL, Jumars PA. Modelling animal guts as chemical reactors. Am Nat. 1987;129:69–96. [Google Scholar]
- Sakiadis BC. Fluid and particle mechanics. In: Perry RH, Green DW, editors. Perry's Chemical Engineers' Handbook. 5. New York: McGraw-Hill; 1984. [Google Scholar]
- Spencer N, Walsh M, Smith TK. Does the guinea-pig ileum obey the ‘law of the intestine’? J Physiol. 1999;517:889–898. doi: 10.1111/j.1469-7793.1999.0889s.x. [DOI] [PMC free article] [PubMed] [Google Scholar]
- Stevens RJ, Publicover NG, Smith TK. Propagation and neural regulation of calcium waves in longitudinal and circular muscle layers of guinea pig small intestine. Gastroenterology. 2000;118:892–904. doi: 10.1016/s0016-5085(00)70175-2. [DOI] [PubMed] [Google Scholar]
- Trendelenburg P. Physiologische und pharmakologische Versuche über die Dünndarm Peristaltick. Naunyn-Schmiedebergs Arch Exp Pathol Pharmakol. 1917;81:55–129. doi: 10.1007/s00210-006-0052-7. [DOI] [PubMed] [Google Scholar]
- Weems WA. Intestinal wall motion, propulsion, and fluid movement: trends toward a unified theory. Am J Physiol Gastrointest Liver Physiol. 1982;243:G177–G188. doi: 10.1152/ajpgi.1982.243.3.G177. [DOI] [PubMed] [Google Scholar]


