Abstract
Common acute injuries to skeletal muscle can lead to significant pain and disability. The current therapeutic approaches for treating muscle injuries are dependent on the clinical severity but not on the type of injury. In the present studies, the pathophysiology and molecular pathways associated with two different types of skeletal muscle injury, one induced by direct destruction of muscle tissue (i.e. FI) and the other induced by a contractile overload (more specifically high-force eccentric contractions, i.e. CI) were compared side by side. Histopathological evaluation and measurements of muscle strength were accompanied by analyses of expression for 12 488 known genes at four time points ranging from 6 h to 7 days after injury. Real-time RT-PCR was used to confirm some of the injury type differences in the temporal profiles of gene expression. Our data revealed several pools of genes, including early induction of transcription, myogenic and stress-responsive factors, common for both types of injury as well as pools of genes expressed specifically with one of the injury types. Only CI activated a set of genes associated with the repair of impaired proteins and structures including genes related to apoptosis, whereas FI uniquely activated gene sets involved in extensive inflammatory responses, tissue remodelling, angiogenesis and myofibre/extracellular matrix synthesis. In conclusion, knowledge of the sets of genes associated specifically with the nature of the injury may have application for development of new strategies for acceleration of the recovery process in injured skeletal muscle.
Common acute injuries to skeletal muscle can lead to significant pain and disability (Kirkendall & Garrett, 2002). Traumatic muscle injuries including crush, contusion, laceration or freezing occur relatively infrequently but when they do occur, can have dramatic and prolonged effects on muscle functional capacity (Kirkendall & Garrett, 2002). On the other hand, contraction-induced muscle injuries resulting from demanding muscular work or exercise occur more often. While they are not as clinically severe as the traumatic injuries, the functional recovery of the muscle is also protracted (Lieber et al. 2002; Warren et al. 2002b). The healing phases for an injured muscle, including degeneration, inflammation, regeneration and remodelling, are considered to be common among the injury types (Huard et al. 2002; Jarvinen et al. 2005), even though the initiating mechanism of damage most probably differs in the two types of injury (Warren et al. 2001, 2002b). Furthermore, the current therapeutic approaches for treating muscle injuries are dependent not on the type but on the clinical severity of injury (Jarvinen et al. 2005). Often, the injured muscle heals slowly and improperly regardless of treatment, leading to an incomplete functional recovery, a tendency for recurrent injuries and/or scar tissue formation (Huard et al. 2002).
There is great interest in exploring the molecular mechanisms of skeletal muscle injury using microarray studies in experimental animal models. Recent gene expression studies on mouse models of skeletal muscle injury, including cardiotoxin injection-induced injury, freeze injury and eccentric contraction injury, resulted in identification of genes that may have an important role in muscle repair (Zhao et al. 2002; Summan et al. 2003; Yan et al. 2003; Barash et al. 2004). However, we are aware of no study that has compared two types of skeletal muscle injury side by side. We hypothesized that such a comparison would bring to light the similarities as well as the dissimilarities between different types of injury in gene expression occurring during degeneration and repair phases. Knowledge of the dissimilar gene expression will contribute to the identification of specific biological mechanisms and could justify the need for development of injury-specific therapeutic regimens. In this study, we used two well-characterized mouse models of skeletal muscle injury, eccentric contraction-induced injury (CI) and traumatic injury induced by freezing (FI) for 10 s. FI mimics an injury induced by frostbite and, furthermore, has been found to elicit a sequence of degeneration and regeneration events similar to those in other traumatic models such as crushing (Pavlath et al. 1998). Histopathological evaluation and measurements of muscle strength following CI and FI were accompanied by analyses of gene expression using the Affymetrix methodology at four time points ranging from 6 h to 7 days after injury. The time course was selected to capture the initial response (6 h and 1 day) including early inflammatory and degenerative events, the peak inflammation and degeneration response (3 days) and primarily structural and functional muscle recovery (7 days) for both models of injury. Selected temporal patterns of gene expression were also examined by real-time reverse transcriptase-polymerase chain reaction (RT-PCR). To evaluate whether some differences observed in gene expression between the two types of injury depend on the degree of the injury instead of the type of injury, some transcripts were evaluated by real-time RT-PCR after FI was induced over a relatively short time period (i.e. 1 s) compared to the normal duration (i.e. 10 s).
Methods
Animals
C57BL/6J mice were obtained from the Jackson Laboratory (Bar Harbour, ME, USA). All mice were aged between 2 and 3 months. The mice were given irradiated feed (Teklad LM-485) and tap water ad libitum and were housed in ventilated cages on autoclaved hardwood chip bedding. Sentinel mice were free of endogenous pathogens. Animal room conditions included High Efficiency Particulate Air (HEPA)-filtered air, controlled temperature and humidity, and a 12 h light–dark cycle. In experiments not involving chronic muscle strength assessments, mice were anaesthetized with 0.33 mg kg−1 fentanyl, 16.7 mg kg−1 droperidol and 5.0 mg kg−1 diazepam administered intraperitoneally in preparation for muscle injury induction. Supplemental doses (0.04 mg kg−1 fentanyl and 2.0 mg kg−1 droperidol) were given as needed. Adequacy of the level of anaesthesia was assessed by absence of both pedal and blink reflexes. In experiments with chronic muscle strength assessments, mice were induced and maintained on isoflurane inhalation anaesthesia during the stimulating nerve cuff implantation, injury induction and strength testing procedures. Following recovery from the nerve cuff implantation surgery, mice were given a long-acting analgesic (buprenorphine, 0.05 mg kg−1 subcutaneously). The mice were killed 6 h or 1, 3, 7 or 14 days after injury in the histological studies, 6 h, or 1, 3 or 7 days after injury in the gene expression studies and 28 days after injury in the muscle strength measurement studies. Animal care and use procedures, including death by CO2 asphyxiation, were conducted in accordance with the Public Health Service (PHS) Policy on Humane Care and Use of Laboratory Animals and the Guide for the Care and Use of Laboratory Animals (NIH publication 86–23, 1996); these procedures were approved by the National Institute for Occupational Safety and Health (NIOSH) and Georgia State University institutional animal care and use committees.
Induction of freeze-induced muscle injury (FI)
The procedure employed was identical to that previously described by us (Warren et al. 2002b, 2004). In brief, a 1.5 cm long incision was made through aseptically prepared skin overlying the left tibialis anterior (TA) muscle belly. Injury was induced by applying a steel probe cooled to the temperature of dry ice to the TA muscle belly for 10 s. In one set of experiments to compare minimal and severe destructive tissue damage, the probe was applied for either 1 or 10 s. After freezing the muscle, the skin incision was closed using silk suture.
Induction of eccentric contraction-induced muscle injury (CI)
The left anterior crural muscles (to include the TA muscle) were injured using the miniature isokinetic dynamometer as we have previously described (Lowe et al. 1995; Warren et al. 1999). Except in mice previously implanted with a stimulating nerve cuff (see section below), two percutaneous needle electrodes were inserted adjacent to the common peroneal nerve as it passes over the lateral gastrocnemius muscle. Using 200 ms trains of 0.1 ms pulses at 300 Hz, stimulation voltage was adjusted to yield the maximal isometric tetanic torque of the anterior crural muscles. Next, an injury-inducing protocol of 150 eccentric contractions was conducted as we have previously described (Lowe et al. 1995; Warren et al. 1999). Eccentric contractions of the anterior crural muscles were conducted by moving the foot from 20 deg of dorsiflexion to 20 deg of plantarflexion at 2000 deg s−1. A 100 ms isometric stimulation immediately preceded the plantarflexion movement, thus total stimulus duration for the contraction was 120 ms. Contractions were performed at 12 s intervals, thus the protocol was ∼30 min long.
Measurement of in vivo muscle strength
For assessing the recovery of strength following injury, anaesthetized mice were implanted with a chronic stimulating nerve cuff placed on the left common peroneal nerve as we have previously described (Warren et al. 1998). Briefly, the nerve cuff was constructed from two Teflon-coated, multi-stranded 90% platinum–10% iridium wires (0.15 mm diameter). An incision was made through the biceps femoris muscle and the two loops, formed from 2.5 mm segments of de-insulated platinum–iridium wire, were placed around the common peroneal nerve. The proximal end of the nerve cuff was externalized in the dorsal cervical region where it could be connected to a stimulator. Mice implanted with nerve cuffs were allowed 4–6 weeks to recover before being used in the experiments. Isometric tetanic torque of the left anterior crural muscles was measured using a miniature dynamometer as we have previously described (Warren et al. 1998). Using 200 ms trains of 0.1 ms pulses at 300 Hz, stimulation voltage was adjusted to yield the maximal isometric tetanic torque of the anterior crural muscles. The TA muscle contributes 89% of the torque production in the uninjured condition (Warren et al. 2002a). Muscle strength was measured immediately before and after injury and at 3, 7, 14, 21 and 28 days after injury. Strength differences between the two groups of mice were analysed using the two-way (group × time) repeated measures ANOVA. When significant interactions were found, single degree-of-freedom contrasts were applied as post hoc tests. All statistical testing was conducted using SPSS (version 10.0). An α level of 0.05 was used for all analyses. Values presented in the Results are means ±s.e.m.
Histopathology
All histopathological evaluations were conducted on three mice at each time point for both the CI and the 10 s FI (total n= 24 mice). Muscles were embedded in Tissue Tek OCT (Miles Scientific, Elkart, IN, USA), frozen in melting isopentane and stored at –80°C. Using a microtome cryostat at –20°C, 10 cross-sections (10 μm thick) were cut at each of six levels equally spaced along the length of the TA muscle. Sections at each level were stained using routine haematoxylin and eosin (H & E) staining.
Gene expression analysis
TA muscles were homogenized in TRIzol (Invitrogen, Carlsbad, CA, USA) using a Polytron homogenizer (Brinkmann Instruments, Inc., Westbury, NY, USA) followed by purification with an RNeasy Mini Kit (Qiagen, Valencia, CA, USA). Total RNA was resuspended in 12 μl molecular biology grade water (Cambrex Bioscience Rockland Inc., Rockland, ME, USA), and concentration and purity were assessed by spectrophotometry. Only samples with a ratio of spectrophotometric absorbance at 260 nm to that at 280 nm (A260/A280) in the range of 1.9–2.1 were used in microarray hybridizations.
Microarray analysis was performed in triplicate using the Murine Genome MGU74Av2 high-density oligonucleotide microarrays (Affymetrix, Santa Clara, CA, USA). The protocol used was from the Affymetrix Expression Analysis technical manual (Eukaryotic Sample and Array Processing, 701024 Rev. 2). Briefly, double-stranded cDNA was synthesized from 12 μg total RNA (Superscript Double Stranded cDNA Synthesis Kit, Invitrogen, Carlsbad, CA, USA). Clean up of the double-stranded cDNA was carried out using phase-lock gels (Brinkmann Instruments, Inc.) according to the Affymetrix Expression Analysis technical manual. An in vitro transcription (IVT) reaction (Enzo, Farmingdale, NY, USA) was performed using 5 μl cDNA to produce biotin-labelled cRNA. Excess biotinylated dUTPs were removed by RNeasy Mini Kit before the biotin-labelled cRNA was fragmented and added to a hybridization cocktail including Eukaryotic Hybridization controls (Affymetrix), bovine serum albumin (Gibco, Grand Island, NY, USA) and herring sperm DNA (Promega, Madison, WI, USA). Hybridization on microarrays was performed for 16 h at 45°C in the Gene Chip Hybridization Oven with rocker (Affymetrix). Microarrays were washed and stained using the protocol as described in the Affymetrix manual with the GeneChip Fluidics Station 400 (Affymetrix). Arrays were then scanned with the Affymetrix Scanner (Hewlett Packard, Palo Alto, CA, USA). Three sets of samples per combination of injury type and time after injury were used in these analyses. Each sample represented a pool of TA muscles from two mice. The samples from each time point of FI and CI were compared to three sets of control TA muscle samples (from uninjured mice). In total, 56 mice were used for this experiment. The microarray data presented in this publication have been deposited in NCBI's Gene Expression Omnibus (GEO, http://www.ncbi.nlm.nih.gov/geo/) and are accessible through GEO Series accession number GSE5413.
Using SAS Microarray Solution (SAS-MAS, 2003), a list of differentially expressed genes was determined with two interconnected mixed analysis of variance (ANOVA) models, the ‘normalization’ model and the ‘gene’ model. To fit the normalization model, we used the method of restricted maximum likelihood (REML) on the log base-2 background-corrected fluorescence measurements. The residuals from this model represent normalized values, and are the input data for the gene model. The gene model is fitted separately for each gene, allowing inferences to be made using separate estimates of variability. In both the normalization and gene mixed ANOVA models, a statistical distinction between fixed and random effects was incorporated. Fixed effects are defined as a specific set of treatments that have no constraints imposed on them. Random effects, in contrast, are defined as those factors that have been chosen from a larger population of effects with a probability distribution. These models, which include both fixed and random effects, are known as mixed models. An α level of 0.000001 was used for post hoc pairwise comparisons (i.e. injured versus uninjured control), representing a Bonferroni correction for the number of time points investigated (i.e. four) and the number of genes on the microarray (i.e. 12 488).
Functional categorization of differentially expressed genes
Using Onto-Express (version 2) on-line software (Khatri et al. 2002), we performed an analysis to identify the main biological functions associated with the differentially expressed genes that were up- or down-regulated by at least 2-fold. Onto-Express constructs a functional profile for each of the Gene Ontology categories (Ashburner et al. 2000), including molecular function, biological process and cellular component. For each category, Onto-Express calculated the statistical probability using a hypergeometric function that the category contains more (or less) differentially expressed genes than would be expected from a random up- or down-regulation of genes on the Affymetrix U74 AV2 chip; this information shows whether there is a disproportionately greater or lesser expression of genes in one category compared to another. These probabilities were corrected for multiple comparisons using a false discovery rate correction (Benjamini & Hochberg, 1995). These analyses were restricted to gene categories containing at least 5% of the total number of differentially expressed genes for a type of injury at a given time point.
Cluster analysis of gene expression profiles
Clustering of genes into groups on the basis of differing temporal expression patterns was done using the k-means clustering technique (Cluster; available at http://rana.lbl.gov/index.htm). These analyses were run only on genes that exhibited a statistically significant up- or down-regulation by ≥ 2-fold and the analyses were run separately for the two types of injury. Because the number of clusters is determined a priori in the k-means clustering technique, the v-fold cross-validation technique was used to help determine the optimum number of clusters. Heat maps of the clusters were generated using Heatmap Builder software (available at http://quertermous.stanford.edu/heatmap.htm).
Real-time RT-PCR
Real-time RT-PCR was conducted as we have previously described (Summan et al. 2006). Briefly, amplification reactions were performed with 1X SYBR Green PCR mastermix (PE Applied Biosystems, Foster City, CA, USA), 1 μm primers and 4 μl cDNA in a 50 μl final volume. Amplification reactions were carried out in an ABI Prism 7700 spectrofluorometric thermal cycler (PE Applied Biosystems) according to the manufacturer's instructions (10 min at 95°C followed by 40 cycles of 15 s at 95°C and 1 min at 60°C) with custom-designed primers (Invitrogen) (the primers are listed as a file ‘Primers’ in the Supplemental material). Differences in mRNA transcript levels between the two groups of mice were analysed using unpaired t tests or Mann–Whitney U tests when assumptions of normality or equal variance were violated; Bonferroni adjustments were applied to control for Type I error inflation due to the multiple comparisons.
Results
Histological evaluation, inflammation semiquantification and functional characterization of muscle after FI and CI
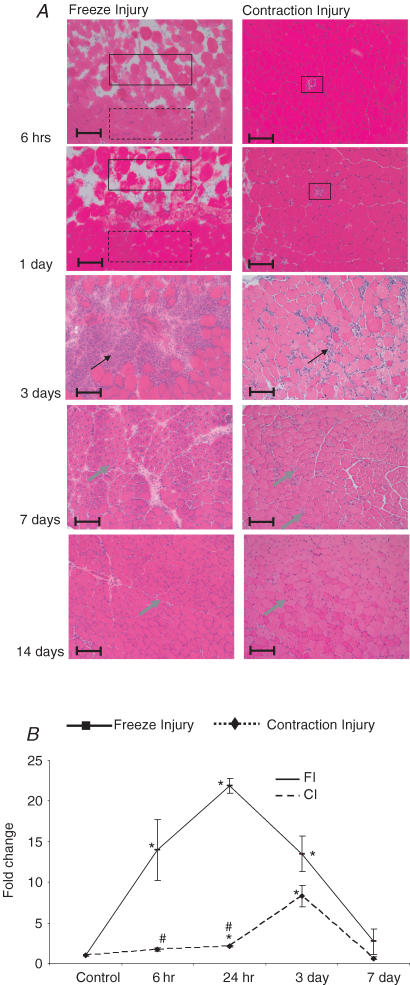
H & E staining indicated that after a 10 s FI, ∼60% of the TA muscle volume was affected. Directly beneath where the steel probe had been applied, ∼75% of the muscle cross-section appeared damaged. Compared to fibres in the uninjured region, fibres in the damaged FI region had lost their normal polygonal shape (Fig. 1; 6 h and 1 day, FI). Oedema, as demonstrated by a widening of the interstitial space between fibres, was also evident in the FI muscle. There was a modest influx of inflammatory cells, mainly mononuclear cells, over the first day after injury that was restricted to the damaged region adjacent to the deep uninjured region. By 3 days after injury, the level of inflammatory cell infiltration into the damaged muscle region had peaked (Fig. 1; 3 days, FI). At 7 days after injury, the inflammatory cells had progressed to more peripheral portions of the damaged muscle and their numbers were reduced (Fig. 1). The appearance of regenerating muscle fibres, as identified by centronucleation, tracked the peripheral movement of the inflammatory cells. Two weeks after injury, no signs of previous damage were detected in the freeze-injured TA muscle except for regenerating fibres with centrally located nuclei and smaller cross-sectional areas.
Figure 1. Characterization of mouse tibialis anterior (TA) muscle after freeze (FI) and contraction (CI) injuries.
A, haematoxylin and eosin staining was conducted on frozen transverse sections of TA muscles at 6 h and 1, 3, 7 and 14 days after injury. Images are representative of those obtained on muscles from three mice from each injury type at a given time point. Scale bars, 100 μm. The black arrows identify inflammatory cells whereas the grey arrows identify regenerating myofibres. The solid line rectangles identify examples of damage area whereas the dotted line rectangles identify normal muscle histopathology. B, Mac-1 gene expression, a marker of inflammation, in TA muscle. Expression was normalized to 18S/rRNA from the same samples and presented as the fold-increase above control (uninjured muscle). Values represent mean ±s.e.m. (n= 3). *Significantly different expression in injured muscle compared to the control muscle (P < 0.05); #significantly different expression in CI compared to the FI (P < 0.05).
In the first day after CI, there were only sparsely distributed single fibres that exhibited damage as well as a slight widening of the interstitial spaces (Fig. 1; 6 h and 1 day, CI). Only 5–10% of the muscle fibres exhibited signs of damage and these fibres were distributed throughout the muscle cross-section. By 3 days after injury, the injured muscle was invaded by inflammatory cells, which were localized to the interstitial spaces around damaged muscle fibres. As after FI, the level of infiltrating inflammatory cells peaked in muscle after CI at ∼3 days; the level declined slowly over the next week with no inflammatory cells found in the injured muscles at 14 days. The peak number of inflammatory cells observed in the CI muscle was markedly less than that observed in FI muscle. Centronucleated, regenerating fibres also began to appear throughout the injured muscle in the 3–7 day post-injury period and were co-localized with the distribution of inflammatory cells. At 14 days after injury, as in the FI model, the only sign of prior damage was revealed by centronucleated fibres spread throughout the injured muscle but in relatively low number. Overall, the repair process in both types of injury was characterized by similar cell responses when observed at the light microscopic level, but the extent and distribution of the repair events (i.e. inflammatory cell influx and fibre regeneration) were different.
For a semiquantitative analysis of the inflammatory response in injured muscle, we used real-time PCR evaluation of Mac-1, a marker of leucocytes (Ralph et al. 1983). Mac-1 mRNA expression is an early and precise marker of muscle inflammation (Warren et al. 2005; Summan et al. 2006). Consistent with histological characterization of the inflammatory response, Mac-1 mRNA was increased by both types of injuries but the expression was significantly higher in FI than in CI (Fig. 1B).
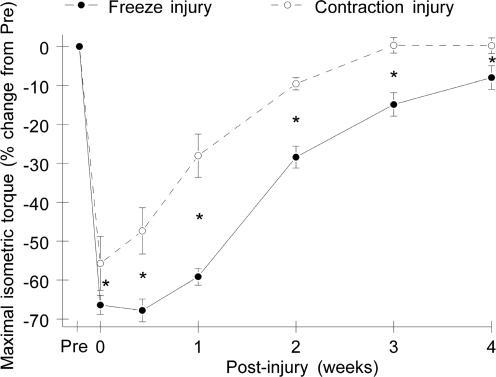
In contrast to the marked difference between FI and CI in the degree of histopathological as well as Mac-1 expression changes, the maximal loss of isometric strength immediately after injury was only slightly greater for FI than for CI (FI, 66 ± 2.5%; CI, 56 ± 6.9%) (Fig. 2). Significant recovery of muscle strength was evident at 3 days after CI and at 7 days after FI. By 14 days, there was only a minimal strength deficit remaining for CI muscle (i.e. 8%), whereas FI muscle did not exhibit a comparable level of recovery until 28 days after injury. Though there was a delay in the recovery of strength for the FI muscle, the rates of recovery were comparable for the two types of injury after the 7th day post injury.
Figure 2. Recovery of muscle function after freeze (FI) and contraction (CI) injuries of mouse muscle.
Maximal isometric tetanic torque of the left anterior crural muscles was measured immediately before and after injury and at 3, 7, 14, 21 and 28 days after injury. There were significant main effects for injury type and time (P < 0.05) but no significant injury type–time interaction (n= 6 mice for CI and n= 10 mice for FI). *Significant difference between injury types at a given time point.
Gene expression analysis
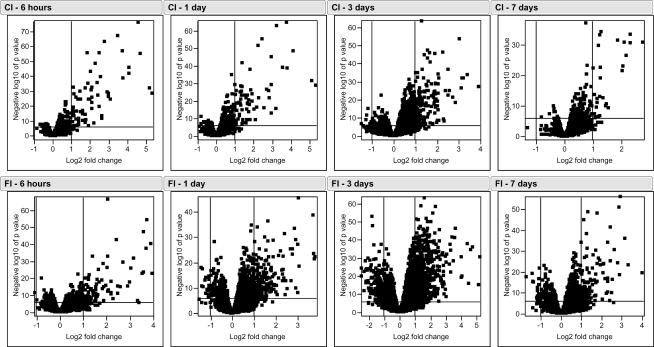
The volcano plots of the DNA microarray data indicate that there was a greater number of differentially expressed genes in the FI muscles compared to the CI muscles (Fig. 3). However, there were more genes with very high levels of expression in the CI model at the early time points after injury (6 h and 1 day) compared to the FI model, but the situation was reversed at the later time points (3 and 7 days). Relative to the control muscle, the numbers of significantly differentially expressed genes at one or more time points were 1015 (8% of the total number of genes) and 2888 (23%) in CI and FI, respectively. The maximum number of differentially expressed genes occurred at 3 days after injury in both types of injury.
Figure 3. Volcano plots of the statistical significance (−log10 of P value) for gene expression as a function of the average expression ratio (mean expression in injured muscle versus that in uninjured control muscle).
The horizontal axis is a log2 scale, thus the vertical lines at +1 and –1 represent 2-fold gene up- and down-regulation, respectively. The horizontal line represents a P value of 0.000001; genes lying above this line in the graphs are considered to be differentially expressed. The upper and lower panels represent the time course for gene expression following contraction (CI) and freeze (FI) injuries, respectively.
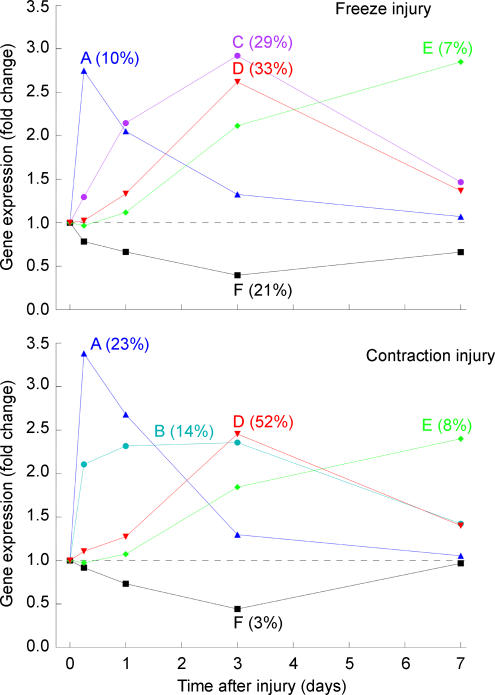
Cluster analysis was used to organize the injury-induced genes (significantly up- or down-regulated by ≥ 2-fold) into groups by similarly shaped temporal profiles (Fig. 4). Five clusters were identified as optimal for each type of injury. These include clusters A (genes with an immediate induction peaking at 6 h in both injuries), B (genes associated only with CI that exhibited a rapid and persistent induction from 6 h until 3 days), C (genes associated only with FI that exhibited a persistent induction rate with a peak at 3 days), D (genes with an intermediate induction with a peak at 3 days), E (genes with a late induction and peaking at 7 days) and F (down-regulated genes). Consistent with the severe tissue destruction associated with FI, the immediate-induction cluster (A) contained only 10% of the FI-modulated genes whereas this cluster represented 23% of the CI-modulated genes. Furthermore, the down-regulated genes (cluster F) represented 21% of the FI-modulated genes but only 3% of the CI-modulated genes.
Figure 4. Temporal expression profile graphs for the freeze (FI) and contraction (CI) injury gene clusters.
Each line represents the median level of gene expression (ratio of injured/uninjured TA muscle) for a given cluster as a function of time after injury. The gene expression clusters common to both types of injury include: clusters A (genes with an immediate induction peaking at 6 h in both injuries), B (genes associated only with CI that exhibited a rapid and persistent induction from 6 h until 3 days), C (genes associated only with FI that exhibited a persistent induction rate with a peak at 3 days), D (genes with a intermediate induction with a peak at 3 days), E (genes with a late induction and peaking at 7 days) and F (down-regulated genes). A percentage listed in parentheses indicates the percentage of differentially expressed (≥ 2-fold) genes for an injury type that falls in the cluster.
As determined using Onto-Express, the characterization of general molecular function of the gene clusters demonstrated some differences between the CI and FI models (Table 1). For example, significant increases in the genes coding for proteins associated with heat shock protein (Hsp) activities, related chaperone activities and heparin-binding activities were found in the immediate-induction gene cluster (A) of CI whereas this cluster in FI was characterized by significant increases in genes coding for inflammatory mediators (cytokines). Furthermore, the late-induction cluster (E) in CI was characterized by differentially expressed genes coding for structural proteins of the cytoskeleton as well as proteins with actin- and calcium-binding activities. In addition to these molecular functional categories, cluster E in FI also contained genes coding for proteins of the extracellular matrix, heparin-binding activities and structural molecular activities.
Table 1.
Molecular function categories for groups with different temporal patterns of gene expression
| Group | Contraction injury | Freeze injury |
|---|---|---|
| A | Heat shock protein activity (17%) | DNA binding (13%) |
| Chaperone activity (13%) | Protein binding (11%) | |
| Protein binding (13%) | Cytokine activity (7%) | |
| Heparin binding (8%) | ATP binding (6%) | |
| ATP binding (8%) | Kinase activity (6%) | |
| DNA binding (8%) | ||
| B | Protein binding (19%) | |
| DNA binding (13%) | ||
| ATP binding (6%) | ||
| GTP binding (6%) | ||
| Heat shock protein activity (6%) | ||
| RNA polymerase II transcriptionfactor activity (6%) | ||
| Structural molecule activity (6%) | ||
| Transferase activity (6%) | ||
| C | Protein binding (12%) | |
| Hydrolase activity (5%) | ||
| D | Protein binding (8%) | Hydrolase activity (9%) |
| Calcium ion binding (7%) | Protein binding (9%) | |
| GTP binding (7%) | ATP binding (8%) | |
| Hydrolase activity (7%) | DNA binding (6%) | |
| Structural constituent of cytoskeleton (6%) | Receptor activity (6%) | |
| Structural molecule activity (6%) | ||
| E | Structural constituent of cytoskeleton (16%) | Extracellular matrix structural constituent |
| conferring tensile strength (18%) | ||
| Actin binding (11%) | Extracellular matrix structural constituent (16%) | |
| Calcium ion binding (11%) | Protein binding (13%) | |
| Protein binding (11%) | Structural constituent of cytoskeleton (9%) | |
| Receptor activity (11%) | Calcium ion binding (7%) | |
| Heparin binding (7%) | ||
| Actin binding (5%) | ||
| Structural molecule activity (5%) | ||
| F | Oxidoreductase activity (29%) | Oxidoreductase activity (12%) |
| Transferase activity (10%) | ||
| Catalytic activity (8%) | ||
| Hydrolase activity (8%) | ||
| ATP binding (6%) | ||
| Kinase activity (6%) | ||
| Calcium ion binding (5%) | ||
| Protein binding (5%) |
For a given category, the percentage in parentheses reflects the number of genes in that category as percentage of the total number of differentially expressed genes for that group that were altered ≥ 2-fold. A category is listed only if the percentage was ≥ 5%. Bolded categories contain more differentially expressed genes than would be expected from a random up- or down-regulation of genes on the Affymetrix U74 AV2 chip.
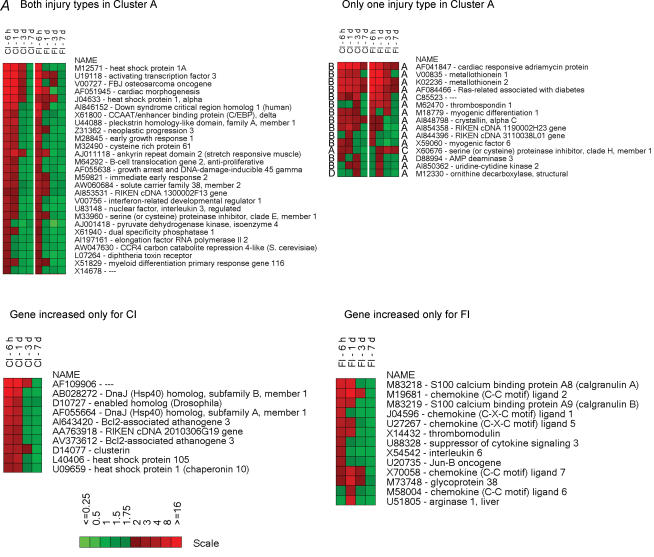
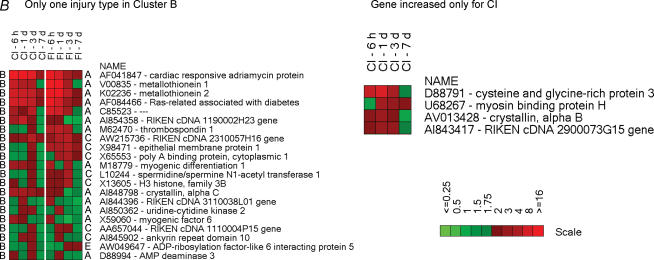
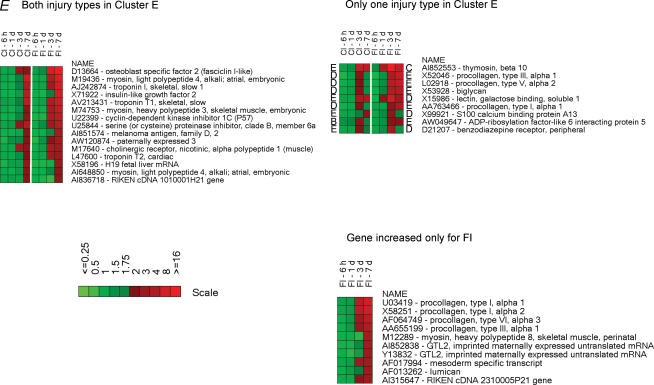
The injury-induced genes in each cluster were organized into heat maps (Fig. 5), which represent the temporal profiles for the fold-changes in mRNA expression relative to uninjured (control) muscle. In the immediate-induction gene cluster (Fig. 5, cluster A), there are genes common to both injuries. This group of genes is dominated by transcription factors, translation regulators and growth factor-related proteins including ATF-3, c-fos, Egr-1, C/EBP delta, pleckstrin homology-like domain (TDAG51) (which mediates insulin growth factor (IGF) survival effects), neoplastic progression 3, GADD45, solute carrier family 38 (SNAY2, a transporter of amino acids), cysteine rich protein 61 (insulin growth factor binding protein, IGFBP), and B cell translocation gene 2 (nerve growth factor, NGF-inducible antiproliferation protein). Several stress-responsive genes are also expressed in both injuries. These genes include heat shock protein 1A (Hsp68), heat shock protein 1 α (Hsp90), cardiac morphogenesis (XIN) and ankyrin repeat domain 2 (MARP2). Several FI-induced genes in cluster A were induced by CI but were characterized by steady expression from 6 h until 3 days after injury and were clustered differentially (i.e. in cluster B). This group includes stress-related proteins such as cardiac responsive adriamycin protein (MARP1), metallothionein 1, metallothionein 2, Ras-related associated with diabetes (Rad1), crystallin α C (Hsp22), serine proteinase inhibitor clade H (Hsp47) and myogenic transcription factors such as myogenic differentiation 1 (MyoD) and myogenic factor 6 (MRF4). From the immediate-induction cluster genes (cluster A) common to both injuries, only those coding for metallothionein and Rad1 were characterized by higher levels of expression in FI compared to CI. Several genes in cluster A were expressed only in muscle damaged by CI; that is, those coding for DnaJ (Hsp40), Bcl2-associated athanogene, clusterin and heat shock proteins 105 and 1 (chaperonin 10). Cluster A genes found exclusively in FI were associated with inflammatory processes including genes coding for S100A8 (calgranulin A), S100A9 (calgranulin B), chemokines of the C-X-C or C-C family, glycoprotein 38 and thrombomodulin. Likewise, cluster B genes (those with a persistent induction over the 6 h to 3 days post-injury period) expressed exclusively in CI included cysteine and glycine-rich protein 3 (LIM, MLP), myosin binding protein H, αβ-crystallin and AI843417 RIKEN cDNA (Fig. 5).
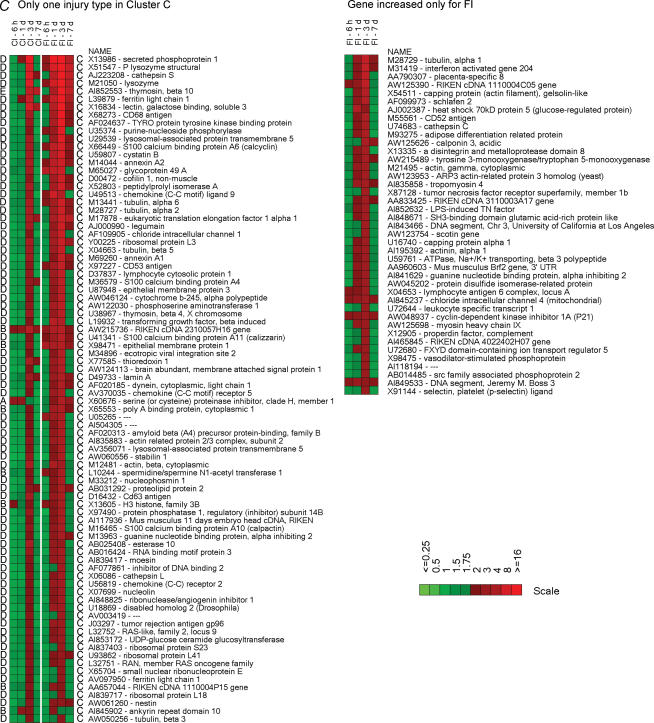
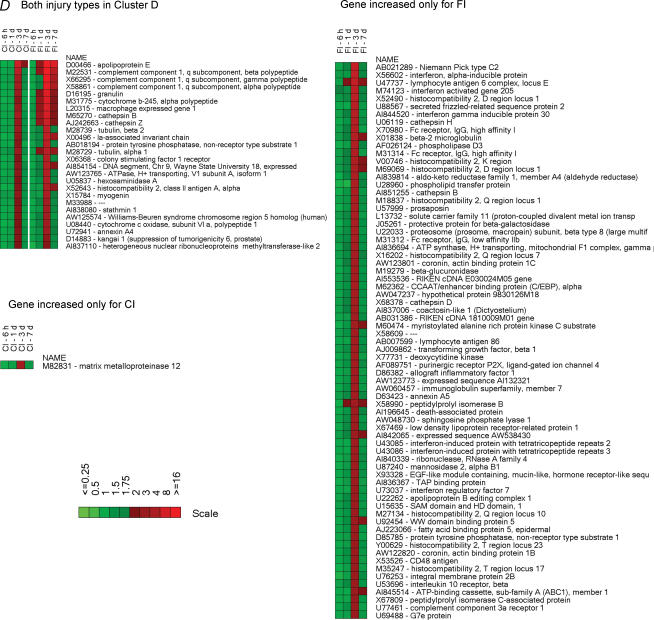
Figure 5. Heatmaps illustrating the temporal expression of individual genes in the six clusters.
Higher levels of expression are indicated by progressively brighter shades of red and reduced expression levels by increasingly brighter shades of green. The scale bars indicate the fold-change of gene expression (ratio of injured/uninjured TA muscle). Gene accession numbers and names are shown to the right of the maps. The heat maps for a given cluster are organized as follows: (1) differentially expressed (≥ 2-fold) genes in the same cluster for both types of injury, (2) differentially expressed (≥ 2-fold) genes in a given cluster for one type of injury but found in another cluster for the other type of injury and (3) genes that are differentially expressed (≥ 3-fold) by only one type of injury. The uppercase letters to the left and right of the heatmaps indicate the cluster to which the gene belongs; the left-hand and right-hand letters are for CI and FI, respectively.
FI induced many genes that exhibited a peak induction at 3 days (cluster C). Many of these genes code mainly for markers or products of activated monocytes and macrophages (e.g. secreted phosphoprotein 1 (osteopontin), P lysozyme, ferritin light chain 1 and CD68), structural remodelling proteins (e.g. S100A10, S100A11, annexin A1, annexin A2 and legumain), microtubular proteins (e.g. tubulins and dynein), translation regulators (e.g. eTEF-1, ribosomal protein l3 and poly A binding protein), inhibitors of the inflammatory response (e.g. thymosin, thioredoxin and LIR-5) and structural-related proteins (e.g. laminin A and nestin) (cluster C). Some of these genes were activated by CI but with a more transient, and lesser degree of, expression (cluster D). Others were not induced by CI. This set included genes whose products were mainly associated with transcription repressor function (e.g. interferon activated gene 204 and cyclin-dependent kinase inhibitor 1 A (p21)), inflammation inhibitory function (e.g. heat shock 70 kDa protein 5 and SH3-binding domain-thioredoxin-like protein) and muscle and non-muscle actin binding function (e.g. capping protein gelsolin-like, capping protein 1 α, actinin α 1, calponin 3 and tropomyosin 4). The chloride intracellular channel 4 gene, CLIC4 (AI845337 and AI849533) was highly induced at all time points after FI but was not induced after CI. Additionally, cluster D contained genes related to inflammatory responses; for example, genes coding for members of the complement component 1 q subcomponent family, granulin, macrophage-expressed gene 1 and cathepsins. These genes had a higher and more prolonged expression in the FI muscle tissue. Also in cluster D, the muscle fibre development/regeneration-related gene, myogenin, was expressed at similar levels in both types of injury. There were numerous genes in cluster D found exclusively in FI. These genes were mostly linked to regulation of the inflammatory response, such as interferon-activated genes and members of the cathepsin family.
The cluster of genes with a late induction response profile (cluster E, Fig. 5) was characterized by genes coding for developmental forms of muscle-specific structural proteins (myosin light polypeptide 4 and myosin heavy polypeptide 3), inhibitors of cell proliferation and regulators of cell differentiation (cyclin-dependent kinase inhibitor and serine proteinase inhibitor). Additionally, cluster E included many genes coding for extracellular matrix proteins (different forms of procollagens) which were induced by FI but were only transiently induced (cluster D) or not induced at all by CI.
The genes down-regulated by muscle injury (cluster F, not shown) exhibited maximum suppression at 3 days after injury. Both CI and FI induced suppression of genes coding for enzymes involved in muscle energy metabolism (phosphoglucomutase, isocitrate dehydrogenase and glycerol-3-phosphate dehydrogenase). Additional genes related to muscle energy metabolism (e.g. muscle glycogen phosphorylase, creatine kinase and adenylate kinase) and genes coding for muscle contraction-related proteins (e.g. LIM domain binding 3, ryanodine receptor 1, calsequestrin 1, actinin α3, myozenin 1, troponin T3 and myomesin) were suppressed by FI but not by CI. However, the suppressed genes, specifically in the FI model, may reflect destruction of the tissue rather than specific gene down-regulation.
Real-time RT-PCR gene expression analysis
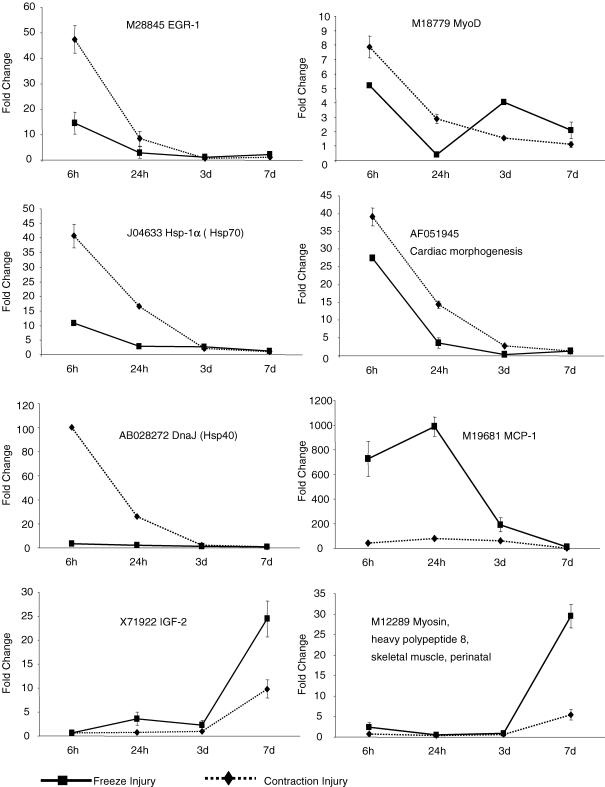
The time course of expression for selected genes, representing different clusters from the microrray data, was analyzed by real-rime RT-PCR (Fig. 6). The RT-PCR analyses confirmed that DnaJ (Hsp40) was induced by CI but not by FI whereas the chemokine (C-C motif) ligand 2 (MCP-1) was highly induced by FI and minimally by CI. Also consistent with the Affymetrix results were the temporal expressions of transcription factors such as EGR-1 and MyoD, which were induced by both types of injuries but with higher expression in the first hours after CI compared to FI; a similar trend was confirmed for the transcripts coding for the Hsp-1A (Hsp70) and cardiac morphogenesis proteins. The transcripts expressed late after injury such those coding for IGF-2 and myosin heavy polypeptide were induced by both injuries but with higher expression in FI. Overall, the expression profiles obtained by RT-PCR agreed with the Affymetrix microarray results.
Figure 6. RT-PCR validation of expression of genes representing different clusters from the microarray data.
Real-time RT-PCR was performed to determine the expression of selected genes in freeze (FI) and contraction (CI) injury models. The expression was normalized to 18S/rRNA from the same sample and presented as a fold-increase above the control muscle level (n= 4 mice per combination of injury type and time after injury).
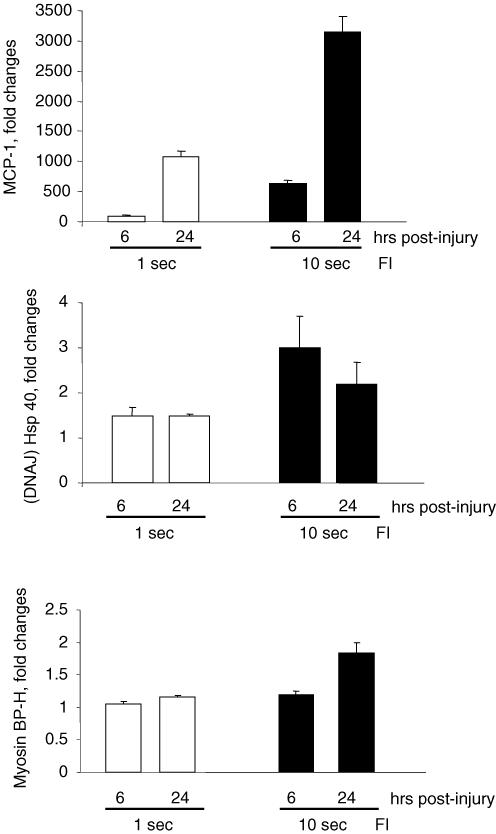
The expression of transcripts encoding for inducible heat shock factors, such as DnaJ, as well as myosin binding protein H (MBP-H) was not triggered by FI. To evaluate whether this lack of induction depended on the type of injury or instead on the degree of the injury, these transcripts were evaluated by real-time RT-PCR in TA muscle after FI induced by application of the dry-ice cold probe for either 1 or 10 s. Compared to the longer 10 s FI, the 1 s FI resulted in a significantly lower transcript expression of the inflammatory mediator MCP-1, corresponding to a lesser degree of muscle damage. The shorter duration FI did not, however, result in greater expression of DnaJ or MBP-H (Fig. 7).
Figure 7. RT-PCR analysis of MCP-1, DNAJ (Hsp40) and myosin binding protein H gene expression in freeze injury (FI) with different degrees of muscle damage (i.e. 1 s versus 10 s duration of freezing).
Injured and uninjured (control) TA muscles were obtained from mice at the times indicated and analysed for mRNA transcripts using real-time RT-PCR. Expression was normalized to 18S/rRNA from the same samples and presented as the fold-increase above the control muscle level. *Significantly different expression (n= 4 mice per combination of freezing duration and time after injury, P < 0.05; total n= 24 mice).
Discussion
The two types of injuries, one induced by direct destruction of muscle tissue (i.e. FI) and the other induced by a contractile overload (i.e. CI) triggered common histopathological features including fibre degeneration, oedema, inflammatory cell influx and regeneration, but the extent and distribution of these events were different (i.e. more pronounced in FI). Similarly, the strength loss was slightly greater and exhibited a slower recovery after FI. However, the side-by-side gene expression profiling of FI and CI revealed that the repair mechanisms in skeletal muscle include activation of common as well as injury type-specific gene sets. Both injuries cause early induction of transcription, myogenic and stress-responsive factors. Only CI activated a set of genes associated with the repair of impaired protein and structures including genes related to apoptosis, whereas FI uniquely activated gene sets involved in extensive inflammatory responses, tissue remodelling, angiogenesis and myofibre/extracellular matrix synthesis.
The events that are triggered to repair the muscular structure and function are considered to include fibre regeneration, a process requiring the participation of local muscle precursor cells commonly referred to as satellite cells (Carlson & Faulkner, 1983; Bodine-Fowler, 1994; Charge & Rudnicki, 2004). The recovery processes following traumatic (FI) and contraction-induced (CI) muscle injuries may not be identical. For example, satellite cell proliferation has been found to be necessary for only half of the functional recovery of the muscle in our well-characterized animal model of CI (Rathbone et al. 2003). This apparently lesser dependence on satellite cells following CI may be explained by observations that much of the loss of strength of the muscle is not due to irreversible muscle fibre damage (Ingalls et al. 1998; Warren et al. 2001). Furthermore, a mild stretch injury to muscle, which does not cause gross structural alterations such as myonecrosis, induces transient proliferation of satellite cells but without the occurrence of myoblast differentiation and fusion necessary to form myotubes and eventually myofibres (Aarimaa et al. 2004). Although the regeneration does not play the same role in destructive and contraction type of injuries, an early strong expression of transcription factors, including myogenic transcription factors associated with satellite cell activation, and common stress-responsive genes, including several muscle-specific genes such as Xin, MARP1 and MARP2, accompanied both injury types. Thus, injury to muscle may always be associated with a signal for satellite cell activation but whether or not regeneration processes follow and are completed may depend on the nature of the injury and the balance in the activated gene expression profiles.
Moreover, CI uniquely triggered early expression of a set of genes coding for proteins such as heat shock proteins/chaperones (Hsp40, Hsp105 and chaperonin 10) and the anti-apoptotic proteins (Bag3 and clusterin) which can repair modified muscle proteins and may play a significant role in functional restoration after CI. It has been demonstrated that Hsp104, Hsp70 and Hsp40 work cooperatively in order to provide a more powerful protein refolding machine for aggregated proteins (Glover & Lindquist, 1998). Consistent with our findings, it has been demonstrated that a brief episode of ischaemia (i.e. a reversible injury) in rat heart causes a strong up-regulation of genes coding for a similar set of heat shock proteins (Simkhovich et al. 2003). Furthermore, CI but not FI induced expression of αβ-crystallin, myosin binding protein H (MBPH) and LIM (MLP). The clustering of MBPH, known as a myosin stabilizer within the sarcomere (Welikson & Fischman, 2002), with MLP and αβ-crystallin may suggest that these mediators play a cooperative role in maintaining the myofibre integrity after CI. Our results demonstrate that even minimal myofibre destruction such as that resulting from a very brief (1 s) FI is not associated with induction of genes coding for MBPH and chaperones which are specifically activated only by CI. Thus, CI induced early expression of genes coding for proteins which can repair modified muscle proteins, restore myofibre integrity, and play a significant role in recovery of muscle function. Also, the activation of some of these markers may provide signals to the activated satellite cells that they are not required in the repair process.
In contrast to CI, FI with its obvious tissue destruction was associated with a unique and early induction of genes coding for mediators involved in attracting inflammatory cells into the damaged tissue. Chemokine transcripts, including those from the MCP family which regulate the influx of monocytes/macrophages, were strongly expressed by FI. In addition to their chemotactic effects on leucocytes, most chemokines have broader functions including ones influencing angiogenesis, collagen production and proliferation of haematopoietic precursor cells (Kunkel, 1999; Mantovani, 1999). Chemokines exert their effects through specific receptors that are differentially expressed among cell types; these receptors are even found on myoblasts in the recovery from FI (Warren et al. 2005). We recently demonstrated, using both genetic and immune manipulations, that MCP-1 and its receptor CCR2 play a role in the regeneration and recovery of function after traumatic muscle injury (Warren et al. 2004,2005). Clustered with the chemokine transcripts after FI were the transcripts of S100A8 and S100A9. These members of the S100 family of calcium-sensing proteins can form a molecular complex (Roth et al. 2003). The complex has been shown to promote microtubule polymerization and to facilitate transendothelial migration of phagocytes (Vogl et al. 2004). Similar to our demonstration that MCP-1 can directly affect myoblasts, probably by regulating their migration (P. Simeonova, unpublished results), it has been proposed that S100A8 and S100A9 may directly affect muscle cells, most probably by inducing cell death (Seeliger et al. 2003). Thus, the initial response to injuries of a destructive nature results in expression of mediators that facilitates the recruitment and activation of inflammatory cells and the phagocytosis of damaged muscle tissue. In addition to the above described S100 members, FI also induced expression of S100A4, S100A6, S100A10 and S100A11 as well as expression of their partner proteins, annexin A1 and annexin A2. Because of differing temporal expression patterns, these genes were clustered differently than S100A8 and S100A9. Consistently, it has been shown that these two groups of S100 proteins are involved in different biological functions. For example, the S100A11–annexin A1 complex may play a role in membrane fusion events (Rety et al. 2000). In myotubes, it has been reported that S100A11 is localized near the sarcolemma and a possible role in the regulation of membrane activities has also been suggested (Arcuri et al. 2002). In addition, it has recently been reported that S100A4 protein interacts with annexin A2, an endothelial plasminogen coreceptor, to play a role in angiogenesis (Semov et al. 2005). Although the roles for this group of mediators in muscle are not well understood, their strong modulation by FI with its tissue destruction implies involvement in muscle regeneration and remodelling processes.
The gene expression profile comparison of FI and CI also demonstrated that the destruction of muscle tissue triggers powerful yet tightly regulated molecular mechanisms. In addition to induction of inflammatory mediators, the expression of anti-inflammatory molecules such as thioredoxin, metallothionein 1/2 and thymosin, is increased. This balancing of pro-inflammatory mediators with anti-inflammatory ones can probably explain why muscle strength is not decreased further over the first 3 days of FI despite the large influx of inflammatory cells. Similarly, the transcription of proliferation and remodelling molecules are countered by expression of repressors such as p21 and CLIC4. CLIC4 is highly expressed in FI but not in CI. Although its role in muscle injury and/or repair is not known, it has been reported that in the brain, CLIC4 associates with the actin cytoskeleton in membrane ruffles and interacts with signalling molecules involved in membrane remodelling (Suginta et al. 2001). The repair mechanisms in FI, in contrast to those in CI, are associated with prolonged expression of contractile and extracellular matrix proteins. Disruption of the regeneration and repair mechanisms, including inflammation, following a destructive type of muscle injury, may lead easily to a fibrotic response rather than progression of the muscle to a complete restoration of its structure and function.
In summary, contraction and destructive types of injury trigger common molecular mechanisms most probably related to general response to stress and activation of regeneration. Furthermore, they initiate injury-specific mechanisms; for example, mechanisms associated with protein and structure integrity repair after contraction injury, or attraction of inflammatory cells, cleaning and rebuilding of the impaired muscle structures after destructive type of injury. These studies present portfolios of genes whose modulation may prove to be beneficial for acceleration of repair processes in injured skeletal muscle.
Acknowledgments
The authors would like to thank Dr Maureen Gwinn, NIOSH, for her help in conducting the DNA microarray analysis and Kurt Brumbaugh, NIOSH (current affiliation Minitab Inc., State College, PA, USA) for providing SAS microarray analysis of the Affymetric gene expression data.
Supplemental material
Online supplemental material for this paper can be accessed at:
http://jp.physoc.org/cgi/content/full/jphysiol.2007.132373/DC1 and http://www.blackwell-synergy.com/doi/suppl/10.1113/jphysiol.2007.132373
References
- Aarimaa V, Rantanen J, Best T, Schultz E, Corr D, Kalimo H. Mild eccentric stretch injury in skeletal muscle causes transient effects on tensile load and cell proliferation. Scand J Med Sci Sports. 2004;14:367–372. doi: 10.1111/j.1600-0838.2004.403.x. [DOI] [PubMed] [Google Scholar]
- Arcuri C, Giambanco I, Bianchi R, Donato R. Subcellular localization of S100A11 (S100C, calgizzarin) in developing and adult avian skeletal muscles. Biochim Biophys Acta. 2002;1600:84–94. doi: 10.1016/s1570-9639(02)00448-x. [DOI] [PubMed] [Google Scholar]
- Ashburner M, Ball CA, Blake JA, Botstein D, Butler H, Cherry JM, Davis AP, Dolinski K, Dwight SS, Eppig JT, Harris MA, Hill DP, Issel-Tarver L, Kasarskis A, Lewis S, Matese JC, Richardson JE, Ringwald M, Rubin GM, Sherlock G. Gene ontology: tool for the unification of biology. The Gene Ontology Consortium. Nat Genet. 2000;25:25–29. doi: 10.1038/75556. [DOI] [PMC free article] [PubMed] [Google Scholar]
- Barash IA, Mathew L, Ryan AF, Chen J, Lieber RL. Rapid muscle-specific gene expression changes after a single bout of eccentric contractions in the mouse. Am J Physiol Cell Physiol. 2004;286:C355–C364. doi: 10.1152/ajpcell.00211.2003. [DOI] [PubMed] [Google Scholar]
- Benjamini Y, Hochberg Y. Controlling the false discovery rate: a practical and powerful approach to multiple testing. J Royal Statist Soc Series B. 1995;57:289–300. [Google Scholar]
- Bodine-Fowler S. Skeletal muscle regeneration after injury: an overview. J Voice. 1994;8:53–62. doi: 10.1016/s0892-1997(05)80319-4. [DOI] [PubMed] [Google Scholar]
- Carlson BM, Faulkner JA. The regeneration of skeletal muscle fibers following injury: a review. Med Sci Sports Exerc. 1983;15:187–198. [PubMed] [Google Scholar]
- Charge SB, Rudnicki MA. Cellular and molecular regulation of muscle regeneration. Physiol Rev. 2004;84:209–238. doi: 10.1152/physrev.00019.2003. [DOI] [PubMed] [Google Scholar]
- Glover JR, Lindquist S. Hsp104, Hsp70, and Hsp40: a novel chaperone system that rescues previously aggregated proteins. Cell. 1998;94:73–82. doi: 10.1016/s0092-8674(00)81223-4. [DOI] [PubMed] [Google Scholar]
- Huard J, Li Y, Fu FH. Muscle injuries and repair: current trends in research. J Bone Joint Surg Am. 2002;84-A:822–832. [PubMed] [Google Scholar]
- Ingalls CP, Warren GL, Armstrong RB. Dissociation of force production from MHC and actin contents in muscles injured by eccentric contractions. J Muscle Res Cell Motil. 1998;19:215–224. doi: 10.1023/a:1005368831198. [DOI] [PubMed] [Google Scholar]
- Jarvinen TAH, Jarvinen TLN, Kaariainen M, Kalimo H, Jarvinen M. Muscle injuries: biology and treatment. Am J Sports Med. 2005;33:745–764. doi: 10.1177/0363546505274714. [DOI] [PubMed] [Google Scholar]
- Khatri P, Draghici S, Ostermeier GC, Krawetz SA. Profiling gene expression using onto-express. Genomics. 2002;79:266–270. doi: 10.1006/geno.2002.6698. [DOI] [PubMed] [Google Scholar]
- Kirkendall DT, Garrett WE., Jr Clinical perspectives regarding eccentric muscle injury. Clin Orthop Relat Res. 2002;403S:S81–S89. doi: 10.1097/00003086-200210001-00010. [DOI] [PubMed] [Google Scholar]
- Kunkel SL. Through the looking glass: the diverse in vivo activities of chemokines. J Clin Invest. 1999;104:1333–1334. doi: 10.1172/JCI8511. [DOI] [PMC free article] [PubMed] [Google Scholar]
- Lieber RL, Shah S, Friden J. Cytoskeletal disruption after eccentric contraction-induced muscle injury. Clin Orthop Relat Res. 2002;403S:S90–S99. doi: 10.1097/00003086-200210001-00011. [DOI] [PubMed] [Google Scholar]
- Lowe DA, Warren GL, Ingalls CP, Boorstein DB, Armstrong RB. Muscle function and protein metabolism after initiation of eccentric contraction-induced injury. J Appl Physiol. 1995;79:1260–1270. doi: 10.1152/jappl.1995.79.4.1260. [DOI] [PubMed] [Google Scholar]
- Mantovani A. The chemokine system: redundancy for robust outputs. Immunol Today. 1999;20:254–257. doi: 10.1016/s0167-5699(99)01469-3. [DOI] [PubMed] [Google Scholar]
- Pavlath GK, Thaloor D, Rando TA, Cheong M, English AW, Zheng B. Heterogeneity among muscle precursor cells in adult skeletal muscles with differing regenerative capacities. Dev Dyn. 1998;212:495–508. doi: 10.1002/(SICI)1097-0177(199808)212:4<495::AID-AJA3>3.0.CO;2-C. [DOI] [PubMed] [Google Scholar]
- Ralph P, Ho MK, Litcofsky PB, Springer TA. Expression and induction in vitro of macrophage differentiation antigens on murine cell lines. J Immunol. 1983;130:108–114. [PubMed] [Google Scholar]
- Rathbone CR, Wenke JC, Warren GL, Armstrong RB. Importance of satellite cells in the strength recovery after eccentric contraction-induced muscle injury. Am J Physiol Regul Integr Comp Physiol. 2003;285:R1490–R1495. doi: 10.1152/ajpregu.00032.2003. [DOI] [PubMed] [Google Scholar]
- Rety S, Osterloh D, Arie JP, Tabaries S, Seeman J, Russo-Marie F, Gerke V, Lewit-Bentley A. Structural basis of the Ca2+–dependent association between S100C (S100A11) and its target, the N-terminal part of annexin I. Structure. 2000;8:175–184. doi: 10.1016/s0969-2126(00)00093-9. [DOI] [PubMed] [Google Scholar]
- Roth J, Vogl T, Sorg C, Sunderkotter C. Phagocyte-specific S100 proteins: a novel group of proinflammatory molecules. Trends Immunol. 2003;24:155–158. doi: 10.1016/s1471-4906(03)00062-0. [DOI] [PubMed] [Google Scholar]
- Seeliger S, Vogl T, Engels IH, Schroder JM, Sorg C, Sunderkotter C, Roth J. Expression of calcium-binding proteins MRP8 and MRP14 in inflammatory muscle diseases. Am J Pathol. 2003;163:2645. doi: 10.1016/S0002-9440(10)63454-2. [DOI] [PMC free article] [PubMed] [Google Scholar]
- Semov A, Moreno MJ, Onichtchenko A, Abulrob A, Ball M, Ekiel I, Pietrzynski G, Stanimirovic D, Alakhov V. Metastasis-associated protein S100A4 induces angiogenesis through interaction with Annexin II and accelerated plasmin formation. J Biol Chem. 2005;280:20833–20841. doi: 10.1074/jbc.M412653200. [DOI] [PubMed] [Google Scholar]
- Simkhovich BZ, Marjoram P, Poizat C, Kedes L, Kloner RA. Brief episode of ischemia activates protective genetic program in rat heart: a gene chip study. Cardiovasc Res. 2003;59:450–459. doi: 10.1016/s0008-6363(03)00399-7. [DOI] [PubMed] [Google Scholar]
- Suginta W, Karoulias N, Aitken A, Ashley RH. Chloride intracellular channel protein CLIC4 (p64H1) binds directly to brain dynamin I in a complex containing actin, tubulin and 14–3–3 isoforms. Biochem J. 2001;359:55–64. doi: 10.1042/0264-6021:3590055. [DOI] [PMC free article] [PubMed] [Google Scholar]
- Summan M, McKinstry M, Warren GL, Hulderman T, Mishra D, Brumbaugh K, Luster MI, Simeonova PP. Inflammatory mediators and skeletal muscle injury: a DNA microarray analysis. J Interferon Cytokine Res. 2003;23:237–245. doi: 10.1089/107999003321829953. [DOI] [PubMed] [Google Scholar]
- Summan M, Warren GL, Mercer RR, Chapman R, Hulderman T, Van Rooijen N, Simeonova PP. Macrophages and skeletal muscle regeneration: a clodronate-containing liposome depletion study. Am J Physiol Regul Integr Comp Physiol. 2006;290:R1488–R1495. doi: 10.1152/ajpregu.00465.2005. [DOI] [PubMed] [Google Scholar]
- Vogl T, Ludwig S, Goebeler M, Strey A, Thorey IS, Reichelt R, Foell D, Gerke V, Manitz MP, Nacken W, Werner S, Sorg C, Roth J. MRP8 and MRP14 control microtubule reorganization during transendothelial migration of phagocytes. Blood. 2004;104:4260–4268. doi: 10.1182/blood-2004-02-0446. [DOI] [PubMed] [Google Scholar]
- Warren GL, Hulderman T, Jensen N, McKinstry M, Mishra M, Luster MI, Simeonova PP. Physiological role of tumor necrosis factor alpha in traumatic muscle injury. FASEB J. 2002a;16:1630–1632. doi: 10.1096/fj.02-0187fje. [DOI] [PubMed] [Google Scholar]
- Warren GL, Hulderman T, Mishra D, Gao X, Millecchia L, O'Farrell L, Kuziel WA, Simeonova PP. Chemokine receptor CCR2 involvement in skeletal muscle regeneration. FASEB J. 2005;19:413–415. doi: 10.1096/fj.04-2421fje. [DOI] [PubMed] [Google Scholar]
- Warren GL, Ingalls CP, Armstrong RB. A stimulating nerve cuff for chronic in vivo measurements of torque produced about the ankle in the mouse. J Appl Physiol. 1998;84:2171–2176. doi: 10.1152/jappl.1998.84.6.2171. [DOI] [PubMed] [Google Scholar]
- Warren GL, Ingalls CP, Lowe DA, Armstrong RB. Excitation-contraction uncoupling: major role in contraction-induced muscle injury. Exerc Sport Sci Rev. 2001;29:82–87. doi: 10.1097/00003677-200104000-00008. [DOI] [PubMed] [Google Scholar]
- Warren GL, Ingalls CP, Lowe DA, Armstrong RB. What mechanisms contribute to the strength loss that occurs during and in the recovery from skeletal muscle injury? J Orthop Sports Phys Ther. 2002b;32:58–64. doi: 10.2519/jospt.2002.32.2.58. [DOI] [PubMed] [Google Scholar]
- Warren GL, Ingalls CP, Shah SJ, Armstrong RB. Uncoupling of in vivo torque production from EMG in mouse muscles injured by eccentric contractions. J Physiol. 1999;515:609–619. doi: 10.1111/j.1469-7793.1999.609ac.x. [DOI] [PMC free article] [PubMed] [Google Scholar]
- Warren GL, O'Farrell L, Summan M, Hulderman T, Mishra D, Luster MI, Kuziel WA, Simeonova PP. Role of CC chemokines in skeletal muscle functional restoration after injury. Am J Physiol Cell Physiol. 2004;286:C1031–C1036. doi: 10.1152/ajpcell.00467.2003. [DOI] [PubMed] [Google Scholar]
- Welikson RE, Fischman DA. The C-terminal Igl domains of myosin-binding proteins C and H (MyBP-C and MyPB-H) are both necessary and sufficient for the intracellular crosslinking of sarcomeric myosin in transfected non-muscle cells. J Cell Sci. 2002;115:3517–3526. doi: 10.1242/jcs.115.17.3517. [DOI] [PubMed] [Google Scholar]
- Yan Z, Choi S, Liu X, Zhang M, Schageman JJ, Lee SY, Hart R, Lin L, Thurmond FA, Williams RS. Highly coordinated gene regulation in mouse skeletal muscle regeneration. J Biol Chem. 2003;278:8826–8836. doi: 10.1074/jbc.M209879200. [DOI] [PubMed] [Google Scholar]
- Zhao XS, Gallardo TD, Lin L, Schageman JJ, Shohet RV. Transcriptional mapping and genomic analysis of the cardiac atria and ventricles. Physiol Genomics. 2002;12:53–60. doi: 10.1152/physiolgenomics.00086.2002. [DOI] [PubMed] [Google Scholar]
Associated Data
This section collects any data citations, data availability statements, or supplementary materials included in this article.


