Abstract
Activation of the KATP channels results in faster fatigue rates as the channels depress action potential amplitude, whereas abolishing the channel activity has no effect in whole extensor digitorum longus (EDL) and soleus muscles. In this study, we examined the effects of abolished KATP channel activity during fatigue at 37°C on free intracellular Ca2+( ) and tetanic force using single muscle fibres and small muscle bundles from the flexor digitorum brevis (FDB). KATP channel deficient muscle fibres were obtained (i) pharmacologically by exposing wild-type fibres to glibenclamide, and (ii) genetically using null mice for the Kir6.2 gene (Kir6.2−/− mice). Fatigue was elicited using 200 ms tetanic contractions every second for 3 min. This study demonstrated for the first time that abolishing KATP channel activity at 37°C resulted in faster fatigue rates, where decreases in peak
  and tetanic force were faster in KATP channel deficient fibres than in control wild-type fibres. Furthermore, several contractile dysfunctions were also observed in KATP channel deficient muscle fibre. They included partially or completely supercontracted single muscle fibres, greater increases in unstimulated
  and unstimulated force, and lower force recovery. We propose that the observed faster rate of fatigue in KATP channel deficient fibres is because the decreases in peak
  and force caused by contractile dysfunctions prevail over the expected slower decreases when the channels do not depress action potential amplitude.
Muscle activity increases metabolic rate between 20- and 100-fold depending on fibre type and activity intensity (Gibbs, 1987). Skeletal muscles have mechanisms to increase ATP production necessary to meet the increased metabolic rate. However, many muscular activities eventually lead to an ATP demand that exceeds ATP production (Fitts, 1994). The resulting energy deficit then affects the work capacity of the Na+,K+-ATPase, Ca2+-ATPase, and myosin-ATPase. Ultimately, these effects reduce the capacity of muscle to generate force or do work. If the energy deficit is excessive it can then result in fibre damage and cell death. Consequently, muscles require mechanisms that prevent damaging ATP depletion. The ATP-sensitive K+ channel (KATP channel) may be involved in such mechanisms. The channel activity is regulated by the energy state of the cell. It is activated during an energy deficit, i.e. when intracellular ATP decreases while intracellular ADP and H+ and extracellular adenosine increase (Noma, 1983; Davies, 1990; Vivaudou et al. 1991; Barrett-Jolley et al. 1996).
In unfatigued muscle fibres, KATP channel openers reduce action potential amplitude (Gong et al. 2003) because the increased outward K+ current opposes the inward Na+ depolarization current. During fatigue, KATP channel activation leads to further reductions in action potential amplitude, as well as faster decreases in Ca2+ release and force (Duty & Allen, 1995; Burton & Smith, 1997; Matar et al. 2000; Gong et al. 2003). Thus, activation of KATP channels increases the rate of fatigue. On this basis, it was expected that blocking KATP channels would result in a slower fatigue rate.
However, abolishing KATP channel activity leads to the possible development of one or more contractile dysfunctions. In this study, we define the term ‘contractile dysfunction’ as any event from the generation of action potentials to the actin–myosin interaction that is depressed in a manner not associated with the normal process of fatigue (or any metabolic stress), and that eventually incapacitate muscle from generating force. For example, during fatigue or metabolic inhibition, it is normal to observe a depolarization of the cell membrane and small increases in unstimulated force (when muscles fail to fully relax between contractions). However, in the absence of KATP channel activity the membrane depolarization (Gramolini & Renaud, 1997) and the increases in unstimulated force are much greater (Gramolini & Renaud, 1997; Gong et al. 2000; Matar et al. 2000). The membrane depolarization incapacitates muscle by increasing the degree of Na+ channel inactivation; i.e. it decreases membrane excitability and eventually force development. Furthermore, compared to control conditions, KATP channel deficient muscles have lower capacity to recover force following fatigue (Light et al. 1994; Matar et al. 2000; Gong et al. 2000; Gong et al. 2003). Finally, the absence of KATP channel activity results in fibre damage in skeletal muscle during swimming and treadmill running (Kane et al. 2004; Thabet et al. 2005). Taken together, the final effects of no KATP channel activity on fatigue then depend on the balance between slower rates associated with slower decreases in action potential amplitude and faster rates associated with contractile dysfunctions.
It is therefore interesting that most in vitro studies have reported no effect on the rate of fatigue when KATP channel activity is abolished. This was observed with a pharmacological approach using the channel blocker glibenclamide (Weselcouch et al. 1993; Light et al. 1994; Duty & Allen, 1995; Van Lunteren et al. 1998; Matar et al. 2000), and with a genetic approach using muscles from null mice for the Kir6.2 gene (Kir6.2−/− mice) (Gong et al. 2000; Gong et al. 2003), the gene that encodes for the subunit making the channel pore (Inagaki et al. 1997). These studies bring into question whether the KATP channel affects force during fatigue.
Many of the in vitro studies of KATP channel function have used whole soleus and extensor digitorum longus (EDL) muscles at 37°C. At that temperature, these muscles have a significant anoxic core that cannot be ignored (Barclay, 2005). For example, blocking mitochondrial respiration with cyanide largely increases the rate of fatigue in single soleus muscle fibres, but has very little effect in whole muscle (Zhang et al. 2006). It is therefore possible that the anoxic core masks the effect of no KATP channel activity. Many investigators have attempted to resolve the problem of the large anoxic core by studying muscle fatigue at 22–25°C. However, such experimental temperatures are not physiological.
In resting mouse, the subcutaneous temperature near the flexor digitorum brevis (FDB) is 30°C (Bruton et al. 1998). During exercise, core body temperature in rat increases 3–4°C. The skin temperature, which is heated by conduction from warmed blood from active muscles, increases from 30°C to 36°C (Fuller et al. 1998; Gonzales-Alonso et al. 1999). It is therefore highly likely that during exercise, the temperature of active skeletal muscles, which generate a large amount of heat, reaches or exceeds 37°C. Furthermore, the effects of ions and metabolites on contractility, and their role in the aetiology of muscle fatigue, are temperature dependent (Westerblad et al. 1997; Pedersen et al. 2003; Debold et al. 2006).
To fully understand the effects of no KATP channel activity during fatigue at 37°C, it is necessary to use smaller muscle preparations than whole EDL and soleus muscles. The objective of this study was to determine, at 37°C, the effects of no KATP channel activity during fatigue using single fibres and small bundles from the mouse FDB muscle. We hypothesized that abolishing KATP channel activity at 37°C results in an apparent faster rate of fatigue because the contractile dysfunctions prevail over the expected slower decreases associated with smaller depression of action potential amplitude. Testing this hypothesis is important for understanding the role of KATP channels during fatigue in skeletal muscle. Most types of fatigue involve a decrease in intracellular Ca2+() as a major contributing factor for the decrease in force (Allen et al. 1995). So, in this study, we measured the effects of no KATP channel activity on peak and force.
Methods
Animals, muscle bundle and single fibre preparation
Experimental approaches
Pharmacological and genetic approaches were used to abolish KATP channel activity. For the pharmacological approach, FDBs from wild-type mice were exposed to 10 μm glibenclamide. For the genetic approach, FDBs from null mice for the Kir6.2 gene (Kir6.2−/− mice) were used (Miki et al. 1998); muscle fibres from these mice have no KATP channel activity in the sarcolemma (Miki et al. 2002). Two different preparations were used: single fibres and small bundles. Since mechanically dissected single fibres are resilient to the stresses of dissection and heat (Moopanar & Allen, 2006), isolated single fibres were collected by dispersing them following a collagenase treatment, which gave viable single fibres to measure . Small muscle bundles were used to measure force as our single fibre preparations do not have tendons after the collagenase treatment.
Animal care
Two- to three-month-old CD1 (wild-type, from Charles River, Canada) and Kir6.2−/− mice weighing 20–30 g were fed ad libitum, and housed according to the guidelines of the Canadian Council for Animal Care (CCAC). The Animal Care Committee of the University of Ottawa approved all experimental procedures used in this study. Mice were anaesthetized with a single intraperitoneal injection of 2.2 mg ketamine, 0.44 mg xylazine, and 0.22 mg acepromazine per 10 g of body mass. FDBs were excised and then mice were killed with an overdose of anaesthetics.
Isolation of muscle bundles
The FDB is made up of three major bundles that control via individual tendons the 2nd, 3rd and 4th digit of the paw (Greene, 1968). All experiments with bundles were carried out by excising the fibres controlling the 4th digit by cutting along and very close to the lateral fascia separating the fibres of the 3rd and 4th digit; note that the cut separated fibres controlling the 3rd digit away from the fascia, leaving the fibres controlling the 4th digit intact. On average, the bundles contained 350 ± 40 fibres (mean ± standard error of the mean (s.e.m.), number of samples n= 8), weighed 2.2 ± 0.1 mg and were 8.2 ± 0.1 mm long (n= 42). Assuming a cylindrical shape and a density of 1.06 g cm−3, the average radius was 0.31 ± 0.01 mm and cross-sectional area was 0.30 ± 0.01 mm2.
Isolation of single fibres
Single fibres were obtained by incubating whole FDBs for 4 h at 37°C in a culture medium containing minimum essential medium with Earle's salts and l-glutamine (MEM, Gibco, Canada), supplemented with 10% fetal bovine serum (FBS, Gibco), 0.2% type I collagenase (Sigma, USA), 100 units ml−1 of penicillin and 100 μg ml−1 of streptomycin (Gibco). Fibres were separated by trituration with a Pasteur pipette, plated on a coverslip covered with Matrigel (VWR, Canada), and incubated overnight at 37°C in the same culture medium (without collagenase) before being used.
Solutions
Bundles and single fibres were constantly immersed in physiological saline solution containing (mm): 118.5 NaCl, 4.7 KCl, 2.4 CaCl2, 3.1 MgCl2, 25 NaHCO3, 2 NaH2PO4, and 5.5 d-glucose. Solutions were continuously bubbled with 95% O2–5% CO2 for a pH of 7.4. Solutions containing 10 μm glibenclamide were prepared by first dissolving glibenclamide in DMSO, which was then added to the saline solution. The final DMSO concentration was 0.1% (v/v) in all solutions (including control). All experiments were conducted at 37°C.
Force measurement in FDB bundles
The muscle chambers were made of Plexiglas measuring 10 mm long, 10 mm wide and 5 mm deep. Solution entered the chamber through two Teflon pieces located just behind the bundles. The total flow of solution was 15 ml min−1 divided equally over the upper and lower parts of the bundles. Force measurements were carried out using paired bundles, one as control and the other exposed to glibenclamide (all bundles were fatigued only once). There was thus four experimental groups: (i) control wild-type, (ii) glibenclamide wild-type, (iii) control Kir6.2−/−, and (iv) glibenclamide Kir6.2−/−. Muscle length was adjusted to give maximum tetanic force. Force was monitored with a Cambridge ergometer (model 300, USA) or a Kulite force transducer (Model BD100, Canada), and digitized at 5 kHz by a Keithley Metrabyte A-D board (model DAS50, USA). Peak tetanic force, unstimulated force and peak total force were analysed using a computer as defined in the Results section.
measurement in FDB single fibres
Five to seven single fibres were tested from each mouse; some of the fibres under control conditions and the remaining fibres exposed to 10 μm glibenclamide. Fibres were loaded with Fura-2 by exposing them for 30 min at 37°C to 5 μm Fura-2AM (Molecular Probes, Canada) dissolved in culture medium containing 0.1% (v/v) DMSO. The coverslip containing the fibres was then transferred to a chamber (model RC-25, Warner Instruments, USA). The flow of saline solution was maintained at 2–3 ml min−1 while temperature was maintained at 37°C with a dual channel heater (model TC-344B, Warner Instruments, USA), one channel heating the incoming fluid and the other heating the chamber itself.
was monitored by illuminating fibres alternately at 340 and 380 nm and measuring fluorescence at 505 nm using a spectrofluorometer (IonSpec, Canada). The ratio was then calculated by dividing the fluorescence from the 340 nm excitation by the fluorescence from the 380 nm excitation. In this study, the [Ca2+]i was not calculated from the 340/380 fluorescence ratio as many KATP channel deficient fibres supercontracted giving ratios greater than 5, largely exceeding the expected Rmax reported by Westerblad & Allen (1991).
Stimulation and fatigue protocol
The stimulation and fatigue protocols were as described in previous studies using mouse EDL and soleus (Gong et al. 2000; Matar et al. 2000). Briefly, bundles and single fibres were allowed to equilibrate for 30 min in the absence or presence of 10 μm glibenclamide. During that time, tetanic contractions were elicited with 200 ms trains of supramaximal (8 V) square waves of 0.3 ms duration every 100 s; stimulation frequencies for bundles and single fibres were, respectively, 200 and 140 Hz (some single fibres became unstable when stimulation frequencies exceeded 140 Hz). Pulses were generated with a Grass S88 stimulator and a Grass SIU5 isolation unit (Grass Instruments, USA). For bundles, the stimulating platinum wires (4 mm apart) were located on opposite sides of the bundles. For single fibres, the platinum wires (7 mm apart) were positioned on each side of the chamber.
Fatigue was elicited with one tetanic contraction every second for 3 min in the absence or presence of 10 μm glibenclamide. After fatigue, muscles were stimulated at 10, 20 and 100 s, and every 100 s thereafter to measure force or recovery. It is important to note that under control conditions single fibres could not be fatigued with 400 ms tetanic contractions because, at 37°C, it resulted in sudden contractile failure before the end of the fatigue period, as previously reported by Moopanar & Allen (2006).
Fibre integrity
Evans blue was used as an indicator of cell membrane damage in skeletal muscle (Anderson et al. 2006). Control and glibenclamide wild-type, and control Kir6.2−/− bundles were fatigued as described above, except that 0.01% Evans blue was added to the solution 30 min prior to fatigue and remained present until bundles were frozen. Paired bundles were used with only one bundle exposed to Evans blue in order to determine (i) the autofluorescence from muscle cross-sections, and (ii) whether Evans blue itself affects the fatigue kinetics for each of the three experimental conditions. Immediately after fatigue, bundles were embedded in optimal cutting temperature compound (OCT, Tissue Tek II, USA) and frozen in isopentane precooled in liquid nitrogen. As positive control, one control Kir6.2−/− bundle was stretched during 12 consecutive 1 s long contractions as described by Decrouy et al. (1997). Cross-sections, 10 μm thick, were cut at −20°C using a cryostat. Cross-sections were viewed immediately using a Sony digital camera (Model DXC-950, Canada) attached to a Zeiss Axiophot fluorescent microscope and connected to a computer. Pictures were taken first with visible light illumination to see the fibres and then with excitation at 545 nm to visualize the red fluorescence from Evans blue using the Zeiss filter set 15. A fibre was identified as Evans blue positive if under visible light it appeared blue and under 545 nm excitation it fluoresced red.
Statistical analysis
Data are presented as the mean ± standard error of the mean (s.e.m.) with the number of samples, n. Student's t test was used to compare the means before fatigue. ANOVA was used to determine significant differences during fatigue and recovery. Split plot designs were used since muscles were tested at all time levels. ANOVA calculations were made using the version 9.0 GLM (General Linear Model) procedures of the Statistical Analysis Software (SAS Institute Inc., USA). When a main effect or an interaction was significant, the least square difference (lsd) was used to locate the significant differences (Steel & Torrie, 1980). The word ‘significant’ refers only to a statistical difference (P < 0.05).
Results
Force measurements in FDB bundles
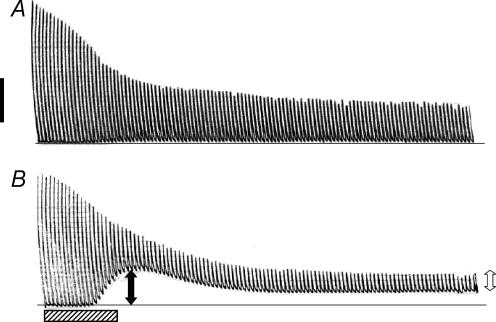
Figure 1A shows a representative trace for the change in force during fatigue in a control wild-type bundle. In this case, most of the decrease in peak force occurred during the first minute while the baseline increased very little. The situation was very different with KATP channel deficient bundles. As shown for a representative trace from a glibenclamide wild-type bundle (Fig. 1B), large increases in the baseline were observed between 20 and 30 s, i.e. KATP channel deficient bundles failed to fully relax between contractions. So, to fully understand the effects of no KATP channel activity, we characterized the fatigue kinetics using three parameters. The first was the peak tetanic force defined as the maximum change in force during tetanic stimulation, and calculated as the difference between the maximum force during the contraction and the force just before the contraction was elicited as shown in Fig. 1B. The second was the unstimulated force, defined as the force exerted by a bundle between stimulations because it failed to completely relax between contractions. Unstimulated force was calculated by averaging the force values during the 20 ms preceding a contraction. The third parameter was the peak total force calculated as the sum of the peak tetanic force and unstimulated force.
Figure 1. Representative traces showing the changes in unstimulated force, peak tetanic force and peak total force during fatigue in (A) one control wild-type and (B) one glibenclamide wild-type FDB bundle.
Fatigue was elicited at 37°C with one tetanic contraction every second for 3 min. Peak tetanic force (open arrow in B) was calculated as the difference between the force just before contraction and the maximum force during contraction. Unstimulated force (filled arrow in B) was calculated from the difference in force between the baseline just before fatigue (horizontal line in A and B) and the force before contraction. Peak total force was calculated as the sum of the unstimulated force and peak tetanic force. Horizontal hatched bar represents 30 s; vertical black bar represent 15 N cm−2.
Pre-fatigue peak tetanic force
There was no unstimulated force prior to fatigue, so pre-fatigue peak tetanic force and peak total force were the same. Under control conditions, mean peak tetanic force was significantly less in Kir6.2−/− than wild-type bundles (Table 1). Peak tetanic force was slightly lower in the presence of 10 μm glibenclamide than in control conditions, but the difference was not significant.
Table 1.
Kir6.2−/− FDB bundles developed less peak tetanic force than wild-type bundles
| Experimental conditions | Peak tetanic force (N cm−2) | |
|---|---|---|
| Wild-type bundle | Kir6.2−/− bundle | |
| Control | 53.8 ± 4.1 | 37.8 ± 5.5* |
| Glibenclamide | 48.8 ± 6.0 | 32.0 ± 5.3* |
| (10 μm) | ||
Peak tetanic forces were measured just prior to fatigue. Data are given as the mean ±s.e.m. of 5 wild-type and 6 Kir6.2−/− bundles.
Significantly different from wild-type bundles, t test, P < 0.05.
Peak tetanic force during fatigue
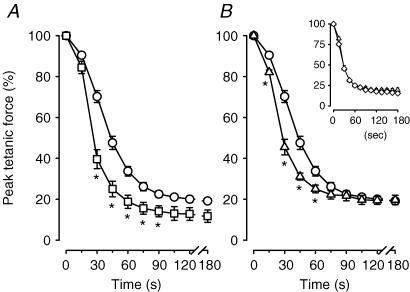
On an average basis, most of the decrease in peak tetanic force during fatigue occurred during the first 60 s (Fig. 2A). At that time, the mean peak tetanic force of control wild-type bundles was 34% of the pre-fatigue peak tetanic force. It then only decreased another 15% during the last 120 s. The decreases in peak tetanic force were significantly faster in the presence of glibenclamide. After 30 s, peak tetanic forces in the absence and presence of glibenclamide were, respectively, 70% and 40%, representing a 30% difference. Peak tetanic force of glibenclamide wild-type bundles remained less than that under control conditions, albeit the differences were no longer significant after 105 s of stimulation. At 180 s, peak tetanic forces of control and glibenclamide wild-type bundles were, respectively, 20% and 12% of the pre-fatigue values.
Figure 2. KATP channel deficient FDB bundles had faster decreases in peak tetanic force than wild-type control FDBs during fatigue at 37°C.
Peak tetanic force was expressed as a percentage of the pre-fatigue peak tetanic force. Symbols:^, control wild-type; □, glibenclamide (10 μm) wild-type; ▵, control Kir6.2−/−; ⋄, glibenclamide (10 μm) Kir6.2−/− (inset). Vertical bars represent the s.e.m. of 5 wild-type and 6 Kir6.2−/− bundles. *Significantly different from control wild-type, ANOVA and lsd,P < 0.05.
The initial decreases in peak tetanic forces were also faster in Kir6.2−/− than in wild-type bundles under control conditions (Fig. 2B). After 30 s, the difference in peak tetanic force between wild-type and Kir6.2−/− bundles was 25%, a difference similar to the one observed between control and glibenclamide wild-type bundles. However, the difference between wild-type and Kir6.2−/− fibres did not persist throughout the entire fatigue period, as the differences completely disappeared by 90 s. Exposing Kir6.2−/− bundles to 10 μm glibenclamide had no effect on the decrease in peak tetanic force when compared to control Kir6.2−/− bundles (Fig. 2B, inset).
Unstimulated force during fatigue
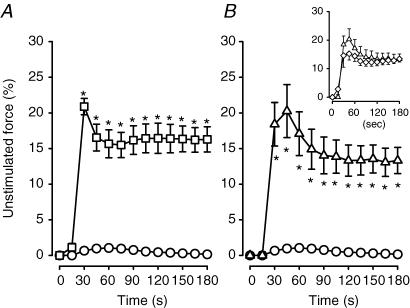
Mean unstimulated force increased very little in control wild-type bundles, reaching a maximum of 1% of the pre-fatigue peak tetanic force after 45 s (Fig. 3A). Unstimulated force of glibenclamide wild-type (Fig. 3A) and control Kir6.2−/− bundles (Fig. 3B) increased sharply to 20% between the 15th and 30th second of stimulation. It decreased slightly thereafter, but remained at 13–15% for the rest of the fatigue period. In the presence of glibenclamide, Kir6.2−/− bundles generated slightly less unstimulated force compared to control conditions, but the differences were not significant (Fig. 3B, inset).
Figure 3. KATP channel deficient FDB bundles developed more unstimulated force than wild-type control FDBs during fatigue at 37°C.
Unstimulated force was expressed as a percentage of the pre-fatigue peak tetanic force. Symbols:^, control wild-type; □, glibenclamide (10 μm) wild-type; ▵, control Kir6.2−/−; ⋄, glibenclamide (10 μm) Kir6.2−/− (inset). Vertical bars represent the s.e.m. of 5 wild-type and 6 Kir6.2−/− bundles. *Significantly different from control wild-type, ANOVA and lsd,P < 0.05.
Peak total force during fatigue
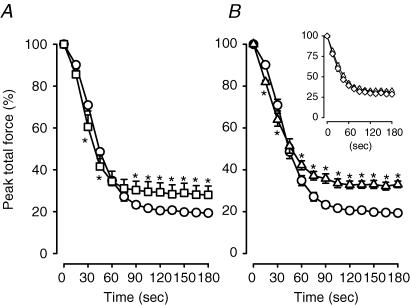
For the first 30 s, the decreases in mean peak total force were significantly faster in glibenclamide wild-type and control Kir6.2−/− bundles compared to control wild-type bundles (Fig. 4). The differences, however, were small, being less than 10% in all cases. Thereafter peak total force became significantly greater in both glibenclamide wild-type and control Kir6.2−/− bundles compared to control wild-type bundles. By the end of the fatigue period, peak total force of control wild-type bundles was 19% compared to 28% and 33% for glibenclamide wild-type and control Kir6.2−/− bundles, respectively. Glibenclamide had no significant effect on the decrease in peak total force in Kir6.2−/− bundles (Fig. 4B, inset).
Figure 4. KATP channel deficient FDB bundles had smaller decreases in peak total force than wild-type control FDBs during fatigue at 37°C.
Peak total force was expressed as a percentage of the pre-fatigue peak total force. Symbols:^, control wild-type; □, glibenclamide (10 μm) wild-type; ▵, control Kir6.2−/−; ⋄, glibenclamide (10 μm) Kir6.2−/− (inset). Vertical bars represent the s.e.m. of 5 wild-type and 6 Kir6.2−/− bundles. *Significantly different from control wild-type, ANOVA and lsd,P < 0.05.
Peak tetanic force during recovery
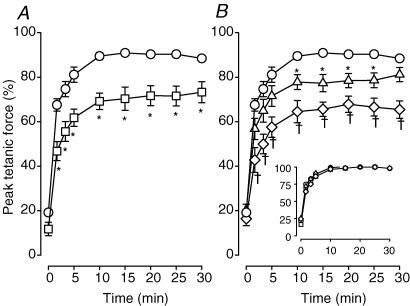
Following fatigue, mean peak tetanic force of control wild-type bundles recovered to a maximum of 91% of the pre-fatigue value within 15 min (Fig. 5A). The extent of peak tetanic force recovery was significantly less for KATP channel deficient bundles. After 30 min, peak tetanic forces of glibenclamide wild-type and control Kir6.2−/− bundles were, respectively, 73% and 81% (Fig. 5A and B). Contrary to the situation observed during fatigue, 10 μm glibenclamide further reduced the extent of peak tetanic force recovery in Kir6.2−/− bundles to 65%. Of all the parameters measured in bundles, this is the only observation for which glibenclamide had an effect in Kir6.2−/− FDB. To better determine if the time to reach maximum force during recovery was different between the different experimental conditions, we also calculated peak tetanic force as a percentage of the force at 25 min of recovery. As shown in the inset of Fig. 5, the time course was the same for all four experimental conditions.
Figure 5. KATP channel deficient FDB bundles recovered less force following fatigue at 37°C than wild-type control FDBs.
A–B, peak tetanic force was expressed as a percent of the pre-fatigue force; inset: peak tetanic force was expressed as a percentage of the force at 25 min of recovery. Symbols:^, control wild-type; □, glibenclamide (10 μm) wild-type; ▵, control Kir6.2−/−; ⋄, glibenclamide (10 μm) Kir6.2−/−. Vertical bars represent the s.e.m. of 5 wild-type and 6 Kir6.2−/− bundles. *Significantly different from control wild-type, ANOVA and lsdP < 0.05. †Significantly different from control Kir6.2−/−, ANOVA and lsd,P < 0.05.
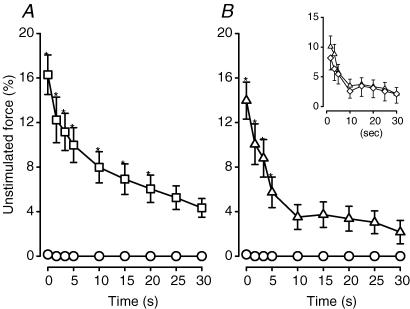
In both glibenclamide wild-type and control Kir6.2−/− bundles, unstimulated force continuously decreased during recovery, but was still above zero after 30 min (Fig. 6). Glibenclamide had no effect on the recovery of unstimulated force in Kir6.2−/− bundles. So, compared to wild-type control bundle, fatigue rates were faster, unstimulated force greater, and force recovery less when the KATP channel activity was abolished pharmacologically using glibenclamide or genetically using Kir6.2−/− muscles.
Figure 6. Unstimulated force in KATP channel deficient FDB bundles decreased during the recovery period at 37°C but did not completely disappear.
Unstimulated force was expressed as a percentage of the pre-fatigue force. Symbols:^, control wild-type; □, glibenclamide (10 μm) wild-type; ▵, control Kir6.2−/−; ⋄, glibenclamide (10 μm) Kir6.2−/− (inset). Vertical bars represent the s.e.m. of 5 wild-type and 6 Kir6.2−/− bundles. *Significantly different from control wild-type, ANOVA and lsd,P < 0.05.
Fibre integrity
FDB bundles
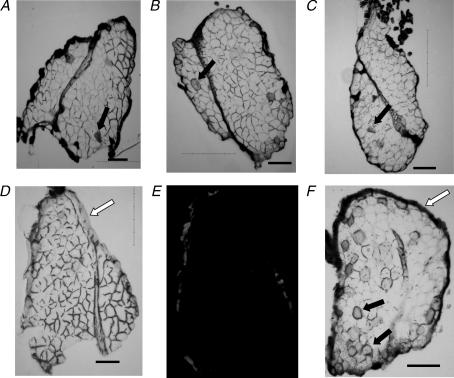
To determine if the reduced capacity of KATP channel deficient bundles to recover force following fatigue was due to fibre damage at the level of the cell membrane, another group of bundles were fatigued in the presence of 0.01% Evans blue, which leaks into the cytosol when the cell membrane is damaged (Anderson et al. 2006). The changes in peak tetanic force and unstimulated force during fatigue in the presence of Evans blue were similar to those shown in Figs 2 and 3, respectively. A fibre was identified as Evans blue positive if under visible light it appeared blue and under 545 nm excitation it fluoresced red. There was no observed stained or fluorescent fibre in cross-sections from bundles (n= 12) that were not exposed to Evans blue during fatigue, as shown for one cross-section in Fig. 7D and E. Less than three fibres (< 1%) per bundle were stained when control wild-type bundles (n= 4) were fatigued in the presence of Evans blue as shown for one bundle in Fig. 7A. The same was observed for glibenclamide wild-type (n= 4) and control Kir6.2−/− bundles (n= 4) as shown for a representative from each group in Fig. 7B and C.
Figure 7. Evans blue did not stain FDB fibres during fatigue at 37°C.
Bundles were fatigued in the presence of 0.01% Evans blue and cross-section visualized under visible light. A–C, representative from control wild-type (A); glibenclamide wild-type (B); control Kir6.2−/− (C). D and E, negative control: control wild-type bundle fatigued in the absence of Evans blue and cross-section visualized under visible light (D) or excited at 545 nm for red fluorescence (E). F, positive control: one control Kir6.2−/− bundle after 12 eccentric contractions. Open arrows show the facia (D) that stained dark in the presence of Evans blue (E). Filled arrows show examples of fibres stained with Evans blue. Horizontal bars represent 100 μm.
Eccentric contractions, elicited by stretching muscle fibres during contraction, are known to cause cell membrane damage (Decrouy et al. 1997). So, as a positive control, one control Kir6.2−/− bundle was stretched during 12 consecutive 1 s long contractions. As shown in Figs 7(F) and 43 fibres (25%) were Evans blue positive. So, the lack of a significant number of Evans blue positive fibres following fatigue would indicate that the cell membrane was still intact after fatigue.
Single fibres
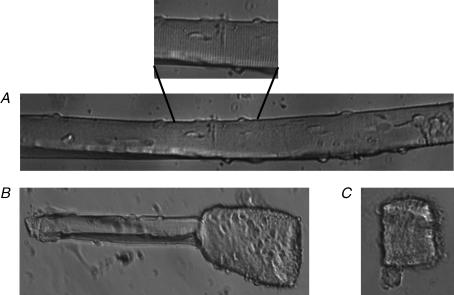
Single fibres were used to monitor . Prior to any measurements, almost all (> 95%) fibres contracted vigorously and had visible A and I bands. For 13 fibres (from 9 wild-type mice), the A and I bands remained clearly visible after fatigue under control conditions as shown for one fibre in Fig. 8A. Nineteen fibres (from 9 wild-type mice) were fatigued in the presence of 10 μm glibenclamide. Four fibres (21%) kept their pre-fatigue appearance throughout the fatigue period. The remaining 15 glibenclamide fibres either had one end supercontracted with visible A and I bands in the intact portion (11 fibres or 58%, Fig. 8B) or the entire fibre was supercontracted (4 fibres or 21%, Fig. 8C). Eleven fibres from seven Kir6.2−/− mice were tested under control conditions; five (45%) fibres remained intact and six (55%) partially supercontracted. Ten others fibres (from 7 Kir6.2−/− mice) were exposed to 10 μm glibenclamide and under those conditions 70% of the fibres supercontracted (4 partially and 3 completely).
Figure 8. Examples of wild-type single FDB fibres after fatigue: under control conditions (A), in the presence of 10 μm glibenclamide with one end supercontracted (B), and fully supercontracted (C).
Fibre appearance of a non-fatigue single fibre is not shown as they are similar in appearance to that in A. Each picture is from a different fibre. Note the appearance of A and I bands in A.
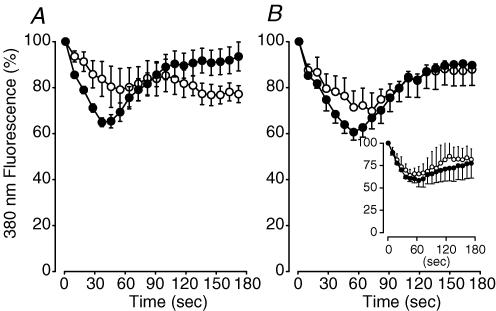
To further test whether the supercontractions were associated with cell membrane damage we examined the fura-2 fluorescence intensities while fibres were at rest and illuminated at 380 nm. The expectation was that if the membrane was damaged and in the process became leaky, then there would be a rapid loss of fura-2 and thus fluorescence. On average, the fluorescence intensities decreased during the first minute in all KATP channel deficient fibres (Fig. 9). Thereafter, the fluorescence intensities increased back toward pre-fatigue levels. There was no sudden loss of fluorescence whether the fibres were partially or fully supercontracted.
Figure 9. KATP channel deficient FDB fibres had no sudden loss of Fura-2.
A, wild-type fibres exposed to 10 μm glibenclamide; B, Kir6.2−/− fibres under control conditions; inset: Kir6.2−/− fibres exposed to 10 μm glibenclamide. Fluorescence at 505 nm from an excitation of 380 nm was averaged over the 100 ms preceding each contraction during the fatigue period, and was expressed as a percentage of the fluorescence of the pre-fatigue value. Symbols:^, fibres that did not supercontract; •, fibres that partially or fully supercontracted. Vertical bars represent the s.e.m. (the number of fibres are given in Results).
Unstimulated and peak
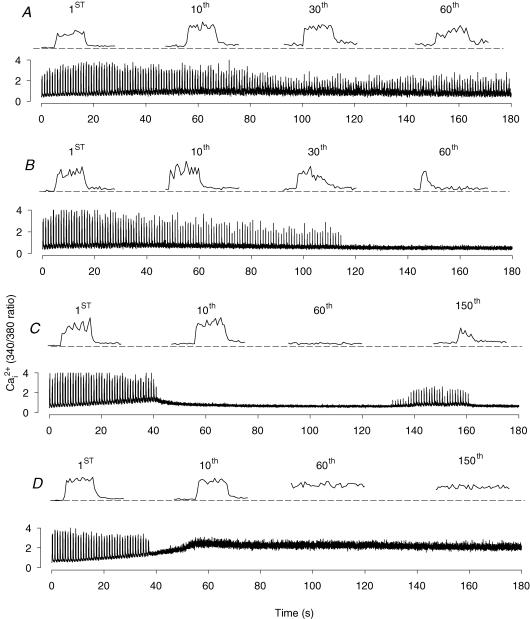
To be consistent with the force parameters, unstimulated was defined as the level in the absence of stimulation and was calculated by averaging the fura-2 340/380 fluorescence ratios during the 100 ms period just preceding a contraction. Peak was defined as the maximum Ca2+ level during a contraction and was calculated by averaging the fura-2 340/380 fluorescent ratio of the plateau phase. When fatigued under control conditions, wild-type fibres contracted throughout the entire fatigue period (Fig. 10A). In one representative trace, peak initially increased for about 20 s and then decreased until the 90th second; thereafter it remained relatively constant until the end of the fatigue period. For these fibres, unstimulated increased only slightly.
Figure 10. Lack of KATP channel activity impaired intracellular Ca2+ regulation during fatigue in FDB single fibres at 37°C.
Representative Ca2+ traces from one control wild-type fibre (A), and fibres that remained intact but stop contracting (B), that partially supercontracted (C), and that fully supercontracted in the presence of 10 μm glibenclamide (D). Bottom traces show the entire trace, top traces show individual Ca2+ transient at the indicated contraction number with the dashed lines representing the unstimulated before fatigue.
When wild-type fibres were exposed to 10 μm glibenclamide, the changes in varied according to the final fibre appearance. For the fibres that did not supercontract (n= 4), contractions stopped within 120 s of stimulation as shown for one fibre in Fig. 10B. For these fibres, the increase in unstimulated was also very small. Fibres, that partially supercontracted (n= 11) at one end, had larger increases in unstimulated Ca2+i until they stopped contracting upon stimulation within 60 s. Thereafter, unstimulated decreased rapidly. For 3 of the 11 fibres, some contractions could be observed later in the fatigue period as shown for one fibre in Fig. 10C. However, for most fibres (8 out of 11), no other contractions were observed. The increase in unstimulated was the largest in the four fibres that fully supercontracted, as shown for one fibre in Fig. 10D. The changes in unstimulated and peak during fatigue in control and glibenclamide Kir6.2−/− fibres were similar to those observed for glibenclamide wild-type fibres (i.e. as shown in Fig. 10B–D).
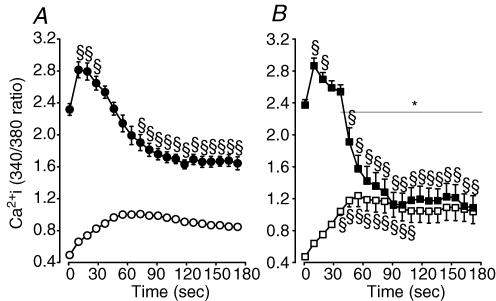
To better understand how the lack of KATP channel activity affected the changes in force in bundles, we calculated average unstimulated and peak from all fibres for each experimental condition. The mean pre-fatigue unstimulated 340/380 fluorescence ratios were not different between control and glibenclamide wild-type fibres (0.49 versus 0.47; Fig. 11). During the first minute of fatigue the mean unstimulated ratio increased to a maximum of 1.01 in control fibres and to 1.24 in the presence of glibenclamide. Thereafter, the unstimulated ratios decreased slowly.
Figure 11. The increase in unstimulated and the decrease in peak were smaller and slower in control conditions than in the presence of glibenclamide.
Mean changes in unstimulated and peak during fatigue at 37°C in control (A) and glibenclamide (10 μm) wild-type FDB single fibres (B). Symbols:^, •, control wild-type unstimulated and peak , respectively; □, ▪, glibenclamide (10 μm) wild-type unstimulated and peak , respectively. Vertical bars represent the s.e.m. of 13 control and 19 glibenclamide fibres from 9 wild-type mice. *Time (with horizontal line) when peak of glibenclamide fibres was significantly different from control fibres, ANOVA and lsd,P < 0.05. §Mean unstimulated or peak significantly different from mean value at time 0, ANOVA and lsd,P < 0.05.
The initial peak 340/380 fluorescent ratios were also not different before fatigue between control (2.32) and glibenclamide wild-type fibres (2.37). During the first 10–15 s of the fatigue period, peak ratios increased to a maximum of 2.83 in control fibres, which was not significantly different from the maximum value of 2.87 in glibenclamide fibres. However, the peak ratios remained significantly above the pre-fatigue peak ratios for much longer in control conditions (up to 30 s) compared to glibenclamide fibres (only 19 s). Another significant difference between the two groups of fibres was the faster decrease in peak ratios in glibenclamide fibres compared to those in control conditions. Finally, for the last minute of the fatigue period, the peak ratios in control fibres were between 1.64 and 1.67, which was significantly different from those in glibenclamide muscle for which the ratios were between 1.10 and 1.20. Furthermore, for the last 90 s of the fatigue period, the unstimulated and peak ratios in glibenclamide fibres were not different as many fibres had stopped contracting.
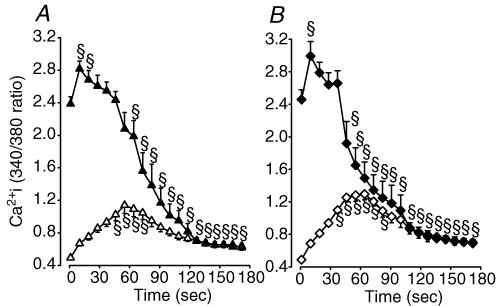
The changes in unstimulated and peak in control Kir6.2−/− fibres (Fig. 12A) were quite similar to those observed for glibenclamide wild-type fibres (Fig. 11B). That is, there was a rapid increase in unstimulated during the first minute and a rapid decrease in peak between the 60th and 90th seconds. There were also two major differences between the two groups. Firstly, the decreases in unstimulated during the last 2 min were greater in control Kir6.2−/− fibres than in glibenclamide wild-type fibres. Secondly, unstimulated and peak became the same when fibres stopped contracting at 90 s in glibenclamide wild-type fibres compared to 110 s for control Kir6.2−/− fibres. The changes in unstimulated and peak in Kir6.2−/− fibres were similar between control (Fig. 12A) and glibenclamide conditions (Fig. 12B). Comparing ratios between the two experimental conditions did not give rise to any significant difference.
Figure 12. In Kir6.2−/− FDB fibres, the increase in unstimulated and the decrease in peak during fatigue at 37°C were also extensive while glibenclamide had no effect.
Mean changes in unstimulated and peak in control (A) and glibenclamide (10 μm) Kir6.2−/− FDB fibres (B). Symbols: ▵, ▴, control Kir6.2−/− unstimulated and peak , respectively; ⋄, ♦, glibenclamide Kir6.2−/− unstimulated and peak , respectively. Vertical bars represent the s.e.m. of 11 control and 10 glibenclamide fibres from 6 Kir6.2−/− mice. §Mean unstimulated and peak significantly different from mean value at time 0, ANOVA and lsdP < 0.05.
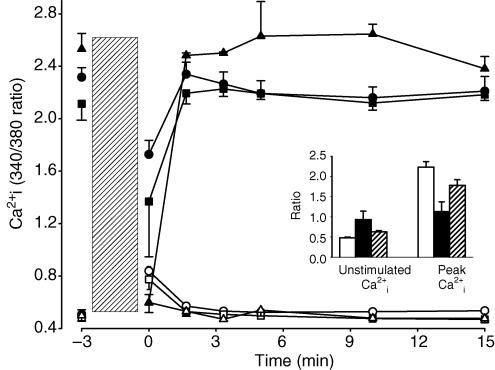
Following fatigue, the unstimulated and peak ratios rapidly returned within 100 s to their pre-fatigue levels. This was observed for all 13 wild-type fibres under control conditions, and for all KATP channel deficient fibres that did not supercontract; i.e. the four glibenclamide wild-type fibres and the five control Kir6.2−/− fibres (Fig. 13). None of the supercontracted fibres recovered as unstimulated remained high. Among the fibres that partially supercontracted, only three glibenclamide wild-type fibres partially recovered unstimulated and peak (Fig. 13, inset). The three fibres were the same fibres that also contracted during fatigue (Fig. 10C).
Figure 13. FDB fibres that did not supercontract during fatigue fully recovered unstimulated and peakafter fatigue.
Symbols:^, □, ▵, unstimulated ; •, ▪, ▴, peak ;^, •, control wild-type (n= 13); □, ▪, glibenclamide wild-type (n= 4); ▵, ▴, control Kir6.2−/− fibres (n= 5). Vertical hatched bar represents the 3 min fatigue period with time −3 min being the pre-fatigue values. Inset: recovery of unstimulated and peak only from the glibenclamide wild-type fibres (n= 3) that partially supercontracted during fatigue (all other similar fibres had no recovery of peak ). Symbols: □, pre-fatigue value; ▪, after fatigue; hatched square, after 15 min of recovery.
Discussion
This study shows for the first time that abolishing KATP channel activity in FDBs during fatigue at 37°C causes faster and greater decreases in peak and peak tetanic force. Supercontraction of single fibres, greater increases in unstimulated and force during fatigue, and lower force recovery following fatigue were also observed in KATP channel deficient FDBs.
FDB muscle bundle and single fibre to study KATP channels
The observation that KATP channel deficient fibres have faster decreases in peak and peak tetanic force is not in agreement with previous studies that have reported no effect (Weselcouch et al. 1993; Light et al. 1994; Duty & Allen, 1995; Van Lunteren et al. 1998; Gong et al. 2000, 2003; Matar et al. 2000). In some of these studies, experiments were carried out at non-physiological temperatures of 20–25°C. For the studies using 37°C, a large anoxic core may have masked the effects of no KATP channel activity (see Introduction). In this study, we employed a test temperature of 37°C, but used smaller muscle preparations.
Wild-type FDB single fibres, dispersed after a collagenase treatment to reduce the stress of mechanical dissection (Moopanar & Allen, 2006), contracted upon stimulation throughout the entire 3 min fatigue period under control conditions. Peak initially increased and then decreased to below pre-fatigue levels as previously reported for mechanically dissected single fibres (Westerblad & Allen, 1991). Several KATP channel deficient fibres supercontracted during fatigue, an effect not observed at lower temperatures (Duty & Allen, 1995). More importantly, the cause of the supercontraction may also be a cause for fibre damage (see next section), i.e. our preparation may help in explaining the observation made in vivo (Thabet et al. 2005) that KATP channel deficient muscle fibres become damaged during muscle activity.
Peak tetanic force cannot be measured in fibres after a collagenase treatment because of the lack of tendon. Instead, we used small FDB bundles, which, on average, were 8 mm long and 2 mg in weight compared to 8 mm and 10 mg for both soleus and EDL muscles (Barclay et al. 2006). From the model of Barclay (2005) on O2 diffusion in isolated muscle, an anoxic core is not expected at rest for these muscles. During fatigue with a contraction duty cycle of 0.2, the radius of the anoxic core is expected to be 0.4 mm in EDL and soleus and only 0.1 mm in FDB bundles. Despite the slight anoxic core, the FDB bundle still represents a better preparation. Firstly, peak tetanic force recovery was 92% in control wild-type FDB compared to 40% in EDL and 70% in soleus (Gong et al. 2000, 2003). Secondly, a decrease in peak is a major factor contributing to the decrease in force during fatigue (Allen et al. 1995). Compared to control wild-type, KATP channel deficient bundles had faster decreases in peak tetanic force as expected from the faster decrease in peak in single fibres. Thus, FDB bundles and single fibres are better than whole EDL and soleus to study KATP channel function at 37°C.
Effect of no KATP channel activity during fatigue
Fibre damage
The occurrence of fibre damage during exercise in skeletal muscle lacking KATP channel activity was first reported in vivo following swimming (Kane et al. 2004) and treadmill running (Thabet et al. 2005) using null mice for the Kir6.2 gene. In those studies, it was not possible to determine whether the damage was related to the lack of KATP channel activity in skeletal muscle fibres, or to a failure of the heart (Zingman et al. 2002) resulting in insufficient blood flow to active muscles.
In our study, 79% of glibenclamide wild-type single fibres and 55% of control Kir6.2−/− fibres supercontracted during fatigue and never recovered their pre-fatigue appearance. The supercontractions in single fibres are primarily due to the lack of constraint as there is no tendon to maintain constant length. Consequently, the supercontractions themselves are not fully comparable with fibre damage. However, the supercontractions were associated with large increases in unstimulated , a known cause of fibre damage (Jackson et al. 1984). Our results therefore provide evidence that the lack of KATP channel activity can lead to fibre damage during fatigue. More importantly, the supercontractions were observed in fibres that were superfused over most of their surface area. Thus, our results strongly support the conclusions of Thabet et al. (2005) that, in skeletal muscle, the KATP channels are active during exercise and fatigue and critical in preventing fibre damage, and that the damage during treadmill running was not due to insufficient blood flow.
Treadmill running only affects type IIB fibres of Kir6.2−/− hindlimb muscles and all fibre types in diaphragm (Thabet et al. 2005). FDB is primarily composed of type IIA and IIX fibres (less than 5% are I and IIB fibres; Raymackers et al. 2000). This suggests that the role of KATP channels in preventing fibre damage is not limited to type IIB fibres in hindlimb muscles. It is possible that the metabolic stress on hindlimb type IIA and IIX fibres during treadmill running is less than in our in vitro model.
Cell membranes are usually impermeable to Evans blue, unless they become damaged and leaky. Contrary to the effects of eccentric contractions (Decrouy et al. 1997), Evans blue stained very few fibres during fatigue. More importantly, no difference was observed between control, glibenclamide wild-type, and control Kir6.2−/− bundles. Furthermore, KATP channel deficient single fibres, which partially or fully supercontracted, had no sudden and large decreases in fura-2 fluorescence intensities (from the 380 nm excitation) as expected if the membrane had become damaged and leaky (a decrease in fluorescence was observed during the first min of fatigue and was most likely because of the increase in ). Thus, the damage in KATP channel deficient fibres does not seem to involve the outer surface cell membrane. This does not, however, eliminate the possibility of damage in t-tubules, the sarcoplasmic reticulum or sarcomeres.
Contractile dysfunctions
In the Introduction, we define ‘contractile dysfunction’ as any event from the generation of action potentials to the actin–myosin interaction that is depressed in a manner not associated with the normal process of fatigue (or any metabolic stress) and that eventually incapacitate muscle to generate force.
Pre-fatigue force
The maximum force generated in unfatigued FDB bundles of 2- to 3-month-old-mice were on average 30% less in Kir6.2−/− than wild-type bundles. Kir6.2−/− EDL of 1-year-old mice generates 21% less force than wild-type EDL while Kir6.2−/− soleus generates 11% less force (Gong et al. 2000). However, no differences in force were observed between wild-type and Kir6.2−/− EDL and soleus of 2- to 3-month-old-mice. Thus, the chronic lack of KATP channel activity reduces the capacity of muscles to generate force, but the extent of the decrease is time and muscle dependent. The nature of the contractile dysfunction causing the force loss and the difference between muscles cannot, however, be explained from our data.
Unstimulated force
We found that KATP channel deficient bundles generate more unstimulated force than control bundles. The FDB bundles generated twice as much unstimulated force as EDL (Gong et al. 2000; Gong et al. 2003; Matar et al. 2000), suggesting that the greater generation of unstimulated force in KATP channel deficient muscles is not linked to the anoxic core, which is the smallest in FDBs (see section above). The factor contributing to unstimulated force is most likely an uncontrolled increase in unstimulated causing excessive shortening in single fibres and unstimulated force in bundles kept at constant length.
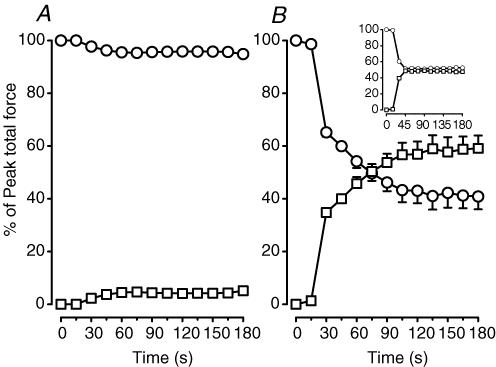
Unstimulated force constitutes a minute portion of peak total force in control wild-type fibres (Fig. 14A), yet it represented 50% or more of the peak total force in KATP channel deficient bundles for most of the fatigue period (Fig. 14B). Such large unstimulated force is expected to lower muscle performance in vivo. Firstly, when unstimulated force develops, antagonist muscles must then do more work to overcome the extra opposing force, and consequently fatigue faster. Lower cardiac performance has been shown to be a factor that reduces fatigue resistance in Kir6.2−/− mice (Zingman et al. 2002; Kane et al. 2004). We now suggest that the generation of unstimulated force is another factor. Secondly, eccentric contractions will occur in muscles generating unstimulated force when antagonist muscles contracts. Eccentric contraction is a known factor for fibre damage (Decrouy et al. 1997), and consequently unstimulated force is most likely a factor contributing to the fibre damage reported during swimming and treadmill running in Kir6.2−/− mice (Zingman et al. 2002; Thabet et al. 2005). Thus, the large unstimulated and resulting unstimulated force in Kir6.2−/− muscles should be considered as contractile dysfunctions because (i) they were not observed in control wild-type muscles and (ii) they can depress force generation.
Figure 14. During fatigue unstimulated force contributed 50–60% of the peak total force in KATP channel deficient FDBs.
A, control wild-type; B, glibenclamide wild-type (10 μm). Inset: control Kir6.2−/−. For each time period, peak tetanic force (^) and unstimulated force (□) were calculated as a percentage of peak total force.
Force recovery
KATP channel deficient FDBs recovered about 20% less peak tetanic force than control wild-type FDBs (Fig. 5) compared to 10–15% difference for EDL and none for soleus (Gong et al. 2000, 2003; Matar et al. 2000). The dependency of force recovery on KATP channel activity is thus in the order of FDB > EDL > soleus. Interestingly, the importance of KATP channels in preventing fibre damage is in the same order (as determined in this study for FDB, in Thabet et al. (2005) for EDL and soleus). Furthermore, the recovery of unstimulated and peak in KATP channel deficient single fibres that supercontracted during fatigue was (i) incomplete and (ii) in only a small number of fibres (20% for glibenclamide wild-type fibres and 0% for control Kir6.2−/− fibres). Fibre damage is thus the most likely explanation for the lower force recovery in KATP channel deficient bundles.
Abolishing KATP channel activity using a pharmacological approach in wild-type muscles (i.e. glibenclamide) or a genetic approach using Kir6.2−/− muscles has always given similar results in terms of peak and force, unstimulated and force, during both fatigue and recovery (this study for FDB, Gong et al. (2000) for EDL and soleus). Glibenclamide also had no significant effect on the decrease in peak and force, as well as the increase in unstimulated and force in Kir6.2−/− muscles. We now, for the first time, report that glibenclamide reduced peak tetanic force recovery in Kir6.2−/− bundles.
The possibility that glibenclamide has a non-specific effect cannot be eliminated using the data reported in this study. Glibenclamide can inhibit mitochondrial KATP channels (Garlid et al. 1997). Furthermore, Matar et al. (2000) have reported that before and during fatigue, KATP channel modulators affect ATP levels in the oxidative soleus, but not in the glycolytic EDL; they suggested that the effects in soleus were most likely due to a modulation of mitochondrial KATP channel activity. Since FDB muscles are also oxidative (type IIA and IIX fibres, Raymackers et al. 2000), it is then possible that the lower peak tetanic force recovery in glibenclamide-exposed Kir6.2−/− bundles (compared to Kir6.2−/− control) is because of an impairment in ATP production by mitochondria.
Rate of fatigue
During the initial 60 s of the fatigue period, the decreases in peak and peak tetanic force were significantly faster in KATP channel deficient than in control wild-type single fibres and bundles. The decreases in peak total force were also faster in KATP channel deficient bundles, but the differences with control wild-type bundles were significant only at 30 and 45 s and much smaller compared to the differences for peak and peak tetanic force. Overall, the changes in peak , peak tetanic force and peak total force suggest that during most of the first 60 s fatigue rate was faster in KATP channel deficient bundles and single fibres.
During the last 2 min of the fatigue period, the difference in peak tetanic force between normal and KATP channel deficient bundles eventually disappeared, but never became greater in KATP channel deficient bundles. Peak total force, on the other hand, became greater in KATP channel deficient bundles. In most studies using isometric contractions, the rate of fatigue is determined from the decrease in peak total force; unstimulated force is ignored because it contributes very little to peak total force as we also report here for control wild-type bundles (Fig. 14A). However, in KATP channel deficient bundles, the unstimulated force is considerable, reaching more than 20% of pre-fatigue peak total force (Fig. 3). More importantly, it contributed 50–60% of the peak total force during fatigue (Fig. 14B), and may come from fibres which supercontracted while being unexcitable as observed in single fibres. Consequently, using just peak total force as an index of fatigue can be misleading.
Several studies (e.g. Allen et al. 1995) have shown that decreases in peak is a major cause for the decrease in force during fatigue in normal muscles. If the data from peak total force are to be taken as evidence for slower fatigue rate, then peak should also be greater in KATP channel deficient fibres during that time. This was clearly not the case as peak remained much lower in KATP channel deficient than in control wild-type fibres until the end of the fatigue period. We therefore suggest that the major impact of abolishing KATP channel activity, by either pharmacological or genetic means, is faster fatigue rate.
This result was unexpected because KATP channel openers increase the rate of fatigue (Weselcouch et al. 1993; Matar et al. 2000). For the openers, the mechanism of action starts with a depression of action potential amplitude as the KATP channels provide an outward K+ current that reduces the extent of the Na+ depolarizing current (Gong et al. 2003). In the case of no KATP channel activity, a different mechanism must cause the faster fatigue rate.
If fibre damage is one mechanism, then it must occur during the fatigue period. If they had occurred during recovery, one would expect slower recovery in KATP channel deficient bundles. However, KATP channel deficient single fibres that did not supercontract during fatigue not only fully recovered their unstimulated and peak , but did so with a time course similar to control wild-type fibres. Furthermore, force recovery in bundles had similar time courses whether the KATP channel activity was normal or abolished. All supercontractions in KATP channel deficient single fibres occurred during the first 60 s of fatigue. Finally, the sudden rise in unstimulated force that occurred between the 15th and 30th second corresponded to the time when decreases in peak tetanic force and peak total force in KATP channel deficient bundles became faster. We therefore propose that most of the fibre damage occurred during the first 60 s of fatigue, disabling fibres from contracting correctly upon stimulation increasing the rate at which force decreases in bundles.
Fibre damage, however, cannot be the only reason for the faster decreases in force in bundles. This is because there was a group of KATP channel deficient single fibres that had a faster decrease in peak and eventually completely stopped contracting even though they did not supercontract, had very low unstimulated , and completely recovered peak . In cardiac and skeletal muscle, membrane depolarization during metabolic inhibition is much greater in the presence than in the absence of glibenclamide; in skeletal muscles, the depolarization can be as large as 30 mV (Gramolini & Renaud, 1997; Baczko et al. 2004). Membrane potentials were not measured in this study, but large depolarizations are likely to occur in KATP channel deficient fibres because of a lower K+ conductance. If so, the depolarization would increase the degree of Na+ channel inactivation resulting in lower action potential amplitude, and consequently lower Ca2+ release and force. Thus, large membrane depolarization constitutes another possible contractile dysfunction that increases the rate of fatigue in the absence of KATP channel activity.
In conclusion, our study shows that most of the time the absence of KATP channel activity gives rise to faster fatigue rates because the decrease in force associated with fibre damage and contractile dysfunctions prevails over the slower decreases that are expected as the channels no longer diminish action potential amplitude. We also observed that many KATP channel deficient fibres supercontracted, and had large increases in unstimulated and unstimulated force, and a lower capacity to recover force following fatigue.
Acknowledgments
This study was supported by a grant from the National Science and Engineering Research Council (NSERC) to Jean-Marc Renaud. The authors are also thankful to Dr T. Miki and S. Seino from Kobe University, Japan, for providing the Kir6.2−/− mice. Finally the authors are thankful to Dr A. Krantis for his comments on the manuscript.
References
- Allen DG, Lännergren J, Westerblad H. Muscle cell function during prolonged activity: cellular mechanisms of fatigue. Exp Physiol. 1995;80:497–527. doi: 10.1113/expphysiol.1995.sp003864. [DOI] [PubMed] [Google Scholar]
- Anderson CL, de Repentigny Y, Cifelli C, Renaud JM, Worton RG, Kothary R. The mouse dystrophin muscle promoter/enhancer drives expression of mini-dystrophinin transgenic mdx mice and rescues the dystrophy in these mice. Mol Ther. 2006;14:724–734. doi: 10.1016/j.ymthe.2006.04.013. [DOI] [PubMed] [Google Scholar]
- Baczko I, Giles WR, Light PE. Pharmacological activation of plasma-membrane KATP channels reduces reoxygenation-induced Ca2+ overload in cardiac myocytes via modulation of the diastolic membrane potential. Br J Pharmacol. 2004;141:1059–1067. doi: 10.1038/sj.bjp.0705702. [DOI] [PMC free article] [PubMed] [Google Scholar]
- Barclay CJ. Modelling diffusive O2 supply to isolated preparations of mammalian skeletal and cardiac muscle. J Muscle Res Cell Motil. 2005;26:225–235. doi: 10.1007/s10974-005-9013-x. [DOI] [PubMed] [Google Scholar]
- Barclay CJ, Constable JK, Gibbs CL. Energetics of fast- and slow-twitch muscle of the mouse. J Physiol. 2006;472:61–80. doi: 10.1113/jphysiol.1993.sp019937. [DOI] [PMC free article] [PubMed] [Google Scholar]
- Barrett-Jolley R, Comtois A, Davies NW, Stanfield PR, Standen NB. Effect of adenosine and intracellular GTP on KATP channels of mammalian skeletal muscle. J Membrane Biol. 1996;152:111–116. doi: 10.1007/s002329900090. [DOI] [PubMed] [Google Scholar]
- Bruton JD, Lännergren J, Westerblad H. Effects of CO2-induced acidification on the fatigue resistance of single mouse muscle fibers at 28°C. J Appl Physiol. 1998;85:478–483. doi: 10.1152/jappl.1998.85.2.478. [DOI] [PubMed] [Google Scholar]
- Burton FL, Smith GL. The effect of cromakalim on intracellular [Ca2+] in isolated rat skeletal muscle during fatigue and metabolic blockage. Exp Physiol. 1997;82:469–483. doi: 10.1113/expphysiol.1997.sp004040. [DOI] [PubMed] [Google Scholar]
- Davies NW. Modulation of ATP-sensitive K+ channels in skeletal muscle by intracellular protons. Nature. 1990;343:375–377. doi: 10.1038/343375a0. [DOI] [PubMed] [Google Scholar]
- Debold EP, Romatowski J, Fitts RH. The depressive effect of Pi on the force-pCa relationship in skinned single muscle fibers is temperature dependent. Am J Physiol Cell Physiol. 2006;290:C1041–C1050. doi: 10.1152/ajpcell.00342.2005. [DOI] [PubMed] [Google Scholar]
- Decrouy A, Renaud JM, Davis HL, Lunde JA, Dickson G, Jasmin BJ. Mini-dystrophin gene transfer in mdx4CV diaphragm muscle fibers increases sarcolemmal stability. Gene Ther. 1997;4:401–408. doi: 10.1038/sj.gt.3300407. [DOI] [PubMed] [Google Scholar]
- Duty S, Allen DG. The effects of glibenclamide on tetanic force and intracellular calcium in normal and fatigued mouse skeletal muscle. Exp Physiol. 1995;80:520–541. doi: 10.1113/expphysiol.1995.sp003865. [DOI] [PubMed] [Google Scholar]
- Fitts RH. Cellular mechanism of muscle fatigue. Physiol Rev. 1994;74:49–94. doi: 10.1152/physrev.1994.74.1.49. [DOI] [PubMed] [Google Scholar]
- Fuller A, Carter RN, Mitchell D. Brain and abdominal temperatures at fatigue in rats exercising in the heat. J Appl Physiol. 1998;84:877–883. doi: 10.1152/jappl.1998.84.3.877. [DOI] [PubMed] [Google Scholar]
- Garlid KD, Paucek P, Yarov-Yarovoy V, Murray HN, Darbenzio RB, D'Alonzo AJ, Lodge NJ, Smith MA, Grover GJ. Cardioprotective effect of diazoxide and its interaction with mitochondrial ATP-sensitive K+ channels. Circulation Res. 1997;81:1072–1082. doi: 10.1161/01.res.81.6.1072. [DOI] [PubMed] [Google Scholar]
- Gibbs CL. Comparative muscle energetics and the cost of activation. Proc Austr Physiol Pharmac Soc. 1987;18:115–123. [Google Scholar]
- Gong B, Legault D, Miki T, Seino S, Renaud JM. KATP channels depress force by reducing action potential amplitude in mouse EDL and soleus. Am J Physiol Cell Physiol. 2003;285:C1464–C1474. doi: 10.1152/ajpcell.00278.2003. [DOI] [PubMed] [Google Scholar]
- Gong B, Miki T, Seino S, Renaud JM. A KATP channel deficiency affects resting tension, not contractile force, during fatigue in skeletal muscle. Am J Physiol Cell Physiol. 2000;279:C1351–C1358. doi: 10.1152/ajpcell.2000.279.5.C1351. [DOI] [PubMed] [Google Scholar]
- Gonzales-Alonso J, Teller C, Andersen SL, Jensen FB, Hyldig T, Nielsen B. Influence of body temperature on the development of fatigue during prolonged exercise in the heat. J Appl Physiol. 1999;86:1032–1039. doi: 10.1152/jappl.1999.86.3.1032. [DOI] [PubMed] [Google Scholar]
- Gramolini A, Renaud JM. Blocking ATP-sensitive K+ channel during metabolic inhibition impairs muscle contractility. Am J Physiol Cell Physiol. 1997;41:C936–C946. doi: 10.1152/ajpcell.1997.272.6.C1936. [DOI] [PubMed] [Google Scholar]
- Greene EC. The Anatomy of the Rat. 2. New York: Hafner Publishing Co; 1968. [Google Scholar]
- Inagaki N, Gonoi T, Seino S. Subunit stochiometry of the β-cell ATP-sensitive K+ channels. FEBS Lett. 1997;409:232–236. doi: 10.1016/s0014-5793(97)00488-2. [DOI] [PubMed] [Google Scholar]
- Jackson MJ, Jones DA, Edwards RHT. Experimental skeletal muscle damage: the nature of the calcium-activated degenerative processes. Eur J Clin Invest. 1984;14:369–374. doi: 10.1111/j.1365-2362.1984.tb01197.x. [DOI] [PubMed] [Google Scholar]
- Kane GC, Behfar A, Yamada S, Perez-Terzic C, O'Cochlain F, Reyes S, Dzeja PP, Miki T, Seino S, Terzic A. ATP-sensitive K+ channel knockout compromises the metabolic benefit of exercise training, resulting in cardiac deficits. Diabetes. 2004;53:S169–S175. doi: 10.2337/diabetes.53.suppl_3.s169. [DOI] [PubMed] [Google Scholar]
- Light PE, Comtois AS, Renaud JM. The effect of glibenclamide on frog skeletal muscle: evidence for K+ATP channel activation during fatigue. J Physiol. 1994;475:495–507. doi: 10.1113/jphysiol.1994.sp020088. [DOI] [PMC free article] [PubMed] [Google Scholar]
- Matar W, Nosek TM, Wong D, Renaud JM. Pinacidil suppresses contractility and preserves energy but glibenclamide has no effect during fatigue in skeletal muscle. Am J Physiol Cell Physiol. 2000;278:C404–C416. doi: 10.1152/ajpcell.2000.278.2.C404. [DOI] [PubMed] [Google Scholar]
- Miki T, Minami K, Zhang L, Morita M, Gonoi T, Shiuchi T, Minokoshi Y, Renaud JM, Seino S. ATP-sensitive potassium channels participate in glucose uptake in skeletal muscle and adipose tissue. Am J Physiol Endocrinol Metab. 2002;283:E1178–E1184. doi: 10.1152/ajpendo.00313.2002. [DOI] [PubMed] [Google Scholar]
- Miki T, Nagashima H, Tashiro F, Kotake K, Yoshitomi H, Tamamoto A, Gonoi T, Iwanaga T, Miyazaki J-I, Seino S. Defective insulin secretion and enhanced insulin action in KATP channel-deficient mice. Proc Natl Acad Sci U S A. 1998;95:10402–10406. doi: 10.1073/pnas.95.18.10402. [DOI] [PMC free article] [PubMed] [Google Scholar]
- Moopanar TR, Allen DG. The activity-induced reduction of myofibrillar Ca2+ sensitivity in mouse skeletal muscle is reversed by dithiothreitol. J Physiol. 2006;571:191–200. doi: 10.1113/jphysiol.2005.101105. [DOI] [PMC free article] [PubMed] [Google Scholar]
- Noma A. ATP-regulated K+ channels in cardiac muscle. Nature. 1983;305:147–148. doi: 10.1038/305147a0. [DOI] [PubMed] [Google Scholar]
- Pedersen TH, Clausen T, Nielsen OB. Loss of force induced by high extracellular [K+] in rat muscle: effect of temperature, lactic acid and β2-agonist. J Physiol. 2003;551:277–286. doi: 10.1113/jphysiol.2003.041418. [DOI] [PMC free article] [PubMed] [Google Scholar]
- Raymackers JM, Gailly P, Colson-Van Schoor M, Pette D, Schwaller B, Hunziker W, Celio MR, Gillis JM. Tetanus relaxation of fast skeletal muscles of the mouse made parvalbumin deficient by gene inactivation. J Physiol. 2000;527:355–364. doi: 10.1111/j.1469-7793.2000.00355.x. [DOI] [PMC free article] [PubMed] [Google Scholar]
- Steel RGD, Torrie JH. Principles And Procedures Of Statistics. A Biometrical Approach. New York: McGraw-Hill Co.; 1980. [Google Scholar]
- Thabet M, Miki T, Seino S, Renaud JM. Treadmill running causes significant damage in skeletal of muscle KATP channel deficient mice. Physiol Genomics. 2005;22:204–212. doi: 10.1152/physiolgenomics.00064.2005. [DOI] [PubMed] [Google Scholar]
- Van Lunteren E, Moyer M, Torres A. ATP-sensitive K+ channel blocker glibenclamide and diaphragm fatigue during normoxia and hypoxia. J Appl Physiol. 1998;85:601–608. doi: 10.1152/jappl.1998.85.2.601. [DOI] [PubMed] [Google Scholar]
- Vivaudou MB, Arnoult C, Villaz M. Skeletal muscle ATP-sensitive K+ channels recorded from sarcolemmal blebs of split fibers: ATP inhibition is reduced by magnesium and ADP. J Membr Biol. 1991;122:165–175. doi: 10.1007/BF01872639. [DOI] [PubMed] [Google Scholar]
- Weselcouch EO, Sargent C, Wilde MW, Smith MA. ATP-sensitive potassium channels and skeletal muscle function in vitro. J Pharmacol Exp Ther. 1993;267:410–416. [PubMed] [Google Scholar]
- Westerblad H, Allen DG. Changes of myoplasmic calcium concentration during fatigue in single mouse muscle fibers. J Gen Physiol. 1991;98:615–635. doi: 10.1085/jgp.98.3.615. [DOI] [PMC free article] [PubMed] [Google Scholar]
- Westerblad H, Bruton JD, Lännergren J. The effect of intracellular pH on contractile function of intact, single fibres of mouse muscle declines with increasing temperature. J Physiol. 1997;500:193–204. doi: 10.1113/jphysiol.1997.sp022009. [DOI] [PMC free article] [PubMed] [Google Scholar]
- Zhang SJ, Bruton JD, Katz A, Westerblad H. Limited oxygen diffusion accelerates fatigue development in mouse skeletal muscle. J Physiol. 2006;572:551–559. doi: 10.1113/jphysiol.2005.104521. [DOI] [PMC free article] [PubMed] [Google Scholar]
- Zingman LV, Hodgson DM, Bast PH, Kane GC, Perez-Terzic C, Gumina RJ, Pucar D, Bienengraeber M, Dzeja PP, Miki T, Seino S, Alekseev AE, Trezic A. Kir6.2 is required for adaptation to stress. Proc Natl Acad Sci U S A. 2002;99:13278–13283. doi: 10.1073/pnas.212315199. [DOI] [PMC free article] [PubMed] [Google Scholar]


