

Abstract
Objective
Two different Medtronic implantable pulse generator (IPG) models are currently used in clinical applications of deep brain stimulation (DBS): Soletra and Kinetra. The goal of this study was to evaluate and compare the stimulation waveforms produced by each IPG model.
Methods
We recorded waveforms from a broad range of stimulation parameter settings in each IPG model, and compared them to idealized waveforms that adhered to the parameters specified in the programming device. We then used a previously published computational model to predict the neural response to the various stimulation waveforms.
Results
The stimulation waveforms produced by the IPGs differed from the idealized waveforms assumed in previous theoretical and clinical studies, and the waveforms differed among the IPG models. These differences were greater at higher frequencies and longer pulse widths, and caused variations of up to 0.4 V in activation thresholds for model axons located 3 mm from the DBS electrode contact.
Conclusions
The specific details of the stimulation waveform directly affect the neural response to DBS and should be accounted for in theoretical and experimental studies of DBS.
Significance
While the clinical selection of DBS parameters is individualized to each patient based on behavioral outcomes, scientific analysis of stimulation parameter settings and clinical threshold measurements are subject to a previously unrecognized source of error unless the actual waveforms produced by the IPG are accounted for.
Keywords: Parkinson’s disease, essential tremor, dystonia, obsessive compulsive disorder, depression, epilepsy, Tourette’s syndrome
INTRODUCTION
Deep brain stimulation (DBS) is an established therapy for movement disorders, and it shows promise for the treatment of a variety of other neurological conditions. DBS, like other neurostimulation therapies, represents the culmination of decades of basic research on the effects of electrical stimulation on neural tissue. This body of work has demonstrated three important principles: 1) the neural response to stimulation is modulated by the shape of the stimulation waveform, 2) waveforms must be biphasic to prevent tissue damage, and 3) the cathodic (negative) phase of the waveform has the greatest effect on neural activation. These principles are directly relevant for DBS, but the technical details of the stimulation waveforms generated by clinical DBS devices have received little attention.
Clinical programming of DBS is customized to each individual patient, with the goal of optimizing therapeutic benefit. And, it is well recognized that the therapeutic benefit achieved by DBS is primarily dependent on precise electrode placement and careful clinical selection of stimulation parameters (Moro et al., 2006; Rezai et al., 2006; Volkmann et al., 2006). However, the details of the stimulation waveform become important when defining correlations between DBS parameter settings, clinical outcomes, and/or experimental threshold measurements. Several clinical studies have been conducted to determine the differential effects of various stimulation protocols on DBS outcome measures (Benabid et al., 1991; Holsheimer et al., 2000; Rizzone et al., 2001; Moro et al., 2002; O’Suilleabhain et al., 2003; Kuncel et al., 2006). And, multiple theoretical studies have calculated the voltage field generated by DBS (McIntyre and Thakor, 2002; Kuncel and Grill, 2004; McIntyre et al., 2004a; McIntyre et al., 2004b; Hemm et al., 2005; Wei and Grill, 2005; Astrom et al., 2006; Sotiropoulos and Steinmetz, 2007). However, we recently identified discrepancies between the idealized waveforms assumed in these previous studies, and the actual waveforms produced by clinical DBS devices (Butson and McIntyre, 2005). Therefore, the goal of this study was to further characterize the stimulation waveforms generated by DBS IPGs and quantify their impact on neural activation thresholds.
Currently, the Soletra and Kinetra IPG models (Medtronic Inc., Minneapolis, MN) are used in clinical practice. The general stimulation waveform generated by the IPG consists of a cathodic pulse, a brief inter-pulse delay, and a charge-balancing anodic pulse (Figure 1). Two common assumptions are typically made about the Medtronic IPG output. First, the stimulation parameters specified by the IPG programming device reflect the properties of the cathodic phase of the stimulation waveform. Second, the same stimulation waveforms are produced by the different IPG models. However, both of these assumptions are false, and the differences between the expected waveforms and the actual waveforms change as a function of the stimulation parameters. This study documents the differences among the IPG waveforms, and shows that these differences cause variations in the neural response to DBS. These observations have significance for clinicians who administer DBS therapy and for researchers who analyze its effects.
Figure 1.
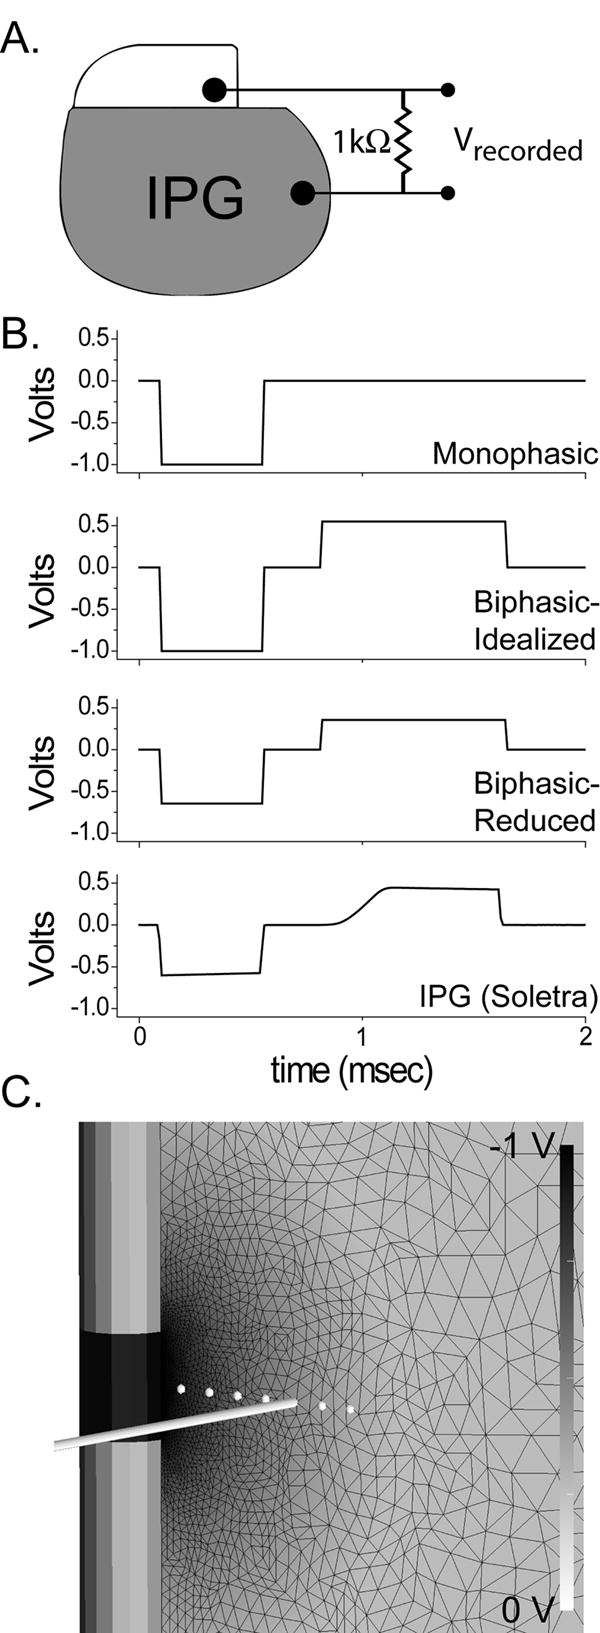
Experimental and model configuration. A) Waveforms from Soletra and Kinetra IPGs were recorded in a monopolar configuration with a 1000 Ω impedance between a single contact output and the IPG case. B) In addition, three waveforms were constructed in Matlab: Monophasic, Biphasic-Idealized and Biphasic-Reduced. The duration of the anodic phase in the biphasic waveforms was determined from the Soletra duration (bottom) as shown in this example. The two biphasic waveforms differ primarily in the amplitude of the cathodic phase. C) Extent of neural activation was evaluated using a previously published finite element model of the DBS electrode and surrounding tissue medium which was coupled to multi-compartment cable models of myelinated axons. Black wireframe shows finite element mesh; voltage values are indicated by background shading according to grayscale bar at right. White circles indicate positions of axons within the electric field, with a representative axon trajectory displayed 3 mm from the center of DBS electrode.
METHODS
We recorded stimulation waveforms from one Kinetra, six Soletra, and six Itrel II IPGs using a Power 1401 digital acquisition interface with Spike2 software (version 5.14, Cambridge Electronic Design, Cambridge, England) on a Dell Optiplex computer running Windows XP. No significant waveform differences were measured among the Soletra or Itrel II IPGs, and the output of one randomly selected Soletra was used in our figures and analysis. All IPGs had battery voltages in the normal range. Recordings were made at 50 kHz with a 1000 Ω load impedance connected between the IPG output and case during monopolar stimulation (Figure 1A). This study documents waveforms recorded at: -1 V (except for neural threshold determination, where the amplitude was varied as needed); 60 μsec, 120 μsec, 210 μsec and 450 μsec pulse width; 100 Hz, 130 Hz and 185 Hz. For each setting, we compared the waveforms recorded from the IPGs to a set of idealized waveforms generated using Matlab (Mathworks, Natick, MA). These idealized waveforms differed from each other in the magnitude of the cathodic phase and the presence of an anodic, charge-balancing phase. Specifically, we generated the following idealized waveforms (Figure 1B): 1) a monophasic square wave with a cathodic pulse that adhered to the exact stimulation parameters (voltage, pulse width and frequency) specified by the programming device; 2) a biphasic waveform identical to the monophasic waveform but with the addition of a square wave, charge-balancing anodic phase that matched the anodic pulse duration generated by the Soletra (BIPHASIC-IDEALIZED); 3) a charge-balanced biphasic waveform, similar to BIPHASIC-IDEALIZED but with a reduced amplitude cathodic pulse that matched the cathodic amplitude generated by the Soletra (BIPHASIC-REDUCED).
Previous studies have examined the clinical outcomes of DBS as a function of the charge or energy injected into the brain (Moro et al., 2002; Koss et al., 2005), and charge is known to be a co-factor in stimulation induced tissue damage (McCreery et al., 1990). In turn, we calculated the cathodic charge per phase for each waveform examined (Figure 2). The was performed by first converting the voltage waveforms (both IPGs are voltage-controlled devices) to current waveforms using Ohm’s law (taking into account the 1000 Ω load which was meant to mimic the in vivo tissue impedance), and then integrating the area under the cathodic phase.
Figure 2.
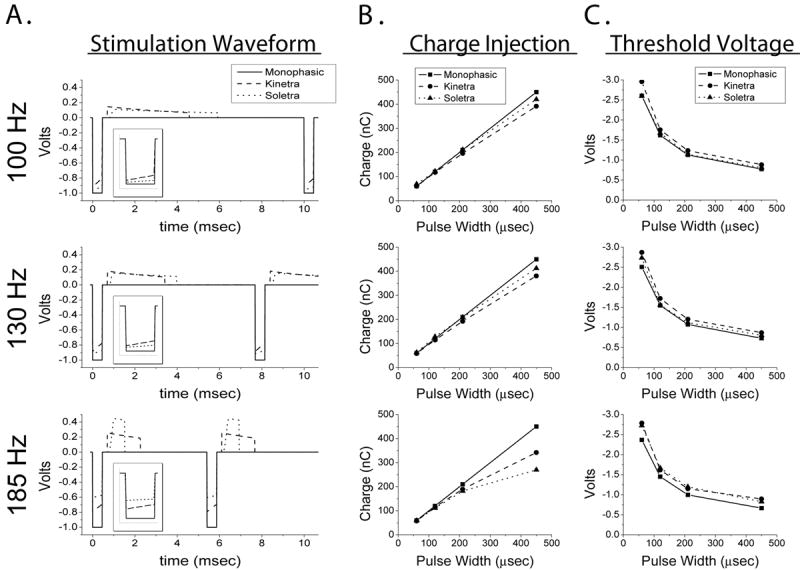
Differences among waveforms. The plots forming the rows of the figure are grouped by stimulation frequency. A) The time course of the stimulation waveforms. The waveforms differed in the magnitude of the cathodic pulse, the duration and amplitude of the anodic pulse, and the presence of decay in the plateau regions of the cathodic and anodic pulses. Displayed waveforms are from -1.0 V, 450 μsec stimulation settings. Inset shows magnified view of the cathodic pulse. B) Charge injected during the cathodic phase of the stimulation waveform. C) Activation threshold voltages for axons located 3 mm from the axis of the DBS electrode.
Neural activation thresholds were calculated using a previously published field-neuron simulation model (Butson et al., 2006a) (Figure 1C). Briefly, a finite element electric field model was used to calculate the voltage distribution surrounding the DBS electrode as a function of stimulation parameters. The model included the capacitance of the electrode-tissue interface, which causes a voltage decay in the plateau phase of the stimulus waveform (Butson and McIntyre, 2005). The model also included explicit representation of the encapsulation tissue that surrounds the electrode, which is correlated with electrode impedance (Butson et al., 2006a). Both the electrode capacitance and the encapsulation layer cause increased threshold voltages. The model system is based on the concept that the primary neural targets of DBS are myelinated axons (McIntyre et al., 2004a; McIntyre et al., 2004b; Miocinovic et al., 2006). Hence, the time- and space-dependent voltage distribution generated in the tissue medium was interpolated onto multi-compartment cable-model axons to determine their activation thresholds (Butson et al., 2006a) (Figure 1C). This general modeling approach has been experimentally validated by examining stimulation side effects due to spillover into oculomotor nerve (Butson et al., 2006b) and corticospinal tract (Miocinovic et al., 2006; Butson et al., 2007).
RESULTS
We observed substantial differences among the stimulation waveforms studied. The waveforms from the Soletra and Kinetra differed from each other, and both IPGs differed from the programmed stimulation parameters represented by the idealized monophasic waveform (Figure 2A). An important discrepancy was in the magnitude of the cathodic pulse, which is significant because this has the greatest effect on neural activation. Specifically, the magnitude of the IPG cathodic pulse was less than expected, and this effect was accentuated at higher frequencies and longer pulse widths. For example, at 185 Hz the programmed voltage was set to -1 V. However, the Soletra had a peak cathodic pulse magnitude of approximately -0.6 V, while the Kinetra was -0.8 V (Figure 2A). Similar results were observed at other frequencies.
The reduction in IPG cathodic pulse magnitude reduces the amount of charge injected during the cathodic phase of the stimulus waveform (Figure 2B). A secondary and more subtle effect is that the voltage of the IPG waveforms decays during the plateau of the cathodic and anodic phases. As a result, the total charge injected during the cathodic pulse can be substantially lower than expected (Figure 2B), and this results in increased threshold voltages for neural activation (Figure 2C). We observed differences of up to 0.4 V in activation thresholds for model axons located 3 mm from the axis of the DBS electrode. At commonly used therapeutic stimulation settings (130 Hz, -3 V, 60 μsec) this caused reductions in the volume of tissue activated relative to the monophasic waveform: 10% reduction for Soletra; 15% reduction for Kinetra.
Two factors were responsible for the observed threshold differences between the IPG waveforms and the idealized monophasic waveform: 1) magnitude of the cathodic phase, and 2) presence of the charge-balancing anodic phase. When we compared the axonal voltage thresholds generated by the idealized monophasic waveforms to that of the Soletra waveforms we found an average difference of 9%. To address the basis for this difference, we compared the thresholds in Figure 2C to those determined using two biphasic waveforms described in Figure 1B. We found that the BIPHASIC-IDEALIZED thresholds were within 2.2% of the idealized monophasic waveform thresholds. In contrast, the BIPHASIC-REDUCED thresholds were within 2.9% of the Soletra waveform thresholds. Therefore, the magnitude of the cathodic phase had a primary effect on the difference in axonal thresholds, while the presence of the anodic phase had a smaller secondary effect.
To facilitate comparisons of activation thresholds between IPGs and parameter settings, Table 1 provides a set of correction factors to convert each IPG to the stimulation equivalent of an idealized monophasic waveform. With this table it is possible to normalize and compare settings among different IPG models, and account for this source of variance across a DBS patient population.
Table 1.
Voltage threshold correction factors for Medtronic IPGs compared to monophasic waveform
| Frequency (Hz) | Pulse Width
(μsec) |
Voltage Threshold Correction Factor | ||
|---|---|---|---|---|
| Monophasic
Waveform |
Soletra
Waveform |
Kinetra
Waveform |
||
| 100 | 60 | 1.00 | 1.00 | 0.88 |
| 120 | 1.00 | 0.97 | 0.92 | |
| 210 | 1.00 | 0.99 | 0.91 | |
| 450 | 1.00 | 0.96 | 0.87 | |
| 130 | 60 | 1.00 | 0.92 | 0.87 |
| 120 | 1.00 | 0.99 | 0.90 | |
| 210 | 1.00 | 0.96 | 0.89 | |
| 450 | 1.00 | 0.91 | 0.84 | |
| 185 | 60 | 1.00 | 0.87 | 0.85 |
| 120 | 1.00 | 0.87 | 0.90 | |
| 210 | 1.00 | 0.83 | 0.87 | |
| 450 | 1.00 | 0.81 | 0.74 | |
All correction factors were calculated for an axon located 3 mm from the axis of the DBS electrode.
DISCUSSION
The differences among IPG waveforms and their resulting effects on neural activation have two important consequences. First, the presence of different IPG models within a patient population is a previously unidentified source of variance in clinical studies of DBS. This could be particularly evident when examining changes in activation thresholds for side effects or therapeutic parameter settings. Second, the waveforms generated by the IPGs differ from the idealized stimulation parameters specified by the clinical programming device. This creates errors when calculating the voltage distribution in the tissue medium or the amount of charge or energy injected into the tissue. Both of these effects are exacerbated for higher frequencies and longer pulse widths.
Three general characteristics define the stimulus waveforms generated by the Soletra and Kinetra. First, the charge injected into the tissue during the cathodic and anodic phases is equal (charge-balanced) for tissue safety considerations. Second, in contrast to the behavior of the external pulse generators used during surgery (Trottenberg et al., 2004), the anodic phase duration is shorter than the stimulation period in ways that are IPG and frequency dependent (Figure 2). Third, and most importantly, the programmed stimulation voltage is roughly equal to the difference between the cathodic and anodic peaks rather than the magnitude of the cathodic pulse alone. These characteristics, when combined together, can result in cathodic pulse magnitudes that are substantially smaller than the programmed stimulation values.
Several important differences exist between the two IPG models. The most obvious clinical difference is that the Kinetra supports two DBS leads for bilateral stimulation, while the Soletra supports only one lead. The two IPG models also have different battery characteristics. The Soletra battery voltage is 3.7V (new) and uses a voltage multiplier circuit to achieve amplitudes above the battery voltage. The multiplier circuit, which is employed for stimulus amplitudes >3.6V, substantially increases power consumption. The Kinetra battery voltage is 3.2V (new) and battery power consumption increases linearly as a function of voltage across the entire stimulus amplitude range of the device.
When comparing the stimulation waveform construction, the Soletra and Kinetra use qualitatively similar strategies. For scientific studies concerned with explicit representation of the details, our analysis suggests that the overall waveform can be broken into four distinct phases: 1) cathodic phase (duration set by the user), 2) an inter-pulse delay at 0 V between the cathodic and anodic phase, 3) anodic phase (duration dependent on stimulation pulse width and frequency), and 4) a final delay at 0 V between the end of the anodic phase and beginning of the next waveform. The inter-pulse delay of the Soletra lasts ~0.5 ms and the final delay lasts ~3.8 ms. In contrast, the Kinetra interleaves two stimulation waveforms (one for each lead in bilateral stimulation) in each cycle, so the effective time interval used to construct the overall waveform is half the period defined by the stimulation frequency. The inter-pulse delay of the Kinetra lasts ~0.2 ms and the final delay is ~0.4 ms (until the start of the pulse on the bilateral lead). In both IPGs, the duration of the anodic phase is defined by the time remaining in the total period after subtracting the cathodic pulse width, inter-pulse delay, and final delay. Because of charge balancing, the ratio of cathodic to anodic magnitude can vary substantially across stimulation parameter settings. And because the amplitude registered on the programming devices is actually representative of the peak-to-peak voltage difference between the cathodic and anodic phases, the effective cathodic pulse amplitude is reduced.
The monophasic cathodic square wave used in our analysis would not be used to stimulate living tissue due to safety considerations. We used the monophasic waveform to illustrate the differences between the expected waveform parameters, as indicated by the programming device, and the actual waveforms produced by the IPGs (Figure 2). In our experience, explicit representation of the actual IPG waveform is an important component of accurate models of the neural response to DBS (Butson and McIntyre, 2005; Butson et al., 2006b; Miocinovic et al., 2006; Butson et al., 2007).
In summary, the actual IPG waveforms should be taken into account for three aspects of DBS research: 1) developing computer models of DBS, 2) calculating charge or energy injected into the tissue during DBS, and 3) correlating DBS parameter settings with clinical outcomes and/or side effects. Further, the IPG model may be an unrecognized source of variance within a patient population, and these differences should be considered in multi-patient studies and patient programming.
Acknowledgments
This work was supported by grants from the Ohio Biomedical Research and Technology Transfer Partnership, and the National Institutes of Health (NS050449 & NS052042) We would also like to thank Scott Cooper, Benjamin Walter, Gary Russo and Jerrold Vitek for helpful discussion on this project.
Footnotes
Publisher's Disclaimer: This is a PDF file of an unedited manuscript that has been accepted for publication. As a service to our customers we are providing this early version of the manuscript. The manuscript will undergo copyediting, typesetting, and review of the resulting proof before it is published in its final citable form. Please note that during the production process errors may be discovered which could affect the content, and all legal disclaimers that apply to the journal pertain.
References
- Astrom M, Johansson JD, Hariz MI, Eriksson O, Wardell K. The effect of cystic cavities on deep brain stimulation in the basal ganglia: a simulation-based study. J Neural Eng. 2006;3:132–138. doi: 10.1088/1741-2560/3/2/007. [DOI] [PubMed] [Google Scholar]
- Benabid AL, Pollak P, Gervason C, Hoffmann D, Gao DM, Hommel M, Perret JE, de Rougemont J. Long-term suppression of tremor by chronic stimulation of the ventral intermediate thalamic nucleus. Lancet. 1991;337:403–406. doi: 10.1016/0140-6736(91)91175-t. [DOI] [PubMed] [Google Scholar]
- Butson CR, McIntyre CC. Tissue and electrode capacitance reduce neural activation volumes during deep brain stimulation. Clin Neurophysiol. 2005;116:2490–2500. doi: 10.1016/j.clinph.2005.06.023. [DOI] [PMC free article] [PubMed] [Google Scholar]
- Butson CR, Maks CB, McIntyre CC. Sources and effects of electrode impedance during deep brain stimulation. Clin Neurophysiol. 2006a;117:447–454. doi: 10.1016/j.clinph.2005.10.007. [DOI] [PMC free article] [PubMed] [Google Scholar]
- Butson CR, Cooper SE, Henderson JM, McIntyre CC. Predicting the effects of deep brain stimulation with diffusion tensor based electric field models. Med Image Comput Comput Assist Interv. 2006b;9(Pt 2):429–437. doi: 10.1007/11866763_53. [DOI] [PubMed] [Google Scholar]
- Butson CR, Cooper SE, Henderson JM, McIntyre CC. Patient-specific analysis of the volume of tissue activated during deep brain stimulation. Neuroimage. 2007;34:661–670. doi: 10.1016/j.neuroimage.2006.09.034. [DOI] [PMC free article] [PubMed] [Google Scholar]
- Hemm S, Mennessier G, Vayssiere N, Cif L, El Fertit H, Coubes P. Deep brain stimulation in movement disorders: stereotactic coregistration of two-dimensional electrical field modeling and magnetic resonance imaging. J Neurosurg. 2005;103:949–955. doi: 10.3171/jns.2005.103.6.0949. [DOI] [PubMed] [Google Scholar]
- Holsheimer J, Demeulemeester H, Nuttin B, de Sutter P. Identification of the target neuronal elements in electrical deep brain stimulation. Eur J Neurosci. 2000;12:4573–4577. [PubMed] [Google Scholar]
- Koss AM, Alterman RL, Tagliati M, Shils JL. Calculating total electrical energy delivered by deep brain stimulation systems. Ann Neurol. 2005;58:168. doi: 10.1002/ana.20525. author reply 168-169. [DOI] [PubMed] [Google Scholar]
- Kuncel AM, Grill WM. Selection of stimulus parameters for deep brain stimulation. Clin Neurophysiol. 2004;115:2431–2441. doi: 10.1016/j.clinph.2004.05.031. [DOI] [PubMed] [Google Scholar]
- Kuncel AM, Cooper SE, Wolgamuth BR, Clyde MA, Snyder SA, Montgomery EB, Jr, Rezai AR, Grill WM. Clinical response to varying the stimulus parameters in deep brain stimulation for essential tremor. Mov Disord. 2006;21:1920–1928. doi: 10.1002/mds.21087. [DOI] [PubMed] [Google Scholar]
- McCreery DB, Agnew WF, Yuen TG, Bullara L. Charge density and charge per phase as cofactors in neural injury induced by electrical stimulation. IEEE Trans Biomed Eng. 1990;37:996–1001. doi: 10.1109/10.102812. [DOI] [PubMed] [Google Scholar]
- McIntyre CC, Thakor NV. Uncovering the mechanisms of deep brain stimulation for Parkinson’s disease through functional imaging, neural recording, and neural modeling. Crit Rev Biomed Eng. 2002;30:249–281. doi: 10.1615/critrevbiomedeng.v30.i456.20. [DOI] [PubMed] [Google Scholar]
- McIntyre CC, Grill WM, Sherman DL, Thakor NV. Cellular effects of deep brain stimulation: model-based analysis of activation and inhibition. J Neurophysiol. 2004a;91:1457–1469. doi: 10.1152/jn.00989.2003. [DOI] [PubMed] [Google Scholar]
- McIntyre CC, Mori S, Sherman DL, Thakor NV, Vitek JL. Electric field and stimulating influence generated by deep brain stimulation of the subthalamic nucleus. Clin Neurophysiol. 2004b;115:589–595. doi: 10.1016/j.clinph.2003.10.033. [DOI] [PubMed] [Google Scholar]
- Miocinovic S, Parent M, Butson CR, Hahn PJ, Russo GS, Vitek JL, McIntyre CC. Computational analysis of subthalamic nucleus and lenticular fasciculus activation during therapeutic deep brain stimulation. J Neurophysiol. 2006;96:1569–1580. doi: 10.1152/jn.00305.2006. [DOI] [PubMed] [Google Scholar]
- Moro E, Poon YY, Lozano AM, Saint-Cyr JA, Lang AE. Subthalamic nucleus stimulation: improvements in outcome with reprogramming. Arch Neurol. 2006;63:1266–1272. doi: 10.1001/archneur.63.9.1266. [DOI] [PubMed] [Google Scholar]
- Moro E, Esselink RJ, Xie J, Hommel M, Benabid AL, Pollak P. The impact on Parkinson’s disease of electrical parameter settings in STN stimulation. Neurology. 2002;59:706–713. doi: 10.1212/wnl.59.5.706. [DOI] [PubMed] [Google Scholar]
- O’Suilleabhain PE, Frawley W, Giller C, Dewey RB., Jr Tremor response to polarity, voltage, pulsewidth and frequency of thalamic stimulation. Neurology. 2003;60:786–790. doi: 10.1212/01.wnl.0000044156.56643.74. [DOI] [PubMed] [Google Scholar]
- Rezai AR, Kopell BH, Gross RE, Vitek JL, Sharan AD, Limousin P, Benabid AL. Deep brain stimulation for Parkinson’s disease: surgical issues. Mov Disord. 2006;21(Suppl 14):S197–218. doi: 10.1002/mds.20956. [DOI] [PubMed] [Google Scholar]
- Rizzone M, Lanotte M, Bergamasco B, Tavella A, Torre E, Faccani G, Melcarne A, Lopiano L. Deep brain stimulation of the subthalamic nucleus in Parkinson’s disease: effects of variation in stimulation parameters. Journal of Neurology, Neurosurgery & Psychiatry. 2001;71:215–219. doi: 10.1136/jnnp.71.2.215. [DOI] [PMC free article] [PubMed] [Google Scholar]
- Sotiropoulos SN, Steinmetz PN. Assessing the direct effects of deep brain stimulation using embedded axon models. J Neural Eng. 2007;4:107–119. doi: 10.1088/1741-2560/4/2/011. [DOI] [PubMed] [Google Scholar]
- Trottenberg T, Winter C, Alesch F, Kupsch A. Risk of tissue damage and deep brain stimulation with external devices: A technical note. Ann Neurol. 2004;56:310–311. doi: 10.1002/ana.20181. [DOI] [PubMed] [Google Scholar]
- Volkmann J, Moro E, Pahwa R. Basic algorithms for the programming of deep brain stimulation in Parkinson’s disease. Mov Disord. 2006;21:S284–S289. doi: 10.1002/mds.20961. [DOI] [PubMed] [Google Scholar]
- Wei XF, Grill WM. Current density distributions, field distributions and impedance analysis of segmented deep brain stimulation electrodes. J Neural Eng. 2005;2:139–147. doi: 10.1088/1741-2560/2/4/010. [DOI] [PubMed] [Google Scholar]