Abstract
Cardiac magnetic resonance (CMR) imaging can provide noninvasive, high resolution images of heart anatomy, viability, perfusion, and function. However, the adoption of clinical CMR imaging protocols for small rodents has been limited due to the small heart size and rapid heart rates. Therefore, most CMR studies in small rodents have been performed on non-clinical high-field MR magnets. Because such high-field systems are not readily available at most institutions, the technical aspects that are needed to perform CMR on clinical 1.5T and 3.0T MR scanners are presented in this paper. Equipment requirements are presented, and a comprehensive description of the methods needed to complete a CMR exam including the animal preparation, imaging, and image analysis are discussed. In addition, the advanced applications of myocardial tagging and delayed-contrast-enhanced imaging are reviewed for the assessment of regional contractile function and myocardial viability, respectively.
1 Introduction
Small rodents (mice and rats) are the most widely used species for animal studies of cardiovascular disease. Transgenic and gene-knockout technologies enable scientists to probe the effect of individual genes or groups of genes on the etiology of a large number of cardiovascular diseases. In addition, surgical models have been developed in these animals that emulate human disease. Pharmaceuticals are being developed based on genetic modulation studies and tested in these rodents to assess efficacy. Noninvasive, accurate measurements of cardiovascular indices (e.g., ventricular volumes, mass, ejection fraction) are desirable for phenotyping and quantitatively evaluating these animals. A primary benefit of magnetic resonance imaging (MRI) is the excellent soft tissue contrast, the ability to image three-dimensional anatomy and function, and a high inter-session reproducibility.
Currently, cardiac magnetic resonance (CMR) imaging is used clinically to assess cardiovascular anatomy, myocardial function, viability, and perfusion. CMR has been used to investigate a variety of disease models (1-5), genetic manipulations (6-13), and even heart development (14). CMR imaging in small rodents is challenging, because clinical scan protocols are not immediately transferable due to small heart size and rapid heart rates in rodents (average heart rate of 300-450 beats/min in rats and 400-600 beats/min in mice). For the most part, CMR studies in rodents have been relegated to non-clinical high field MR magnets (≥ 4.7 Tesla) to provide adequate signal. However, many institutions do not have this equipment available to them. We will focus on recent advances in hardware design and imaging strategies that now make it practical to use clinical scanners for rodent studies.
This paper describes the methods used to perform a cardiac MR exam in small rodents on a clinical-grade scanner, the equipment needed to perform the exam and monitor the animal, and the tools needed to perform an accurate analysis of the cardiac MR images. Basic cine MR imaging methods are described which can be used to evaluate ventricular volumes, mass and global function. We further discuss the advanced CMR applications of myocardial tagging (15, 16) and delayed-contrast enhanced (DCE) imaging (17, 18). Myocardial tagging is used to interrogate the local contractile mechanics of myocardial tissue. For DCE imaging, an exogenous contrast agent, such as Gadolinium DTPA, is administered to enable differentiation of viable and non-viable myocardium (19).
2 Equipment and Materials
2.1 MRI Hardware
This paper focuses on MR experiments performed on scanners at clinical magnetic field strengths, i.e., 1.5T and 3.0T. Because body size and cardiac anatomy are 200-3500 times smaller for rodents than the average person, higher magnetic fields are often sought in small animal imaging to boost the signal-to-noise ratio (SNR). For quantitative cardiac evaluation, rodent imaging must be performed with spatial resolutions that are 5 to 10-fold higher than those in humans. This results in inherent SNR losses of 100-1000%.
To maximize SNR, either small radiofrequency (RF) coils designed specifically for rodent imaging or small commercially available surface RF coils (e.g. carotid artery or wrist coils) must be used. SNR for RF coils drops as a function of the square of the distance between the coil and tissue. Therefore, the RF coil should be sized appropriately to penetrate the distance of the heart in the thorax, but not so large that the SNR profile is not optimal. An example coil designed specifically for small animal imaging at 3T is shown in Figure 1. Although this RF coil was designed by Philips Medical Research, there are many companies that market RF coils for small rodent imaging, e.g. Rapid Biomedical GmbH, Doty Scientific, XLR Imaging Inc., M2M Imaging, and Nova Medical. Each coil is designed to operate at a specific field strength and on a particular MR scanner platform. Custom-built coils generally range in price from $10000-$40000.
Figure 1.
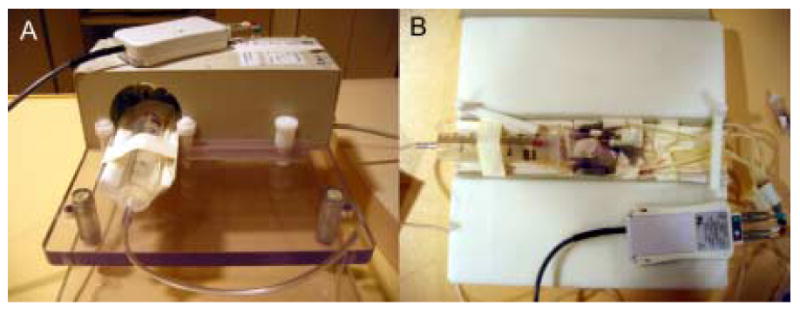
(A) An example radiofrequency (RF) solenoid coil (Philips Research, Hamburg, Germany) specially designed for small rodent imaging. This coil has an inner bore size of 7 cm and a length of 9.7 cm. The animal is placed on the cradle (B) and inserted into the RF coil. In this example, MR-compatible ECG electrodes are attached to the paws of a mouse. Leads are affixed to the electrodes and connected to an electro-optical converting box that converts the ECG signal for fiber optic transmission to the MR scanner. Similar ECG monitoring systems are available on other clinical MR scanners. Third-party, MR-compatible physiological monitoring and gating systems may also be used in place of these ECG monitoring systems. The head of the animal is placed in a nose cone (e.g., 60 cc syringe in A) which supplies inhaled anesthesia to the animal during imaging. If injectable anesthesia is used, no nose cone is necessary. Clinical surface coils, such as those developed for imaging human carotid artery, also work well for small rodent CMR, as they are designed to image at penetration depths similar to that of small rodent hearts in vivo.
Moreover, the strength and speed of the gradient coils are important in CMR imaging of rodents. To achieve the high spatial resolutions without substantial image degradation due to cardiac motion, the MR scanner must have strong and fast switching gradients. Using a 3.0T MR scanner (Philips Achieva, Best, Netherlands) equipped with state-of-the-art gradients (maximum gradient strength of 80 mT/m and maximum gradient speed of 200 mT/m/ms), cardiac imaging at in-plane resolutions of ∼200 μm can be achieved. Similar gradient specifications are adequate for imaging at 1.5T scanners. An alternate strategy is to develop specialized gradient coil inserts with custom RF coils that can achieve faster slew rates and higher maximum gradient strengths (20).
2.2 Animal Preparation and Monitoring
Animal preparation and physiological monitoring are necessary components of a CMR examination. Studies have been performed using several anesthetics, but inhaled anesthetics, such as isoflurane, have been shown to be most effective for maintaining sedation throughout the CMR exam without significant effects on cardiac function (21, 22). In general, animals are induced in a closed container using 3-5% isoflurane. During the experiments, anesthesia is maintained at 0.5-1.5% isoflurane in O2 at a flow rate of 1-1.5 mL/min using a nose cone or via intubation with an intravenous catheter.
Following induction, the animal is placed on a specially-designed cradle for imaging (Figure 1). Although a cradle is not necessary, it is useful for controlling the set-up and helps with reproducible positioning. The design of cradles may vary, but the basics are as follows. The cradle should be appropriately sized for the animal being imaged. It should be equipped with a nose cone that has an inlet for maintenance of anesthesia. The cradle should also be designed to accommodate the RF coil discussed in the previous section and leads for monitoring the electrocardiogram (ECG).
Because the core body temperature falls while under anesthesia, it is important to monitor and maintain body temperature. Temperature monitoring can be done using an MR-compatible rectal probe. Temperature maintenance can be accomplished by integrating a low flow water-based heating blanket or pad into the cradle or by blowing hot air over the animal. An MR-compatible temperature monitoring and heating system is commercially available for small rodent MRI that can regulate temperature variations less than 0.1°C (SA Instruments, Inc, Stony Brook, NY).
The basic image acquisition in a CMR exam employs gating to the R-wave of the ECG to capture images at different phases of the cardiac cycle. In order to freeze cardiac motion, imaging time is kept short and multiple heart cycles are used to acquire each image. Therefore, obtaining a strong ECG signal is extremely important. Pediatric and adult electrodes can be adapted for use in mice or rats by wrapping the electrodes firmly around the paws of the animals. MR-compatible ECG electrodes are recommended, particularly since the ECG signal is often inherently degraded by the magnetohydrodynamic effect (23), RF pulses (24), and gradient switching (25) during imaging. ECG monitoring and gating is possible using equipment available with most MR scanners, but its quality and accuracy can vary as this equipment was not originally designed for small animal imaging. MR-compatible monitoring and gating systems (e.g., Model 1025 System, SA Instruments, Inc, Stony Brook, NY), developed specifically for small rodent imaging to account for the low amplitude of the ECG signal and the high heart rates, are available and have been shown to be beneficial for improved ECG gating. These are stand-alone systems equipped with acquisition and control modules that run on standard PCs and communicate with the MR scanner for gating. These systems are not necessary for small rodent CMR imaging but may prove useful. MR-compatible physiological monitoring/gating systems range in price from $8000-$22000 depending on the features chosen. Alternatively, the high heart rates in mice often exceed the maximum allowable heart rate on standard clinical scanners, necessitating specialized hardware to either divide the heart rate by 2-4-fold or software modifications to enable clinical scanners to recognize these high heart rates.
Because ECG gating only compensates for cardiac motion, respiratory motion can cause artifacts in CMR. Standard clinical CMR exams will use breath-holding techniques to suppress respiratory motion. However, these techniques are not possible in small rodents. Pneumatic pillows have been developed specifically for respiratory gating in rodents during an MR exam (SA Instruments, Inc., Stony Brook, NY), but signal averaging works well, too.
3 Cardiac Magnetic Resonance Imaging Exam
Cardiac MRI is usually performed using a coordinate system based on the ellipsoidal geometry of the heart with preference given to the left ventricle. Specifically, the local coordinate system of the heart used for CMR imaging is defined such that the main axis or “long axis” extends from the base of the heart through the central compartment of the left ventricle (LV) down to its apex. Imaging planes along this axis are often oriented for a 4-chamber view (bisecting the septum) and a 2 chamber view (left atrium and left ventricle parallel to the septum). The most frequently used view is that of the “short axis plane”, which is oriented perpendicular to the long axis and shows the left ventricle as an annulus in a healthy heart. Because these views are oblique to the physical coordinate system of the magnet and the animal, it is necessary to perform survey or scout imaging to determine the proper slice orientations for these views.
Prior to imaging, it is important to position the animal and cradle at the isocenter of the magnet with the RF coil in place. Care should be taken to position the animal such that there is easy access to anesthesia lines, ECG leads, etc. For clinical scans, centering of the patient is often performed in the head-foot and left-right directions and assumed in the anterior-posterior direction. Because rodents are much smaller than humans, it is important to ensure that they are also properly positioned in the anterior-posterior or up-down direction of the magnet. Image quality is best when performed in the isocenter of the magnet where field homogeneity is optimized.
At the beginning of a CMR exam, scout or survey images must be used to determine the local coordinate system of the heart. Scout imaging is usually performed by acquiring low-resolution, multi-planar images (Figure 2) with a multi-slice, segmented, spoiled gradient echo (GRE) pulse sequence. These multi-planar images are acquired as stacks of 4-10 images oriented with respect to the physical coordinate system (e.g., axial, coronal, and sagittal) with a slice gap of 0-1.5 mm. The scan can be performed with or without ECG gating. The field of view (FOV) for scout images is chosen to encompass the full dimensions of the animal's body (e.g. 5-20 cm). Multi-planar, multi-slice GRE pulse sequences for survey imaging are readily available on all clinical MR scanners. Standard scan preparation, including automatic shimming, can be used for most small rodent cardiac MR exams. However, if large inhomogeneities are observed in images, manual shimming may be required. These advanced shimming techniques are unique to each scanner platform; therefore, assistance should be sought from the individual managing the system or other individuals familiar with manual shimming on the magnet.
Figure 2.
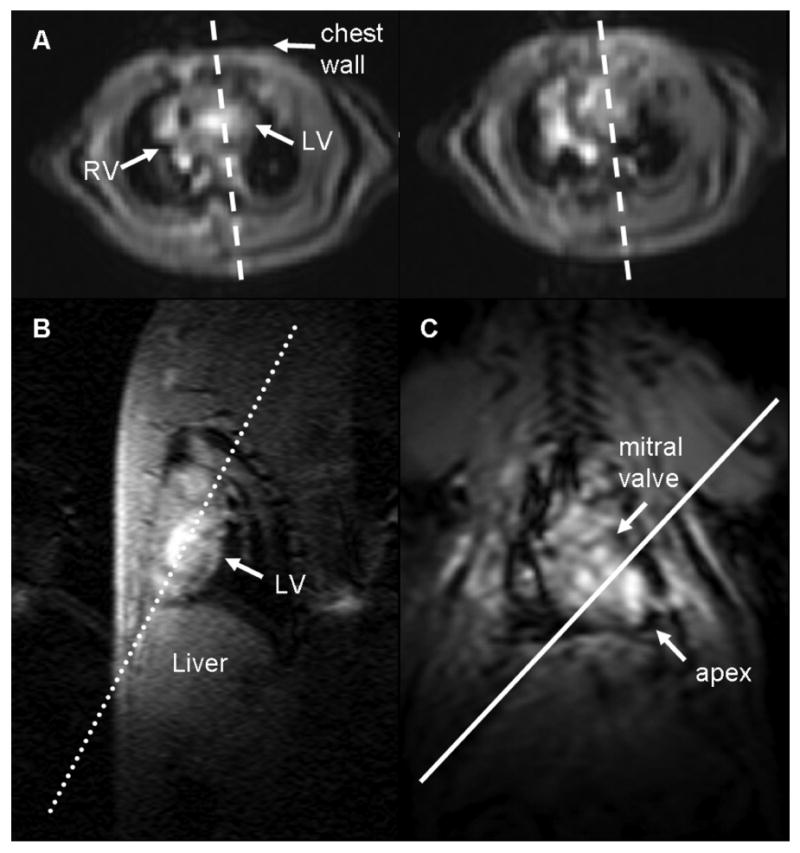
Low-resolution scout images are acquired to determine the imaging planes that define the local coordinate system of the heart. (A) Axial images of the heart at the base (left) and at the mid-ventricle (right) are used to plan (dashed lines) a pseudo-long axis image by orienting the slice plane such that it passes through the chamber of the left ventricle on both images. The pseudo-long axis image (B) is used to plan a double oblique long axis (dotted line) perpendicular to this image and along the length of the left ventricle. The resulting image (C) is that of a “true” long axis. The local coordinate system of the heart is now defined, and higher resolution images of the heart in the short axis and long axis views can be acquired. The solid white line perpendicular to the double oblique long axis scout image defines the short axis of the heart parallel to the mitral valve plane.
The short axis and long axis planes can be prescribed from the multi-planar scout images through a series of steps. Select an axial image at the base of the heart and at the mid-ventricle of the heart (Figure 2A). Identify the LV chamber and prescribe a perpendicular imaging slice that passes through the middle of the LV chamber in both slices. Repeat scout imaging using a single slice acquisition to obtain a pseudo-long axis image (Figure 2B). Using the pseudo-long axis image, prescribe a perpendicular slice oriented along the length of the LV chamber as shown in Figure 2B. Repeat the single scout image acquisition to obtain a double oblique long axis image (Figure 2C). A short axis image can then be prescribed using an imaging plane perpendicular to this long axis image and parallel to the mitral valve plane. The left ventricle appears as a circular ring in the short axis view, and the right ventricle attaches at two points on the anterior and inferior walls to form a crescent (Figure 3A,D). A four-chamber long axis view can be prescribed by orienting a plane perpendicular to a mid-ventricular short axis image that passes through the center of the LV chamber and the lateral-most point of the crescent-shaped right ventricular free wall, as shown in Figure 3B,E. Similarly, a two-chamber long axis view can be obtained by orienting a plane perpendicular to a mid-ventricular short axis image that passes through the center of the LV chamber parallel to the septal wall (Figure 3C,F).
Figure 3.
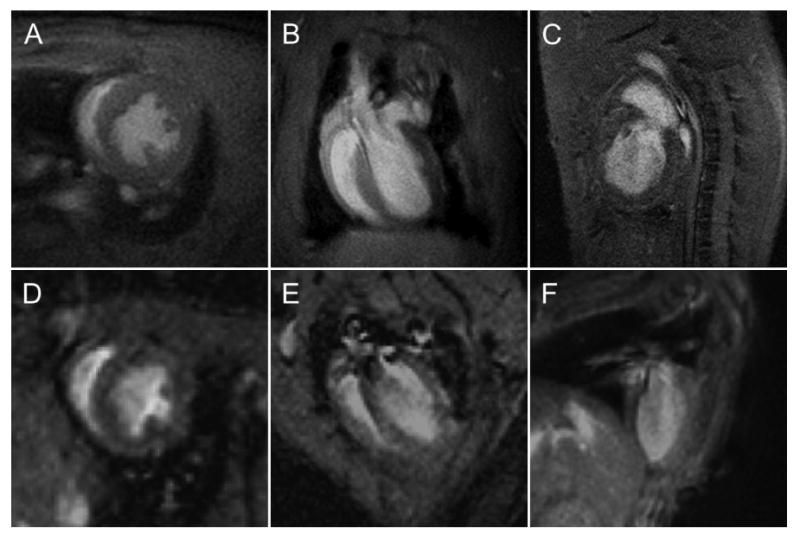
Representative short-axis (A, D) and long axis four-chamber (B, E) and long axis two-chamber (C, F) MR images of rat (A-C) and mouse (D-F) hearts. These images were acquired using a gradient echo pulse sequence on a 3T MR scanner (Philips Achieva, Best, Netherlands) at an in-plane resolution of 0.23 × 0.23 mm2. The thickness of the imaging slice was 2 mm for the rat images and 1 mm for the mouse images.
With the short and long-axis imaging planes determined, a CMR exam can be performed. The comprehensive imaging protocol presented in this paper is confined to cine imaging, myocardial tagging, and delayed enhancement imaging, which are used to quantify global function and anatomy, regional contractile function, and myocardial viability, respectively.
3.1 Cine Imaging
Cine imaging is the most commonly used technique in CMR. For small rodent imaging, a spoiled GRE pulse sequence designed to acquire multiple heart phases for a single imaging slice has proven to be effective. Because the heart rate in small rodents is so rapid, segmented k-space acquisitions, commonly used in clinical imaging, must be modified. Steady-state free precession imaging (26) has recently been adopted for clinical cine imaging, because it achieves high SNR and excellent contrast between myocardium and the blood pool; however, this technique has yet to be modified for small rodent imaging. Furthermore, black-blood cine imaging was recently reported in mice (27), but this technique has not been implemented on any clinical scanners, yet. Spiral imaging has recently been demonstrated for small rodent CMR (28). It offers inherent flow compensation and can yield an increased SNR, but spiral imaging is not available on all MR imaging platforms.
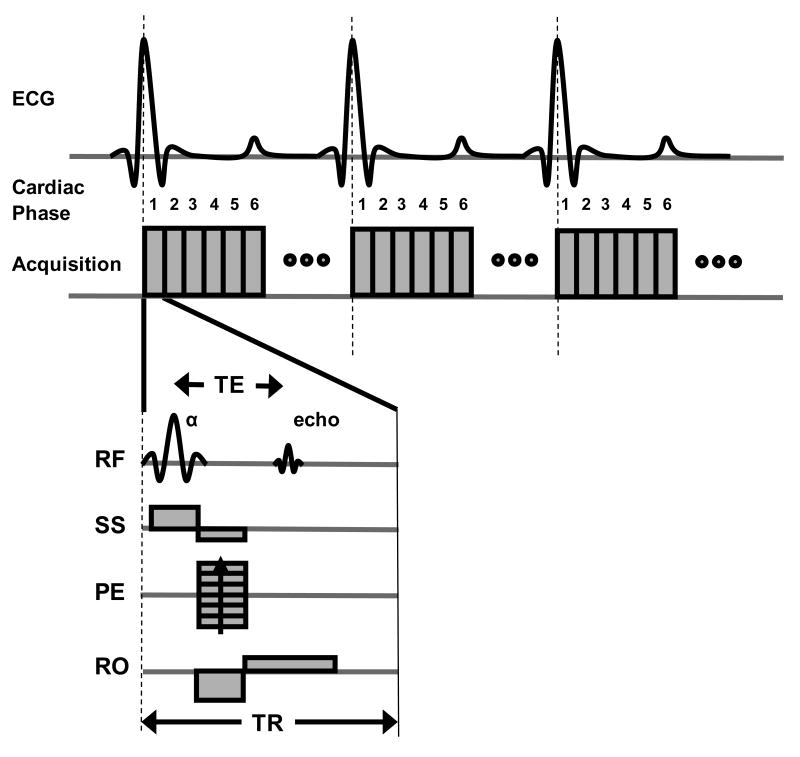
The basic design of a cine MRI acquisition is shown in Figure 4. After the R-wave trigger pulse, a series of images are acquired at different phases in the cardiac cycle. For each individual acquisition, a single line of signal (or k-space) is acquired. Since only a single line of the image can be acquired for each image during a heart beat, multiple heart beats are necessary to form a complete image. The number of heart beats per slice acquisition corresponds to the number of phase encoding steps. Oftentimes, signal averaging is used to enhance the SNR and reduce motion artifacts. The acquisition time is increased linearly with the number of signal averages. However, the SNR only improves by a factor of the square root of the number of signal averages. Signal averaging can also be used to minimize motion artifacts due to respiratory motion.
Figure 4.
A timing diagram for a cine MRI acquisition using a spoiled gradient echo (GRE) pulse sequence gated to the R-wave of the ECG signal. For the GRE sequence diagram (bottom), RF refers to the radiofrequency signal and shows both the excitation pulse (α) and the resulting MR signal or echo. Slice-select (SS), phase encode (PE), and readout (RO) gradients are used to selectively acquire the signal for a two-dimensional imaging slice. The echo time (TE) is a standard MRI parameter defined as the time between the excitation flip angle and the MR signal. The repetition time (TR) is the time between excitation RF pulses and determines the temporal resolution. Individual images are acquired at different phases (e.g. 1,2,3,4,5,6,…) of the cardiac cycle. The maximum number of cardiac phases that can be acquired is determined by the TR and the time interval between R waves of consecutive heart beats. The phase encoding gradient is incremented over multiple heart beats to acquire a complete image.
An example spoiled GRE pulse sequence is shown in Figure 4. The sequence consists of a RF pulse that excites the magnetization and gradient waveforms that spatially modulate the magnetization for image acquisition. Two timing parameters are important in GRE imaging, the repetition time (TR) and echo time (TE). These times are generally chosen to be as short as possible to improve the temporal resolution and allow more heart phases to be captured during the cardiac cycle. The flip angle of the excitation RF pulse used to acquire the image is normally between 15-20°. A single slice acquisition can generally be obtained in 1-3 minutes, depending on relevant imaging parameters (i.e., matrix size and number of signal averages). The imaging time can be estimated by multiplying the time duration of the R-R interval of the ECG with the image matrix size and the number of signal averages.
Representative mid-ventricular short-axis images from a cine MRI acquisition are shown in Figure 5. In spoiled GRE images, the blood pool appears bright and the myocardium dark. The clear border definition between the blood pool and the myocardial tissue enables cine MRI to be an accurate technique for measuring ventricular volumes and mass.
Figure 5.
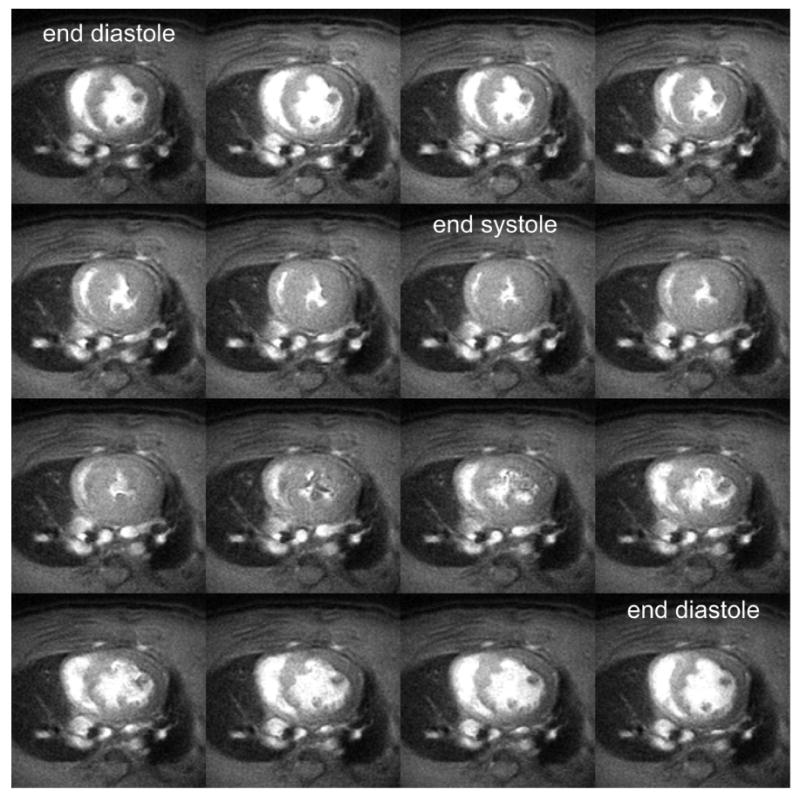
Mid-ventricular short-axis cine MR images acquired throughout the cardiac cycle in a rat on a 3T MR scanner. The blood pool appears bright and the myocardial tissue dark. The end diastolic and end systolic frames are labeled. Ventricular volumes and mass can be computed from these images by summing the volumes from all the slices spanning the left ventricle. The imaging parameters include: 7.5 ms repetition time; 2.8 ms echo time; and a 20° flip angle. A 90 mm field of view, 400 × 400 imaging matrix, and 2 mm slice thickness was used yielding a spatial resolution of 0.23 × 0.23 × 2 mm3.
3.2 Myocardial Tagging
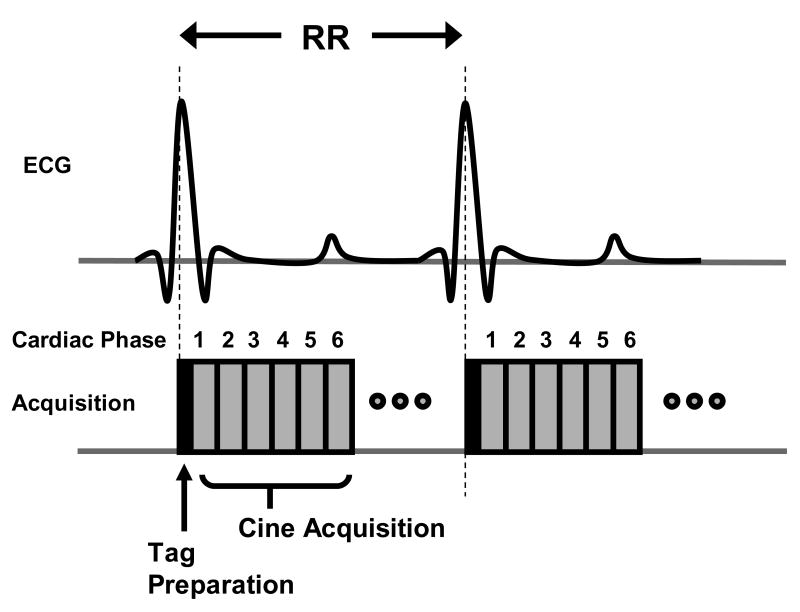
Myocardial tagging is a technique unique to MRI that can noninvasively quantify intramyocardial tissue mechanics. The pulse sequence design uses a series of RF pulses and gradients to modulate the MR signal in such a way that the local proton magnetization is saturated in the MR image. This local magnetization saturation is temporary and is designed to “burn” a pattern of lines or a grid into the tissue. With cardiac contraction, the lines or grid will bend, which can be used to determine the deformation of the heart. Since the saturation is directly related to the tissue magnetization, cine imaging can be used following the tagging preparation. This magnetization preparation is typically performed immediately following the R-wave trigger, just prior to a cine acquisition (as shown in Figure 6).
Figure 6.
A timing diagram for a myocardial tagging pulse sequence. Myocardial tagging is performed by applying a series of radiofrequency (RF) pulses and gradients immediately after the R-wave trigger. These RF pulses and gradients act to create a temporary tagging pattern into the tissue. Following this tag preparation, multi-phase images are acquired throughout the cardiac cycle, as described previously for cine imaging. The tag preparation is repeated at every R-wave trigger prior to cine acquisition.
Representative myocardial tagged images are shown in Figure 7. In this example, two separate acquisitions were performed with tag lines oriented in orthogonal directions. Tag preparation was performed at end diastole immediately following of the R-wave trigger pulse. Therefore, the tag lines are parallel to each other in the end-diastolic images. Throughout the heart cycle, different phases of the heart are imaged as the tag lines deform with the contraction of heart. Maximal deformation occurs at end systole, as shown in Figure 7. By imaging deformation in the orthogonal directions, in-plane myocardial mechanics can be measured. All of the major vendors have a myocardial tagging pulse sequence available with their cardiac imaging package.
Figure 7.
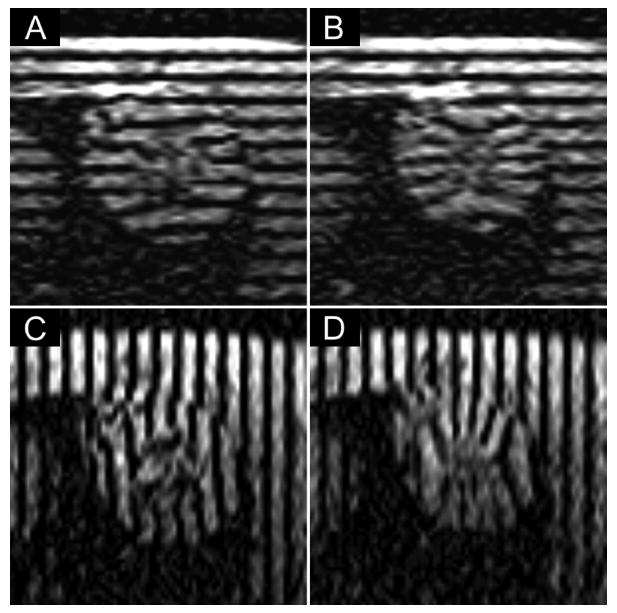
Representative mid-ventricular short-axis myocardial tagged images from a rat at end diastole (A,C) and end systole (B,D). Two separate acquisitions were performed with tag lines oriented horizontally (A,B) to capture motion in the up-down direction and vertically (C,D) to capture motion in the left-right direction. Imaging parameters included: 11.7 ms repetition time; 5.3 ms echo time; 15° flip angle; 90 mm field of view; 1 mm slice thickness; 256 × 256 imaging matrix; 0.35 × 0.35 × 1 mm3 spatial resolution; 3 signal averages; and 1.5 mm tag spacing. The images were acquired at 1.5T.
In general, line tagging is preferred to grid tagging for small rodent imaging, because the preparation time for grid tagging is almost twice as long as line tagging. Since the heart rate of small rodents is so rapid, the increased time one spends preparing the magnetization for grid tagging results in more temporal blurring and delays the tag preparation from true end diastole. An important parameter to consider is the distance between tag lines. In general, tag line separation should be 5-8 times the image resolution [i.e. if the in-plane image resolution is 0.2 mm × 0.2 mm, then the tag line distance is 1-1.6 mm]. Total imaging time for myocardial tagged images is similar to a cine MRI acquisition but may be slightly longer if using more signal averages.
3.3 Delayed Enhancement Imaging
Delayed contrast-enhancement imaging is used clinically to differentiate viable and non-viable myocardial tissue. DCE imaging uses exogenous contrast agents, such as gadolinium-based chelates or manganese, which shorten the T1 (spin-lattice) relaxation time of the tissue. As in clinical imaging (18, 29), T1-weighted images are acquired 10-30 minutes after contrast injection to detect non-viable myocardium (30-33), which appears hyperintense.
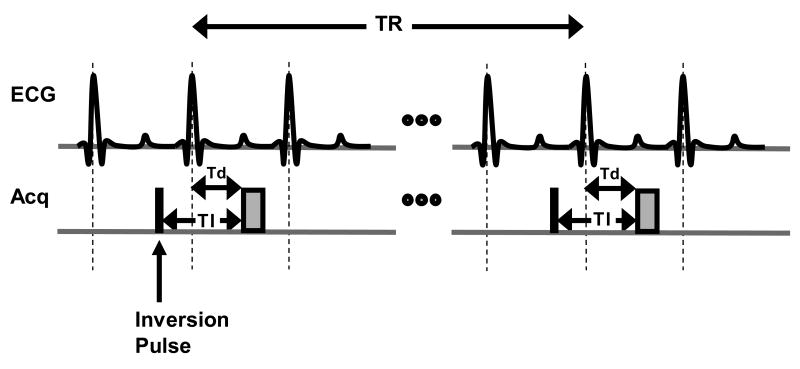
For DCE imaging in rodents, the contrast agent is usually delivered via the tail vein (31). However, excellent results have also been reported using a peritoneal injection of gadolinium DTPA (32). DCE is frequently performed using an inversion recovery (IR) GRE pulse sequence. The basic acquisition scheme for DCE imaging is shown in Figure 8. Prior to image acquisition, an inversion RF pulse is applied which inverts the tissue magnetization. The magnetization recovers at a rate corresponding to the T1 of the tissue. By timing the image acquisition to match the time at which the magnetization of the normal myocardium transitions from negative to positive, i.e. magnetization equals zero, an image can be generated that has maximum contrast between viable and non-viable myocardium. For DCE imaging, the time between the IR pulse and the image acquisition is referred to as the inversion time (TI). The optimal TI for DCE imaging can vary with the contrast agent used, the concentration used, and the field strength of the magnet but is normally between 200 and 400 ms. Proper selection of TI is important as the contrast of the image can vary significantly based on the choice of TI (34). A recommended concentration for intravenous injections of gadolinium DTPA in rodents is 0.1-0.2 mmol/kg. Unlike cine imaging, a large flip angle (e.g. 90°) should be used to obtain maximum signal per acquisition and a long TR of 2-3 times the T1 of normal myocardium (∼850 ms at 1.5T and ∼1100 ms at 3.0T) is adequate. Because of the long TR, the total time needed to acquire a DCE image with an adequate spatial resolution is 6-10 minutes. To maximize coverage of the heart, a multi-slice acquisition may be used.
Figure 8.
A simple timing diagram demonstrating an inversion recovery (IR) spoiled gradient echo sequence for delayed contrast-enhanced imaging. A non-selective inversion pulse (black box) is applied at a time TI prior to the image acquisition (gray box) in mid diastole. A long TR between 2-3 times the T1of normal myocardium should be chosen to allow sufficient recovery of the inverted magnetization. The trigger delay Td (time after the R-wave trigger at which image acquisition occurs) can be determined by visually examining the cine MR images to find an appropriate time in the cardiac cycle with minimal motion. Because a non-selective inversion pulse is used, a multi-slice image acquisition can be used to maximize imaging efficiency and allow fuller coverage of the heart.
Recently, saturation recovery (SR) GRE pulse sequences have been used for DCE imaging to acquire these images faster. In such cases, no inversion RF pulse is used. Instead, a 90° excitation flip angle and a short TR (i.e., equal to a single R-R cycle) are used and inherently produce T1-weighted images by saturating the normal myocardial signal. The contrast-to-noise ratio (CNR) in SR DCE imaging will be lower than with IR DCE imaging, but SR DCE imaging offers a substantial savings in image acquisition time.
A representative IR DCE image of a rat following permanent occlusion of the left anterior descending coronary artery is shown in Figure 9, following intravenous injection of 0.01 mmol/kg gadolinium DTPA (Optimark, Mallinckrodt Inc., Hazelwood, MO). Hyperenhancement is clearly visualized in the anterior and posterior left ventricular walls corresponding to infarcted myocardium. This delayed hyperenhancement has been shown to directly correspond to infarcted myocardium (19, 32). Delayed hyperenhancement has also been observed in association with myocarditis (35) and myocardial fibrosis (36, 37).
Figure 9.
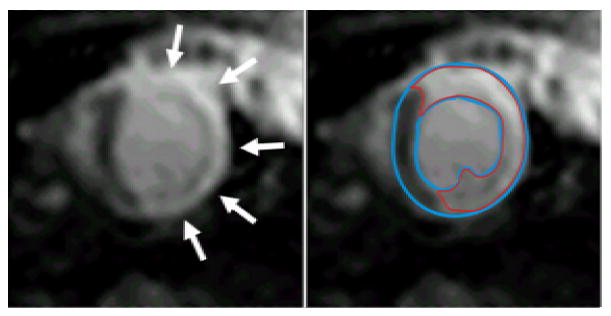
A representative short-axis delayed contrast-enhanced (DCE) image (left & right) in a rat acquired at 1.5T. The bright hyperenhanced region (arrows, left) corresponds to non-viable or infarcted myocardium. Following planimetry (right) of the epicardial and endocardial border (blue lines), the hyperenhanced region (red) can be segmented using full-width half-maximum criteria. By summing the volumes of the hyperenhanced regions from a stack of short-axis slices covering the left ventricle, the infarct size can be determined as a percentage of the total left ventricular mass. Additional evaluations can be performed to assess infarct transmurality and circumferential extent. For this image acquisition, a 0.1 mmol/kg bolus of gadolinium DTPA was injected intravenously in a tail vein and the imaging parameters were: 2.5 ms echo time; 90° flip angle; 0.7 × 0.7 × 2 mm3 spatial resolution; and 330 ms inversion time. This analysis was performed using the Cinetool program (GE Healthcare) but can be performed using other commercially available software.
4 Data Analysis
4.1 Volume Analysis
Using the cine MR images, LV volumetric measurements such as end-diastolic volume (EDV), end-systolic volume (ESV), stroke volume (SV) and LV mass can be computed, as well as indices of global ventricular function such as ejection fraction (EF) and cardiac output (CO). For each slice and each cardiac phase in the short-axis data set, the epicardial and endocardial borders are traced, as demonstrated in Figure 10. LV chamber volumes are computed by summing the areas of the endocardial segments for each slice at each cardiac phase and multiplying by the slice thickness. EDV is the ventricular volume of the slice with the largest volume prior to systolic contraction. By plotting the ventricular volume and cardiac phase, the ESV can be determined. SV is EDV – ESV. Myocardial mass is determined by summing the differences between the planimetered epicardial area and endocardial area, multiplying by the slice thickness to determine myocardial tissue volume, and multiplying by the density of myocardial tissue (1.05 g/cm3). Myocardial mass should be conserved through the cardiac phases and is commonly determined using volumes from the first cardiac phase. EF is defined as SV/EDV × 100% and CO is SV × heart rate. All of these analyses can be performed using commercially available software. All of the major vendors have cardiac MR image analysis packages available with their scanners. Independent, free software packages (e.g., Segment, http://segment.heiberg.se) are also available.
Figure 10.
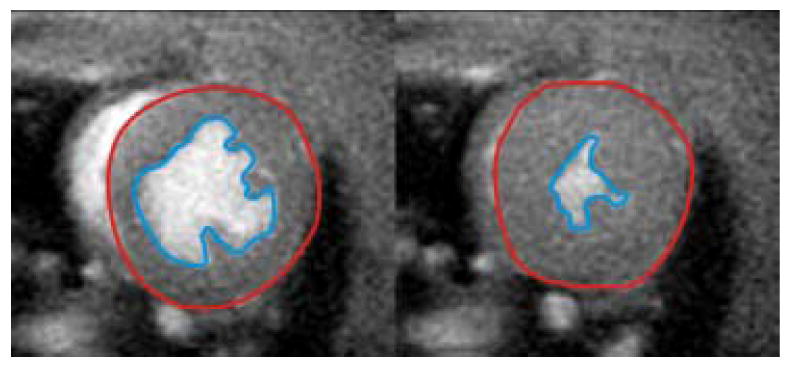
Representative mid-ventricular short-axis images from a cine gradient echo acquisition at end diastole (left) and end systole (right). Planimetry of the epicardial (red line) and endocardial (blue line) walls for all slices spanning the left ventricle can be used to quantify end-diastolic volume, end-systolic volume, stroke volume, ejection fraction, myocardial mass, and cardiac output. In this example, the Cinetool program (GE Healthcare) was used to planimeter and compute ventricular volumes, but the analysis can be performed using other commercially available image analysis software.
4.2 Regional Contractile Function Analysis
Although global function indices such as EF are most commonly used, studies on LV remodeling (38, 39) and hypertrophic cardiomyopathy (40-42) have demonstrated regional heterogeneity of contractile function that are more easily detected by myocardial tagging. However, myocardial tagging image analysis is more complex than volumetric analysis. Approaches to tag analysis include detecting and tracking intersection points of the tagging grid (43, 44), detecting and tracking the contour lines (45), and phase contrast motion tracking (46, 47). In November 2006, the harmonic phase (HARP) analysis package (Diagnosoft, Inc., Palo Alto, CA) became the first FDA-approved software for analysis of myocardial tagged images. Depending on the features selected, the cost of this software ranges from $5000-$36000.
An example of myocardial tag analysis using the HARP software is shown in Figure 11 using mid-ventricular short-axis tagged images from a rat. In this example, orthogonally-oriented line tagged image data sets (as shown in Figure 7) were combined to form grid tags (Figure 11A). A mesh was created to segment the myocardium. Using a phase contrast motion mapping algorithm (47), tissue displacement and strain can be computed from the tagged images. The circumferential component of Lagrangian strain is shown in Figure 11A. Using regional analysis, the mean transmural Lagrangian strain in the anterior wall of the left ventricle was evaluated over the cardiac cycle and is shown in Figure 11B.
Figure 11.
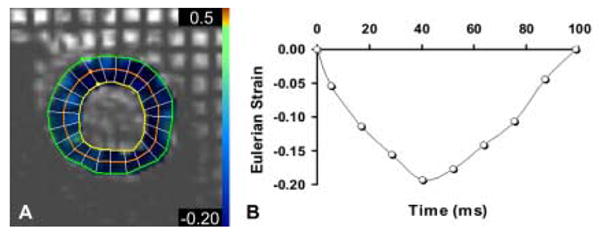
Eulerian strain can be computed from orthogonal tagged images to quantify contractile function. The Harmonic Phase (HARP) analysis program (Diagnosoft, Palo Alto, CA) was used to compute a strain map (A, color overlay) from mid-ventricular short-axis tagged images (A) and shows the circumferential component of Eulerian strain at end systole for a normal rat. Normal contraction appears blue in the overlay. The temporal evolution of circumferential strain in the lateral mid-wall throughout the course of a single heart beat is shown in the graph (B). The more negative the strain, the greater the contraction. These measurements can be used to quantify regional differences in myocardial contractile function.
4.3 Myocardial Viability
Multiple studies have shown that regions of hyperenhancement in delayed contrast-enhanced (DCE) MR images correspond to non-viable myocardium (18, 19, 29, 30, 32, 33). When performing delayed enhancement imaging, the goal is to suppress the signal from the viable myocardial tissue while maximizing the signal from contrast agent that temporarily resides in the non-viable myocardium.
To quantify the volume of non-viable myocardium (i.e. infarct size), we use a custom research analysis software (Cinetool, GE Healthcare, Waukesha, WI). Most of the cardiac MR analysis packages mentioned previously are also capable of obtaining this measurement. Similar to volume analysis, the endocardial and epicardial borders of short-axis DCE images are planimetered. Segmenting these borders can be difficult, because the viable myocardial tissue signal has been suppressed and hyperenhanced regions along the endocardial border may be difficult to differentiate from the blood pool. End-diastolic images from the cine MRI used for volumetric analysis can be used to guide planimetry, if necessary. For each short-axis DCE image spanning the LV, a region of interest (ROI) is selected in the non-enhanced viable myocardium. The full-width half-maximum criterion (48), constrained to within the endocardial and epicardial borders, is used to segment the hyperenhanced non-viable myocardium. The total infarct volume is computed by summing the volumetric ROIs from each slice, and the infarct size is reported as a percentage of the total LV mass. An example of this analysis is shown in Figure 9. Furthermore, the transmural extent of the infarct across the LV can be determined using centerline projections (49), and the circumferential extent of the infarct for individual slices can be computed by measuring the angle subtended by the edges of the hyperenhanced region using the center of the LV blood pool as a focal point.
5 Concluding Remarks
Small rodent cardiac imaging on clinical-grade 1.5T and 3.0T MR scanners is challenging. Clinical scanners are designed to image humans who are > 1000 times larger in size and have heart rates 5-10 times slower. Historically, most rodent imaging has been performed on MR scanners with field strengths ≥ 4.7T with gradients and coils specially designed for rodent imaging. However, these scanners are not readily available at most institutions and can be expensive investments. This paper was written to provide a framework by which small rodent cardiac MRI experiments can be performed using clinical scanners.
There are several key items to consider when performing CMR in small rodents. Good ECG gating is a necessity. For accurate measurements, body temperature and anesthesia should be monitored and maintained. Higher static magnetic field strengths inherently yield higher SNR images. RF coils designed specifically for or, at least, appropriately sized for small rodent cardiac imaging are required to obtain high SNR images. Signal averaging is an effective means for increasing image SNR and minimizing motion artifacts at the expense of increasing the total time of image acquisition. Increasing the slice thickness can also be used to increase SNR, but care should be taken as this may lead to undesirable partial volume effects.
In addition to the development of gradient coil inserts (20) that can improve imaging resolution, there is much interest in improving the throughput of imaging experiments. As a result, multiple mouse cardiac imaging has been proposed (50, 51) with retrospective ECG gating being used (52) to account for different heart rates between animals. Several groups have begun developing hardware and software (pulse sequences) for improved cardiac imaging in rodents.
In conclusion, cardiac MRI is a valuable imaging modality for noninvasively studying cardiovascular diseases in small rodents. Continued development of hardware and software for imaging rodents will be valuable in making CMR a necessary tool for studying the wide variety of genetic and surgical rodent models of heart disease.
Acknowledgments
The authors would like to thank Drs. Matthias Stuber, Michael Schär and Christine Lorenz for their thoughtful discussion and assistance with image acquisition. We would also like to thank Drs. Roselle Abraham and John Terrovitis for help with rodent imaging. Finally, we would like to acknowledge grant support for our laboratory from the National Heart, Lung, and Blood Institute at the National Institutes of Health (R01-HL073223).
Footnotes
Publisher's Disclaimer: This is a PDF file of an unedited manuscript that has been accepted for publication. As a service to our customers we are providing this early version of the manuscript. The manuscript will undergo copyediting, typesetting, and review of the resulting proof before it is published in its final citable form. Please note that during the production process errors may be discovered which could affect the content, and all legal disclaimers that apply to the journal pertain.
References
- 1.Ross AJ, Yang Z, Berr SS, Gilson WD, Petersen WC, Oshinski JN, French BA. Magn Reson Med. 2002;47:1158–1168. doi: 10.1002/mrm.10166. [DOI] [PubMed] [Google Scholar]
- 2.Naumova AV, Chacko VP, Ouwerkerk R, Stull L, Marban E, Weiss RG. Am J Physiol Heart Circ Physiol. 2006;290:H837–843. doi: 10.1152/ajpheart.00831.2005. [DOI] [PubMed] [Google Scholar]
- 3.Slawson SE, Roman BB, Williams DS, Koretsky AP. Magn Reson Med. 1998;39:980–987. doi: 10.1002/mrm.1910390616. [DOI] [PubMed] [Google Scholar]
- 4.Nahrendorf M, Hiller KH, Theisen D, Hu K, Waller C, Kaiser R, Haase A, Ertl G, Brinkmann R, Bauer WR. Radiology. 2002;225:487–493. doi: 10.1148/radiol.2252011325. [DOI] [PubMed] [Google Scholar]
- 5.Jones JR, Mata JF, Yang Z, French BA, Oshinski JN. J Cardiovasc Magn Reson. 2002;4:317–326. doi: 10.1081/jcmr-120013297. [DOI] [PubMed] [Google Scholar]
- 6.Bove CM, Gilson WD, Scott CD, Epstein FH, Yang Z, Dimaria JM, Berr SS, French BA, Bishop SP, Kramer CM. J Cardiovasc Magn Reson. 2005;7:459–464. doi: 10.1081/jcmr-200053461. [DOI] [PubMed] [Google Scholar]
- 7.Yang Z, Bove CM, French BA, Epstein FH, Berr SS, DiMaria JM, Gibson JJ, Carey RM, Kramer CM. Circulation. 2002;106:106–111. doi: 10.1161/01.cir.0000020014.14176.6d. [DOI] [PubMed] [Google Scholar]
- 8.Wiesmann F, Ruff J, Engelhardt S, Hein L, Dienesch C, Leupold A, Illinger R, Frydrychowicz A, Hiller KH, Rommel E, Haase A, Lohse MJ, Neubauer S. Circ Res. 2001;88:563–569. doi: 10.1161/01.res.88.6.563. [DOI] [PubMed] [Google Scholar]
- 9.Voros S, Yang Z, Bove CM, Gilson WD, Epstein FH, French BA, Berr SS, Bishop SP, Conaway MR, Matsubara H, Carey RM, Kramer CM. Am J Physiol Heart Circ Physiol. 2006;290:H1004–1010. doi: 10.1152/ajpheart.00886.2005. [DOI] [PubMed] [Google Scholar]
- 10.Franco F, Dubois SK, Peshock RM, Shohet RV. Am J Physiol. 1998;274:H679–683. doi: 10.1152/ajpheart.1998.274.2.H679. [DOI] [PubMed] [Google Scholar]
- 11.Franco F, Thomas GD, Giroir B, Bryant D, Bullock MC, Chwialkowski MC, Victor RG, Peshock RM. Circulation. 1999;99:448–454. doi: 10.1161/01.cir.99.3.448. [DOI] [PubMed] [Google Scholar]
- 12.Nahrendorf M, Streif JU, Hiller KH, Hu K, Nordbeck P, Ritter O, Sosnovik D, Bauer L, Neubauer S, Jakob PM, Ertl G, Spindler M, Bauer WR. Am J Physiol Heart Circ Physiol. 2006;290:H2516–2521. doi: 10.1152/ajpheart.01038.2005. [DOI] [PubMed] [Google Scholar]
- 13.Bove CM, Yang Z, Gilson WD, Epstein FH, French BA, Berr SS, Bishop SP, Matsubara H, Carey RM, Kramer CM. Hypertension. 2004;43:680–685. doi: 10.1161/01.HYP.0000115924.94236.91. [DOI] [PubMed] [Google Scholar]
- 14.Wiesmann F, Ruff J, Hiller KH, Rommel E, Haase A, Neubauer S. Am J Physiol Heart Circ Physiol. 2000;278:H652–657. doi: 10.1152/ajpheart.2000.278.2.H652. [DOI] [PubMed] [Google Scholar]
- 15.Axel L, Dougherty L. Radiology. 1989;172:349–350. doi: 10.1148/radiology.172.2.2748813. [DOI] [PubMed] [Google Scholar]
- 16.Zerhouni EA, Parish DM, Rogers WJ, Yang A, Shapiro EP. Radiology. 1988;169:59–63. doi: 10.1148/radiology.169.1.3420283. [DOI] [PubMed] [Google Scholar]
- 17.Lima JA, Judd RM, Bazille A, Schulman SP, Atalar E, Zerhouni EA. Circulation. 1995;92:1117–1125. doi: 10.1161/01.cir.92.5.1117. [DOI] [PubMed] [Google Scholar]
- 18.Simonetti O, Kim R, Fieno D, et al. Radiology. 2001;218:215–223. doi: 10.1148/radiology.218.1.r01ja50215. [DOI] [PubMed] [Google Scholar]
- 19.Kim RJ, Fieno DS, Parrish TB, Harris K, Chen EL, Simonetti O, Bundy J, Finn JP, Klocke FJ, Judd RM. Circulation. 1999;100:1992–2002. doi: 10.1161/01.cir.100.19.1992. [DOI] [PubMed] [Google Scholar]
- 20.Foster-Gareau P, Heyn C, Alejski A, Rutt BK. Magn Reson Med. 2003;49:968–971. doi: 10.1002/mrm.10417. [DOI] [PubMed] [Google Scholar]
- 21.Kober F, Iltis I, Cozzone PJ, Bernard M. Magma. 2004;17:157–161. doi: 10.1007/s10334-004-0086-0. [DOI] [PubMed] [Google Scholar]
- 22.Roth DM, Swaney JS, Dalton ND, Gilpin EA, Ross J., Jr Am J Physiol Heart Circ Physiol. 2002;282:H2134–2140. doi: 10.1152/ajpheart.00845.2001. [DOI] [PubMed] [Google Scholar]
- 23.Beischer DE, Knepton JC., Jr Aerosp Med. 1964;35:939–944. [PubMed] [Google Scholar]
- 24.Shetty AN. Magn Reson Med. 1988;8:84–88. doi: 10.1002/mrm.1910080110. [DOI] [PubMed] [Google Scholar]
- 25.Polson MJ, Barker AT, Gardiner S. Clin Phys Physiol Meas. 1982;3:231–234. doi: 10.1088/0143-0815/3/3/008. [DOI] [PubMed] [Google Scholar]
- 26.Oppelt A, Graumann R, Barfuss H, Fischer H, Hartl W, Schajor W. Electromedica. 1986;54:15–18. [Google Scholar]
- 27.Berr SS, Roy RJ, French BA, Yang Z, Gilson W, Kramer CM, Epstein FH. Magn Reson Med. 2005;53:1074–1079. doi: 10.1002/mrm.20487. [DOI] [PubMed] [Google Scholar]
- 28.Abd-Elmoniem KZ, Terrovitis J, Abraham MR, Prince JL, Stuber M. J Cardiovasc Magn Reson. 2007;9:390–391. [Google Scholar]
- 29.Kim RJ, Hillenbrand HB, Judd RM. Herz. 2000;25:417–430. doi: 10.1007/s000590050034. [DOI] [PubMed] [Google Scholar]
- 30.Oshinski JN, Yang Z, Jones JR, Mata JF, French BA. Circulation. 2001;104:2838–2842. doi: 10.1161/hc4801.100351. [DOI] [PubMed] [Google Scholar]
- 31.Flacke S, Allen JS, Chia JM, Wible JH, Periasamy MP, Adams MD, Adzamli IK, Lorenz CH. Radiology. 2003;226:731–738. doi: 10.1148/radiol.2263020151. [DOI] [PubMed] [Google Scholar]
- 32.Yang Z, Berr SS, Gilson WD, Toufektsian MC, French BA. Circulation. 2004;109:1161–1167. doi: 10.1161/01.CIR.0000118495.88442.32. [DOI] [PubMed] [Google Scholar]
- 33.French BA, Beyers RJ, Sureau FC, Yang Z, Gilson WDR, R J, Berr SS, Epstein FH. J Cardiovasc Magn Reson. 2005;7:172–173. [Google Scholar]
- 34.Gupta A, Lee VS, Chung YC, Babb JS, Simonetti OP. Radiology. 2004;233:921–926. doi: 10.1148/radiol.2333032004. [DOI] [PubMed] [Google Scholar]
- 35.Dill T, Ekinci O, Hansel J, Kluge A, Breidenbach C, Hamm CW. J Cardiovasc Magn Reson. 2005;7:521–523. doi: 10.1081/jcmr-200053596. [DOI] [PubMed] [Google Scholar]
- 36.Wilson JM, Villareal RP, Hariharan R, Massumi A, Muthupillai R, Flamm SD. Tex Heart Inst J. 2002;29:176–180. [PMC free article] [PubMed] [Google Scholar]
- 37.Tandri H, Saranathan M, Rodriguez ER, Martinez C, Bomma C, Nasir K, Rosen B, Lima JA, Calkins H, Bluemke DA. J Am Coll Cardiol. 2005;45:98–103. doi: 10.1016/j.jacc.2004.09.053. [DOI] [PubMed] [Google Scholar]
- 38.Kramer CM, Lima JA, Reichek N, Ferrari VA, Llaneras MR, Palmon LC, Yeh IT, Tallant B, Axel L. Circulation. 1993;88:1279–1288. doi: 10.1161/01.cir.88.3.1279. [DOI] [PubMed] [Google Scholar]
- 39.Epstein FH, Yang Z, Gilson WD, Berr SS, Kramer CM, French BA. Magn Reson Med. 2002;48:399–403. doi: 10.1002/mrm.10210. [DOI] [PubMed] [Google Scholar]
- 40.Kramer CM, Reichek N, Ferrari VA, Theobald T, Dawson J, Axel L. Circulation. 1994;90:186–194. doi: 10.1161/01.cir.90.1.186. [DOI] [PubMed] [Google Scholar]
- 41.Ennis DB, Epstein FH, Kellman P, Fananapazir L, McVeigh ER, Arai AE. Magn Reson Med. 2003;50:638–642. doi: 10.1002/mrm.10543. [DOI] [PMC free article] [PubMed] [Google Scholar]
- 42.Young AA, Dokos S, Powell KA, Sturm B, McCulloch AD, Starling RC, McCarthy PM, White RD. Cardiovasc Res. 2001;49:308–318. doi: 10.1016/s0008-6363(00)00248-0. [DOI] [PubMed] [Google Scholar]
- 43.Bundy JM, Lorenz CH. Comput Med Imaging Graph. 1997;21:225–232. doi: 10.1016/s0895-6111(97)00019-0. [DOI] [PubMed] [Google Scholar]
- 44.Kraitchman DL, Young AA, Axel L. IEEE Trans Med Imaging. 1995;14:422–433. doi: 10.1109/42.414606. [DOI] [PubMed] [Google Scholar]
- 45.Young AA, Kraitchman DL, Dougherty L, Axel L. IEEE-Trans Med Imag. 1995;14:413–421. doi: 10.1109/42.414605. [DOI] [PubMed] [Google Scholar]
- 46.Osman NF, McVeigh ER, Prince JL. IEEE Trans Med Imaging. 2000;19:186–202. doi: 10.1109/42.845177. [DOI] [PubMed] [Google Scholar]
- 47.Osman NF, Prince JL. Phys Med Biol. 2000;45:1665–1682. doi: 10.1088/0031-9155/45/6/318. [DOI] [PubMed] [Google Scholar]
- 48.Amado LC, Gerber BL, Gupta SN, Rettmann DW, Szarf G, Schock R, Nasir K, Kraitchman DL, Lima JA. J Am Coll Cardiol. 2004;44:2383–2389. doi: 10.1016/j.jacc.2004.09.020. [DOI] [PubMed] [Google Scholar]
- 49.Schuijf JD, Kaandorp TA, Lamb HJ, van der Geest RJ, Viergever EP, van der Wall EE, de Roos A, Bax JJ. Am J Cardiol. 2004;94:284–288. doi: 10.1016/j.amjcard.2004.04.020. [DOI] [PubMed] [Google Scholar]
- 50.Bock NA, Konyer NB, Henkelman RM. Magn Reson Med. 2003;49:158–167. doi: 10.1002/mrm.10326. [DOI] [PubMed] [Google Scholar]
- 51.Dazai J, Bock NA, Nieman BJ, Davidson LM, Henkelman RM, Chen XJ. Magn Reson Med. 2004;52:709–715. doi: 10.1002/mrm.20215. [DOI] [PubMed] [Google Scholar]
- 52.Bishop J, Feintuch A, Bock NA, Nieman B, Dazai J, Davidson L, Henkelman RM. Magn Reson Med. 2006;55:472–477. doi: 10.1002/mrm.20794. [DOI] [PubMed] [Google Scholar]


