Abstract
A transient decrease in excitability occurs regularly during the S1 phase of threshold electrotonus to depolarizing conditioning stimuli for sensory and, less frequently, motor axons. This has been attributed to the outwardly rectifying action of fast K+ channels, at least in patients with demyelinating diseases. This study investigates the genesis of this notch in healthy axons. Threshold electrotonus was recorded for sensory and motor axons in the median nerve at the wrist in response to test stimuli of different width. The notch occurred more frequently the briefer the test stimulus, and more frequently in sensory studies. In studies on motor axons, the notch decreased in latency and increased in amplitude as the conditioning stimulus increased or the limb was cooled. Low-threshold axons displayed profound changes in strength–duration time constant even though the threshold electrotonus curves contained no detectable notch. When a 1.0 ms current was added to subthreshold conditioning stimuli to trigger EMG, the notch varied with the timing and intensity of the brief current pulse. This study finds no evidence for an outwardly rectifying deflection due to K+ channels, other than the slow accommodation attributable to slow K+ currents. In normal motor axons, a depolarization-induced notch during the S1 phase of threshold electrotonus is the result of the conditioning stimulus exceeding threshold for some axons. The notch is more apparent in sensory axons probably because of the lower slope of the stimulus–response curve and their longer strength–duration time constant rather than a difference in K+ conductances. This may also explain the notch in demyelinating diseases.
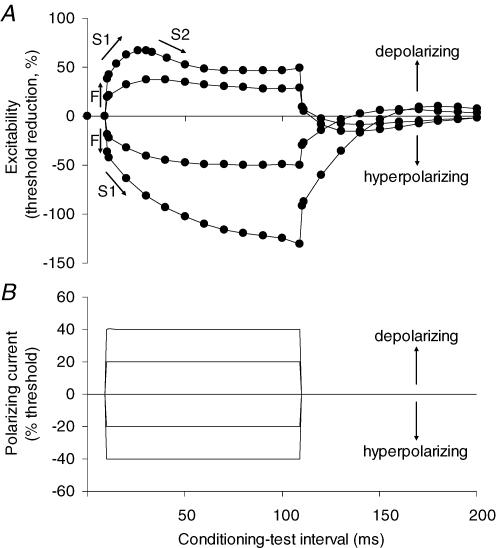
The biophysical properties of human axons can be studied at the site of stimulation using threshold tracking techniques (Bostock et al. 1998). In one of these techniques, threshold electrotonus, a long-lasting (100 ms or more) subthreshold polarizing current, is used as the conditioning stimulus to change the potential of the internodal membrane, allowing internodal properties to be probed. Measurements of the threshold for a target (test) potential are made before, during and after the (conditioning) polarizing current. Changes in the stimulus strength necessary to produce the test potential provide a measure of axonal excitability (Fig. 1) and, under most circumstances, these accurately reflect the underlying electrotonic changes in membrane potential (Bostock et al. 1998).
Figure 1. Threshold electrotonus in motor axons.
A, threshold electrotonus recorded from motor axons using 1.0 ms test stimuli (mean data for the 7 normal subjects in the present study), showing fast and slow phases (F, S1, S2). B, the threshold changes were induced by conditioning polarizing currents of 100 ms duration, set to +40%, +20%, 0%, −20% and −40% of the threshold current for the test potential. The changes in excitability and the responsible conditioning currents are plotted against the conditioning–test interval, delayed by 10 ms so that the onset of threshold electrotonus can be clearly seen. At the onset and offset of the polarizing current there are rapid changes in threshold for the test potential (the ‘F’ phase), reflecting polarization of the node of Ranvier. This phase is followed by a slower increase in excitability with depolarization or decrease in excitability with hyperpolarization (‘S1’) as the membrane potential of the internodal region begins to change due to spread of current from the node. A second slow phase in the opposite direction follows as the axon accommodates to the polarization (‘S2’ with depolarizing currents; ‘S3’ with hyperpolarizing currents, the latter not apparent in the figure). Accommodation to the depolarizing current in the S2 phase results from the activation of outwardly rectifying slow K+ channels to limit the extent of depolarization (Bostock et al. 1998; Schwarz et al. 2006).
The S2 phase of threshold electrotonus represents an outwardly rectifying accommodative response to depolarization due to the activation of slow K+ channels (Schwarz et al. 2006), but a distinct early deflection attributable to the outwardly rectifying action of fast K+ channels is not normally apparent in threshold electrotonus from motor axons. However, in the electrotonic responses of rat myelinated axons, ‘depolarization evoked a rapid outward rectification (time constant, τ ∼0.5 ms), selectively blocked by 4-aminopyridine’ (Baker et al. 1987). A corresponding hyperpolarizing change in threshold has been reported in recordings from motor axons only in disease – in chronic inflammatory demyelinating polyneuropathy (Cappelen-Smith et al. 2001; Sung et al. 2004), in amyotrophic lateral sclerosis (ALS; Bostock et al. 1995) and in Charcot–Marie–Tooth disease type 1A (Nodera et al. 2004). In voltage-clamp studies, outwardly rectifying K+ currents can be quite large in human axons with paranodal demyelination (Schwarz et al. 1995) and the depolarization-induced notch has therefore been attributed to greater fast K+ channel activity due to the exposure by the pathology of paranodal K+ conductances (Nodera & Kaji, 2006). Paradoxically, however, the superficially similar behaviour in ALS has been attributed to a loss of K+ channels (Bostock et al. 1995).
Recordings of threshold electrotonus from sensory axons regularly display a transient decrease in excitability during the S1 phase to depolarizing conditioning stimuli in standard threshold electrotonus protocols. Because a notch is seen more often with sensory axons than motor, it could be inferred that the expression of K+ conductances is greater on sensory than motor axons (though other evidence suggests that this is not so – see Burke et al. 1997). However, there are a number of biophysical differences between human sensory and motor axons, for example sensory axons appear to have greater activity of the hyperpolarization-activated conductance, IH (Bostock et al. 1994; Lin et al. 2002), and a greater persistent Na+ current (Bostock & Rothwell, 1997; see also Panizza et al. 1994; Mogyoros et al. 1996). Given these differences, it would not be unreasonable to postulate a difference in K+ conductances, particularly those that require relatively strong depolarization to produce a significant outward current.
An alternative explanation for the notch has been advanced: that it results from activation of axons by the conditioning stimulus, i.e. the polarizing current was not subthreshold for all axons (Cappelen-Smith et al. 2001; Sung et al. 2004). This study was undertaken primarily to determine whether the depolarization-induced notch on the S1 phase of threshold electrotonus can be attributed to an outwardly rectifying conductance. The study focused on motor axons (i) to determine whether a notch could occur in normal motor axons, and (ii) because EMG recordings could be used to indicate if the conditioning stimulus was suprathreshold and, if so, by how much.
Methods
Sixty-six experiments were performed on seven volunteers (aged 36–62 years; mean 47 years; four males) who provided informed written consent to the experimental procedures, which had the approval of our institutional ethics committee and conformed to the Declaration of Helsinki. None of the subjects were experiencing or had a history of any neurological disorder.
Experimental set-up
The subjects were seated with the forearm supported and the hand relaxed. Compound sensory nerve action potentials (CSAPs) were recorded using two saline-soaked ring electrodes smeared with electrode cream and wound firmly around the distal and proximal interphalangeal joints of the index finger. Compound motor action potentials (CMAPs) were recorded from the thenar muscles using surface electrodes, the active electrode over abductor pollicis brevis and the reference electrode on the proximal phalanx. The compound potentials were amplified and filtered (3 Hz to 3 kHz; ICP511 AC amplifier, Grass Product Group, West Warwick, RI, USA), with electronic attenuation of any mains frequency noise (Hum Bug 50/60Hz Noise Eliminator, Quest Scientific Instruments, North Vancouver, BC, Canada). The resultant signal was then digitized by a computer with a 16-bit analog-to-digital board (PCI-6221m, National Instruments, Austin, TX, USA) using a sampling rate of 10 kHz.
Stimulus delivery was controlled by a computer running modified versions of the Trond excitability protocol (written in QTRAC, © Professor H. Bostock, Institute of Neurology, London). Electrical stimuli were delivered from a computer-controlled current source to the median nerve at the wrist via surface electrodes with the cathode placed at the wrist and the anode over muscle, approximately midway between the wrist and elbow. CSAP amplitude was measured peak-to-peak and CMAP amplitude was measured from baseline to negative peak. Latencies were measured to the negative peak of the compound potentials.
Study protocols
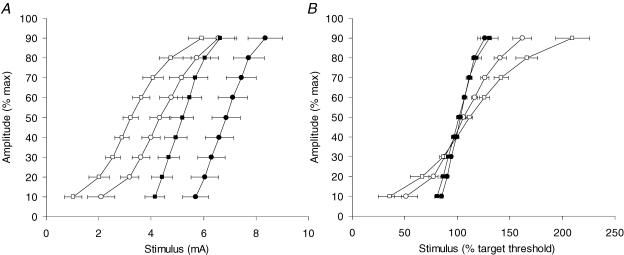
Stimulus–response relationships were recorded from sensory axons using test stimuli of 0.2, 0.5 and 1.0 ms duration and from motor axons using test stimuli of 0.5 and 1.0 ms duration (Fig. 2). The stimulus–response curves were used to set the size of the test CSAP or CMAP and to optimize the tracking of the threshold current required to produce that test potential (see Kiernan et al. 2000; 2001b). Threshold electrotonus was recorded with test stimuli of 0.2, 0.5 and 1.0 ms duration delivered during and after subthreshold polarizing currents of 100 ms duration. The computer altered the stimulus current to keep the test potential at a fixed fraction of the maximal response. The target size (on average 40% of maximum for the CSAP and 44% for the CMAP) was determined for each recording, based on the steepest point of the stimulus–response relationship (recorded using the same test stimulus width). The intensities of the 100 ms long conditioning polarization were +20% and +40% (depolarizing) and −20% and −40% (hyperpolarizing) of the current required to produce the test potential. With the +40% depolarizing current, the threshold for the test potential was measured at the 27 conditioning–test intervals specified in the Trond protocol (Fig. 1) and at 10 additional intervals between 11 and 33 ms in order to define any inflection on S1 more accurately (Fig. 3).
Figure 2. Stimulus–response curves recorded from sensory and motor axons.
A, stimulus–response relationships for sensory (open symbols) and motor axons (filled symbols) recorded using test stimuli of 1.0 ms (squares) and 0.5 ms (circles). B, stimulus–response relationships from A, with stimulus intensity normalized to the threshold for target response (∼40% of maximum amplitude for the CSAP, ∼44% for the CMAP). Data are means ± s.e.m. for 7 subjects.
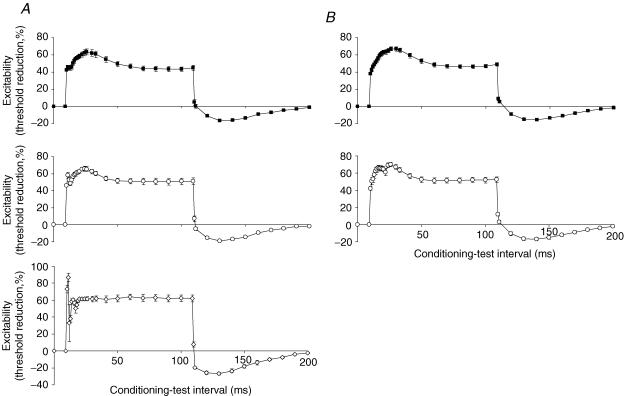
Figure 3. Threshold electrotonus in sensory and motor axons using test stimuli of different widths.
A, threshold electrotonus to a 100 ms depolarizing conditioning current set to +40% of the threshold current for the test potential recorded from sensory axons using test stimuli of 1.0 ms (▪), 0.5 ms (○) or 0.2 ms (⋄) duration. Data are means ± s.e.m. for 7 subjects, except for 0.2 ms where data for five subjects are shown (stimulus artefact prevented valid recordings in two subjects with this test width). B, equivalent recordings for motor axons using test stimuli of 1.0 ms (▪) for 0.5 ms (○) duration. Data are means ± s.e.m. for 7 subjects. Recordings could not be made using test stimuli of 0.2 ms duration because threshold for a 40% CMAP was then so high that the conditioning current for the threshold electrotonus was not easily tolerated.
The protocol was then modified to produce conditioning currents of different strength: +40%, +45%, +50% and +55% of threshold for the test potential, recording from motor axons only. The test stimulus was of 1.0 ms duration. It was not possible to obtain a complete recording from one of the seven subjects. This modified protocol was run six times on one subject to check the reproducibility of the results.
To explore what happens when the conditioning depolarizing stimulus is known to be suprathreshold for some axons, the threshold for the test potential was tracked as previously, during and after a 100 ms long depolarizing conditioning current, but the strength of the conditioning stimulus was determined by the threshold for liminal EMG activity, defined as 5% of the maximal CMAP using a long (12 ms) test stimulus. The 12 ms duration was chosen because the transient hyperpolarization occurred approximately 12 ms after the onset of the conditioning stimulus. Recordings of threshold electrotonus were then made in three subjects using 1.0 ms test stimuli and 100 ms long conditioning currents set to 80%, 100%, 120% and 140% of the threshold for liminal EMG activity. The response to the conditioning stimulus was subtracted online from the response to the combination of a conditioning and a test stimulus so that the test potential was recorded without the conditioning stimulus artefact.
Responses of axons of different threshold
In order to study motor axons of different threshold, threshold electrotonus was recorded using test potentials of 5%, 10% or 40% of maximum. In these studies the changes in strength–duration time constant (τSD) were determined using alternating test stimuli of 1.0 ms and 0.2 ms duration, and the τSD was calculated at each interval using Weiss's formula (Mogyoros et al. 1996). The conditioning stimulus was set to either +30%, +35% or +40% of the threshold for a potential that was 40% of maximum (using 1.0 ms stimuli). Data were collected from all seven subjects.
Effects of cooling
To determine the effect of cooling on threshold electrotonus to depolarizing currents, a temperature-controlled, fluid-filled wrap (ThermoTek Inc., Carrollton, TX, USA) was used in three subjects to lower the temperature of the arm. The effects of cooling on threshold electrotonus in sensory axons was studied in one subject. The depolarizing conditioning current was set to 40% of the threshold and the test stimulus duration was 0.5 ms (as it is in the standard threshold electrotonus protocol). The starting temperature was 35.4°C. With motor axons, the depolarizing conditioning current was set to 60% of the threshold for the test potential (using 1.0 ms stimuli) to ensure that a transient hyperpolarizing change in threshold occurred during the S1 phase of threshold electrotonus to depolarizing currents in control recordings. The starting temperatures were 35.5°C, 35.5°C and 36.6°C. For all four experiments, the threshold was recorded at 13 intervals from 0 ms to 40 ms after the onset of the conditioning stimulus (i.e. throughout the S1 phase of threshold electrotonus), as the temperature was decreased. The response to the conditioning stimulus was subtracted online from the response to the conditioning–test stimulus combination. Data were recorded until the skin temperature at the site of stimulation stabilized.
Temperature control
Throughout the experiments, skin temperature was measured close to the cathode and continuously logged using a skin probe (YSI Inc., Yellow Springs, OH, USA) and digital thermistor (Omega Engineering Inc., Stamford, CT, USA). In six of the seven subjects it was maintained at or above 32°C (average 33.9°C; except when studying cooling), using the temperature-controlled, fluid-filled wrap as required. In one experiment the wrap was not used, and this subject's average temperature for that experiment was lower, 31.2°C (range 31.0–31.5°C).
Results
Standard threshold electrotonus protocols with the conditioning current set by the test stimulus
When threshold electrotonus was recorded from sensory axons using the standard Trond protocol (i.e. conditioning stimulus intensity ±40% and ±20% of the threshold for the test potential, determined using a test stimulus 0.5 ms wide), there was, with the +40% conditioning current, a transient hyperpolarizing threshold change (notch) superimposed on the slow depolarization of the S1 phase in all subjects (Fig. 3A). In no subject was the 20% conditioning current associated with a notch. The notch was also recorded in five of the seven subjects when the measurements were repeated using a conditioning current of +40% of the threshold to a test stimulus 1.0 ms wide. It proved difficult to make the measurements using a 0.2 ms wide test stimulus because the stronger conditioning current associated with the briefer test stimulus (see below) produced excessive EMG. However, the notch was more prominent in all five subjects in whom a complete recording was obtained (Fig. 3A, lowest panel). The increase in the fast phase (F) of threshold electrotonus as the duration of the test stimulus was decreased is also due to the greater strength of the conditioning stimulus.
The standard Trond protocol for recording threshold electrotonus from motor axons involves conditioning currents ±40% and ±20% of the threshold to a test stimulus 1.0 ms wide. The 10 additional intervals during the S1 phase allowed a small notch to be defined in the recordings from two of the seven subjects with this protocol (Fig. 3B). When test stimulus duration was decreased to the width used in the sensory studies (0.5 ms), a notch was seen in five of the seven recordings (Fig. 3B, lowest panel). It was not possible to record threshold electrotonus from motor axons using a 0.2 ms wide test stimulus because the conditioning current then caused excessive EMG. The notch appeared ∼5 ms earlier on the S1 phase with sensory axons than with motor axons, probably due to the measurement of latencies to the negative peak of the compound action potential (slower rise time for the CMAP than the CSAP).
Varying the strength of the conditioning stimulus
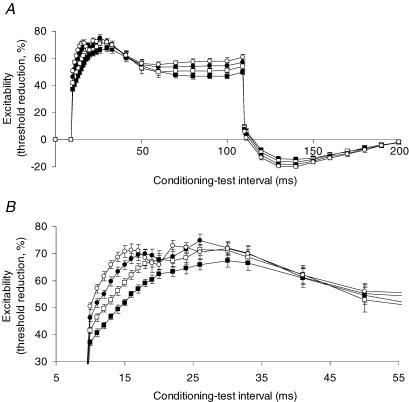
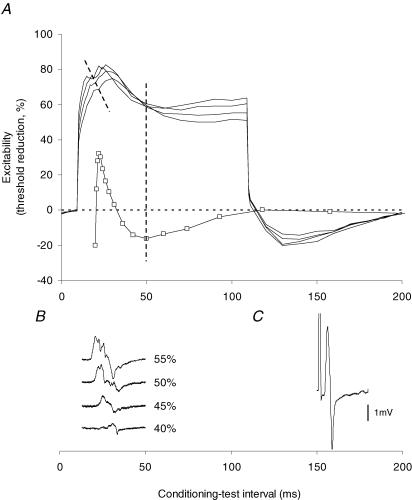
The apparently paradoxical finding that the notch occurred more often and was larger with narrower test stimuli can be explained by the fact that the strength of the conditioning current was set by the intensity of the test stimulus, i.e. as a percentage of the threshold current required to produce the test potential. In Fig. 4 the strength of the depolarizing conditioning current was increased from +40% to +55% in 5% increments while keeping the test stimulus width constant (1.0 ms). The notch increased in amplitude and decreased in latency as the conditioning current increased in intensity. The results were identical for the one subject in whom the experiment was repeated on six occasions. Figure 5A illustrates the growth of the notch and the latency shortening for a single subject. Figure 5B shows that the EMG induced by the conditioning current underwent a similar shortening in latency and increase in amplitude as the intensity of the conditioning stimulus increased, a change that is appropriate given the strength–duration properties of axons.
Figure 4. Evolution of the ‘notch’ with increasing depolarizing conditioning currents.
A, threshold electrotonus with a 100 ms depolarizing conditioning current set to +40% (▪), + 45% (□), +50% (•) and +55% (○) of the threshold for the test potential recorded from motor axons using 1.0 ms wide test stimuli. B, detail from A of threshold changes occurring at conditioning–test intervals between 5 ms and 50 ms. Data are means ± s.e.m. for 6 subjects (data from the incomplete recording from one subject are not included).
Figure 5. Changes in ‘notch’ latency and amplitude and the occurrence of EMG with increasing depolarizing conditioning currents.
A, development of the notch with increase in the conditioning current from +40% to +55% (in 5% increments) of the threshold for the test potential. The angled dashed line indicates the shortening of the latency to the peak of the notch with increasing conditioning current strength. Data recorded for one subject, using 1.0 ms test stimuli. The recovery cycle (□) recorded from the same subject on a separate occasion is superimposed, offset so that the onset of the relative refractory period lines up with the peak amplitude of the ‘notch’. The trough of late subnormality coincides with the trough in the accommodative ‘sag’ in the 55% threshold electrotonus trace (vertical dashed line). B, the EMG generated by the conditioning current. Note the increase in amplitude and shortening of latency as the strength of the conditioning current was increased. Same time base for A and B. C, the test potential.
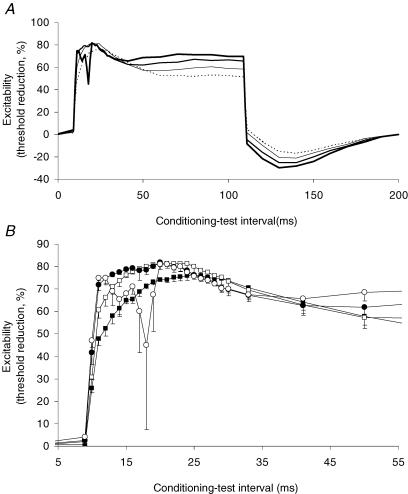
To determine the relationship between the notch and EMG produced by the conditioning current, the strength of the conditioning current was set as a percentage of that necessary to produce liminal EMG, rather than relative to the threshold for the test potential (Fig. 6). The notch was not seen when the conditioning current was 80% and did not activate motor axons. As the intensity was increased to 100%, 120% and 140%, the notch appeared and increased in amplitude and shortened in latency the stronger the conditioning current. In one of three subjects the notch was detectable at 100%.
Figure 6. The relationship between EMG and the development of the ‘notch’.
A, threshold electrotonus to a 100 ms depolarizing current set to 80% (dashed line), 100% (thin line), 120% (medium line) and 140% (thick line) of the threshold current for liminal EMG generated by a 12 ms wide test stimulus. B, detail from A (80%–▪; 100%–□; 120%–•; 140%–○) of threshold changes occurring at conditioning–test intervals between 5 ms and 50 ms. Data are means ± s.e.m. for three subjects (error bars shown in one direction only for clarity).
Relationship between the notch and the EMG produced by the conditioning stimulus
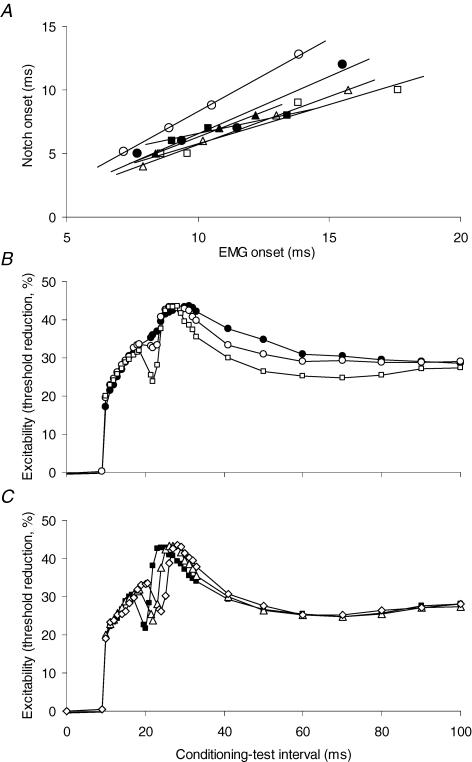
Figure 5B shows that, even though the EMG produced by the long conditioning current was dispersed, it increased in amplitude and decreased in latency as the intensity of the conditioning current increased. In this subject the amplitude of the EMG induced by the +55% conditioning current was just over one-third of that of the test potential (compare Fig. 5B and C), i.e. approximately 12% of the maximal CMAP. There was a statistically significant association between the latency to the onset of the EMG and the latency to the onset of the notch in five of the six subjects (Fig. 7A; P < 0.05; in the sixth subject, P=0.131; R2 varied from 0.938 to 0.999 for the six regressions). The size of the notch varied with the intensity of EMG (Fig. 5B), but quantitative analysis using amplitude or area of the evoked EMG is flawed because dispersion of the evoked activity produces phase cancellation between individual motor unit potentials.
Figure 7. Correlation between EMG activity and the onset of the ‘notch’.
A, correlation between the onset of the EMG activity and the onset of the ‘notch’ in six subjects (data from experiments presented in Fig. 3). The R2 values for the six trend lines varied from 0.938 to 0.999. There was a statistically significant correlation between EMG onset and notch onset in five of the six subjects (P < 0.05; in the sixth, P=0.131). B, threshold electrotonus to a 100 ms, +20% depolarizing conditioning stimulus, on which a 1.0 ms depolarizing pulse was superimposed 10 ms after onset. The pulse was set to produce a CMAP that was 10% (•), 20% (○) or 40% (□) of maximum. C, threshold electrotonus recorded as in B, except the pulse was constant (40% CMAP) in amplitude but superimposed at different points during S1–8 ms (▪), 10 ms (▵) or 12 ms (⋄). B and C show mean data for 4 experiments (2 subjects).
To produce a more synchronized EMG potential, the 100 ms conditioning current was kept subthreshold (20% of the threshold for the test potential using a 1.0 ms stimulus) and a 1.0 ms stimulus, sufficient to trigger EMG, was added to the 100 ms rectangular current 8, 10 or 12 ms after its onset. In four experiments in two subjects, this produced a notch in the threshold electrotonus indistinguishable from those previously recorded. The artefact produced by the coincidence of the test stimulus and the 1 ms addition to the conditioning current was obviated by not sampling at those intervals (Fig. 7B and C). The notch was greater the stronger the added 1 ms current (i.e. the stronger the evoked EMG burst; Fig. 7B). Its timing varied with the timing of the stimulus and the EMG it produced (Fig. 7C).
Axons of different threshold and changes in strength-duration time constant
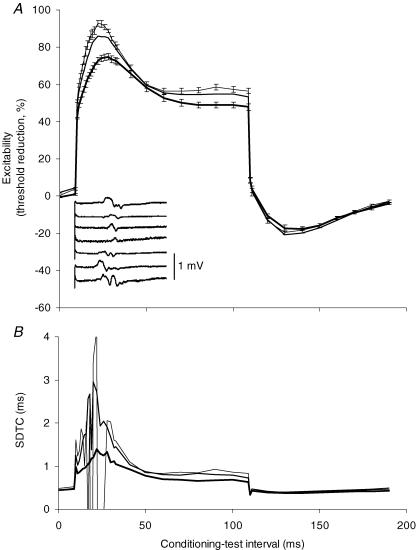
To study the behaviour of axons of low threshold, threshold electrotonus plots were recorded for test potentials that were 5%, 10% and 40% of maximum using conditioning polarization set to 40% of the threshold for a test potential that was 40% of the maximal CMAP. Not surprisingly, the changes in excitability were greater for low-threshold axons (Fig. 8A). EMG was induced by the depolarizing current in each of the seven subjects, but there was no discernible notch in the averaged threshold electrotonus traces (Fig. 8A). Despite this, there were extensive fluctuations in τSD, particularly for the lowest threshold axons, tracked using a test potential that was 5% of maximum (Fig. 8B) during the S1 phase of threshold electrotonus.
Figure 8. Threshold electrotonus in motor axons with different thresholds.
A, threshold electrotonus with a 100 ms depolarizing conditioning current set to +40% of the threshold for a CMAP 40% of maximum, recorded using 1.0 ms wide test stimuli. The test potential was either 40% (thick line), 10% (medium line; no error bars shown for clarity) or 5% (thin line) of maximal CMAP (mean ± s.e.m.; n=7). Inset: a representative trace of the EMG generated by the conditioning current for each subject. B, data were concurrently recorded using a 0.2 ms wide stimulus (identical conditioning current and test potential amplitudes as in A) and the change in strength–duration time constant (SDTC) produced by the conditioning polarization is shown (mean data for 7 subjects).
The effect of cooling
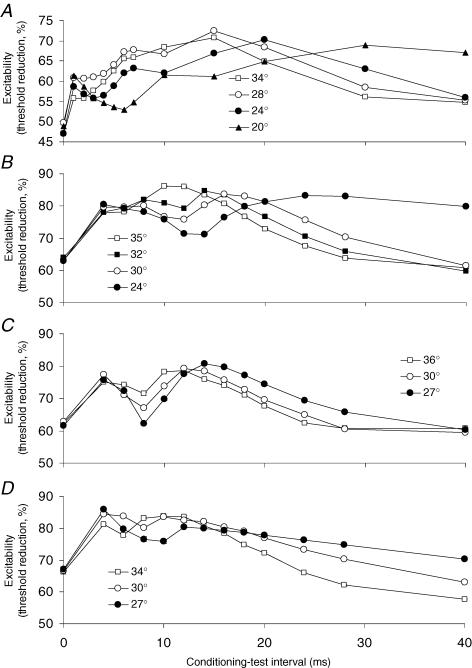
The effects of cooling on the notch were explored in three subjects (for sensory axons in one subject; for motor axons in all three). Figure 9 shows the recordings at decreasing temperatures so that the changes in the notch can be clearly seen. There were similar findings for sensory and motor axons, apart from the shorter latency of the notch for sensory axons. Cooling increased both the depth and duration of the depolarization-induced notch in each experiment, but reduced the accommodation due to slow K+ currents (S2 phase). With motor axons, there were comparable changes in latency and intensity of the EMG activity produced by the conditioning stimulus (not illustrated).
Figure 9. Effect of reducing temperature on the development of the ‘notch’, recorded from sensory axons (A) and motor axons (B, C and D).
Skin temperatures (°C) are indicated in the legends for each subject. The depolarizing conditioning current was set to +40% of the threshold for the test potential for the sensory recording and +60% for all three motor recordings. A (sensory) and B (motor) were recorded from the same subject on separate occasions. Cooling the limb increased the latency, amplitude and duration of the notch, but decreased S2, the accommodative response attributed to activation of slow K+ channels.
Comparison with recovery cycle
In the threshold electrotonus plots of Figs 4–6, the S2 phase appears distorted, taking on a scalloped appearance, with less threshold reduction in the middle of the trace and more at the end of the 100 ms current the stronger the stimulus. However, as expected, the hyperpolarizing undershoot of threshold after the termination of the current was greater the stronger the conditioning current, and this suggests that there was actually greater accommodation, as would be expected with more intense activation of slow K+ conductances. Included in Fig. 5A is the conventional recovery cycle (on the same time base, recorded in the same subject from whom the threshold electrotonus data were obtained, but on a different occasion), showing the changes in excitability of motor axons following a 1 ms supramaximal conditioning stimulus. The recovery cycle has been inverted to conform with the convention for threshold electrotonus plots, and the curves are aligned so that the notch in the threshold electrotonus plot superimposes on the refractoriness of the recovery cycle. The gradual increase in excitability during S2 corresponds to the subsidence of late subnormality, best seen with the 55% conditioning current.
Discussion
The present study has focused on the accommodative responses of human peripheral nerve axons to depolarizing currents, and (i) confirms a slow accommodative response (S2) that behaves as expected for an outwardly rectifying deflection, (ii) demonstrates that a transient hyperpolarizing notch can occur on the S1 phase of threshold electrotonus, and (iii) investigates whether the latter deflection represents outward rectification or is due to activation of axons by the conditioning polarization. The notch was seen regularly for sensory axons but only under specific conditions with motor axons. With the latter, it could be produced or accentuated by a briefer test stimulus, a stronger conditioning stimulus, and cooling, but it appeared only when the conditioning stimulus produced EMG activity, and its size and latency were related to those of the evoked EMG potential. When the conditioning stimuli produced EMG but just failed to produce a discernible notch in threshold electrotonus, there were profound changes in the strength–duration time constant for low-threshold axons, at the latency at which the notch would have been expected.
These findings raise a number of issues. What is the genesis of the notch? Do the differences in the ease of its demonstration for sensory and motor axons reflect a biophysical difference between sensory and motor axons? Does the activity of fast K+ channels affect threshold electrotonus?
The genesis of the notch
In motor axons, a notch was always associated with a conditioning stimulus that produced EMG and, in different experimental protocols, its latency and amplitude paralleled those of the evoked EMG. The notch was not seen with motor axons when the conditioning current was subthreshold for liminal EMG, i.e. when there was no detectable axonal activation. Further, triggering a notch by adding a 1 ms pulse to an otherwise subthreshold polarizing current demonstrated that the timing and intensity of the resultant notch varied with the timing and intensity of the added 1 ms pulse and with the EMG activity that it produced. On the other hand, some axonal activation can be tolerated without producing a detectable notch, though the strength–duration time constant for low-threshold axons indicated a profound disturbance to axonal excitability, even if this was not apparent in the threshold electrotonus plot.
It can reasonably be expected that cooling would increase the refractory period (Burke et al. 1999; Kiernan et al. 2001a) and slow the kinetics of all channels, including fast K+ channels. It was reasoned that, if the notch was due to refractoriness of motor axons activated by the conditioning stimulus, a cooling-induced increase in refractoriness would increase the notch. On the other hand, if it was due to the rectifying properties of fast K+ channels, a cooling-induced slowing of channel kinetics would, if anything, decrease the notch (much as it decreased S2, the outwardly rectifying deflection due to activation of slow K+ channels; Bostock et al. 1998; Schwarz et al. 2006). Cooling motor axons increased both the amplitude and the duration of the depolarization-induced notch, in keeping with the hypothesis that the cause of the notch was that the conditioning stimulus was not subthreshold.
The present data therefore suggest that the notch is the direct result of axons being activated by the conditioning current and then undergoing a recovery cycle. The time course of the oscillations in S2 in Fig. 5 supports this view. The alternative hypothesis, that the notch is an outwardly rectifying deflection due to activation of fast K+ conductances, as proposed for demyelinating polyneuropathy by Nodera & Kaji (2006), seems less tenable, at least for normal axons. It remains possible that the stronger conditioning stimuli necessary to produce the notch could produce EMG activity and activate fast K+ conductances sufficiently to contribute an obvious outwardly rectifying deflection to the notch. Nevertheless, other data provide a coherent though circumstantial argument that activation of axons by the conditioning stimulus is a necessary (and, we believe, sufficient) condition for the notch, whether in motor or sensory axons. One implication of the present study is therefore that, with conventional threshold electrotonus protocols, only K+ channels with slow kinetics contribute to an identifiable accommodative deflection.
Differences between sensory and motor axons
It was easier to produce a notch in sensory axons than motor. In part, this is because, for sensory studies, threshold tracking techniques routinely use test stimuli that are half the width of those used in motor studies (0.5 ms and 1.0 ms, respectively), largely to minimize the effects of greater phase cancellation due to the temporal dispersion of compound nerve volleys than compound muscle action potentials (Kiernan et al. 2001b). However, notches occurred in sensory recordings more readily even when the test stimuli were of equal duration. The slope of stimulus–response curve is lower for sensory axons (Fig. 2), and this implies that, when the polarizing current is determined by the threshold for a test potential that is 40% of maximum, low-threshold axons are more likely to be activated by the conditioning polarization in sensory studies than in motor. The latency to the onset of the notch was longer in the recordings from motor axons, but this was probably due to recording of latencies for the CMAP and CSAP to the negative peak rather than onset. Accordingly, the present data do not support an additional biophysical difference between sensory and motor axons.
Does the activity of fast K+ channels affect threshold electrotonus?
A conclusion of the present study is that an outwardly rectifying deflection due to fast K+ conductances is not present in threshold electrotonus studies on normal axons. Presumably, this is largely because such channels are not accessed readily, being sequestered under the myelin sheath in the paranodal and juxta-paranodal regions (e.g. Röper & Schwarz, 1989; Waxman & Ritchie, 1993; Schwarz et al. 1995; Vogel & Schwarz, 1995; Waxman, 1995; Poliak & Peles, 2003). This then raises the possibility that paranodal demyelination might reveal such an action, as suggested by Nodera & Kaji (2006). However, the slope of the stimulus–response curve is decreased in many demyelinating diseases (Meulstee et al. 1997; Cappelen-Smith et al. 2001; Sung et al. 2004), and paranodal demyelination increases the membrane time constant by effectively incorporating paranodal membrane into the node (Brismar, 1981; Bostock et al. 1983). The former change will increase the likelihood that conditioning polarization referenced to the threshold for a submaximal test potential will activate some axons of low threshold (much as may occur with sensory axons, see above). While it remains possible that paranodal demyelination will allow the rectifying properties of fast K+ conductances to become apparent, it cannot be assumed that this will produce a distinct deflection in threshold electrotonus.
The failure to demonstrate a rectifying action of fast K+ conductances does not mean that these channels do not influence the threshold electrotonus waveform. Indeed, the changes in the S1 phase of threshold electrotonus seen with changes in membrane potential (Kiernan & Bostock, 2000) are largely due to the changes in the resistance of the internodal membrane, as internodal K+ channels are activated with depolarization or deactivated with hyperpolarization (Bostock et al. 1998). Hyperpolarization produces ‘fanning out’, with greater threshold changes associated with the S1 phase in both the depolarizing and hyperpolarizing directions, while depolarization produces ‘fanning in’ with lesser changes in S1 (Kaji, 1997; Kiernan & Bostock, 2000; Nodera & Kaji, 2006).
Implications for studies of threshold electrotonus
When a notch is noted in recordings from motor axons, it would be prudent to rule out axonal activation by the conditioning stimulus as the cause by examining the traces for EMG activated by the conditioning stimulus. No comparable control is available for sensory axons. There is only one way to avoid a notch due to activation of low-threshold axons by the conditioning stimulus: reduce the intensity of the conditioning stimulus until it is truly subthreshold. For clinical studies this would require control data using a number of conditioning stimulus intensities. Accordingly, current versions of QTRAC use two levels of polarizing current, ±20% and ±40%. However, as in Fig. 8, some activity in low-threshold axons can be tolerated without producing a discernible notch in threshold electrotonus (particularly with conventional protocols that do not sample threshold as often as in the present study).
Acknowledgments
This work was supported by the Australian Research Council.
References
- Baker M, Bostock H, Grafe P, Martius P. Function and distribution of three types of rectifying channel in rat spinal root myelinated axons. J Physiol. 1987;383:45–67. doi: 10.1113/jphysiol.1987.sp016395. [DOI] [PMC free article] [PubMed] [Google Scholar]
- Bostock H, Burke D, Hales JP. Differences in behaviour of sensory and motor axons following release of ischaemia. Brain. 1994;117:225–234. doi: 10.1093/brain/117.2.225. [DOI] [PubMed] [Google Scholar]
- Bostock H, Cikurel K, Burke D. Threshold tracking techniques in the study of human peripheral nerve. Muscle Nerve. 1998;21:137–158. doi: 10.1002/(sici)1097-4598(199802)21:2<137::aid-mus1>3.0.co;2-c. [DOI] [PubMed] [Google Scholar]
- Bostock H, Rothwell JC. Latent addition in motor and sensory fibres of human peripheral nerve. J Physiol. 1997;498:277–294. doi: 10.1113/jphysiol.1997.sp021857. [DOI] [PMC free article] [PubMed] [Google Scholar]
- Bostock H, Sears TA, Sherratt RM. The spatial distribution of excitability and membrane current in normal and demyelinated mammalian nerve fibres. J Physiol. 1983;341:41–58. doi: 10.1113/jphysiol.1983.sp014791. [DOI] [PMC free article] [PubMed] [Google Scholar]
- Bostock H, Sharief MK, Reid G, Murray NMF. Axonal ion channel dysfunction in amyotrophic lateral sclerosis. Brain. 1995;118:217–225. doi: 10.1093/brain/118.1.217. [DOI] [PubMed] [Google Scholar]
- Brismar T. Electrical properties of isolated demyelinated rat nerve fibres. Acta Physiol Scand. 1981;113:161–166. doi: 10.1111/j.1748-1716.1981.tb06877.x. [DOI] [PubMed] [Google Scholar]
- Burke D, Kiernan M, Mogyoros I, Bostock H. Susceptibility to conduction block: differences in the biophysical properties of cutaneous afferents and motor axons. In: Kimura J, Kaji R, editors. Physiology of ALS and Related Diseases. Amsterdam: Elsevier; 1997. pp. 43–53. [Google Scholar]
- Burke D, Mogyoros I, Vagg R, Kiernan MC. Temperature dependence of excitability indices of human cutaneous afferents. Muscle Nerve. 1999;22:51–60. doi: 10.1002/(sici)1097-4598(199901)22:1<51::aid-mus9>3.0.co;2-q. [DOI] [PubMed] [Google Scholar]
- Cappelen-Smith C, Kuwabara S, Lin CS-Y, Mogyoros I, Burke D. Membrane properties in chronic inflammatory demyelinating polyneuropathy. Brain. 2001;124:2439–2447. doi: 10.1093/brain/124.12.2439. [DOI] [PubMed] [Google Scholar]
- Kaji R. Physiological and technical basis of peripheral nerve and motoneuron testing. In: Kimura J, Kaji R, editors. Physiology of ALS and Related Diseases. Elsevier, Amsterdam: Elsevier; 1997. pp. 15–41. [Google Scholar]
- Kiernan MC, Bostock H. Effects of membrane polarization and ischaemia on the excitability properties of human motor axons. Brain. 2000;123:2542–2551. doi: 10.1093/brain/123.12.2542. [DOI] [PubMed] [Google Scholar]
- Kiernan MC, Burke D, Andersen KV, Bostock H. Multiple measures of axonal excitability: a new approach in clinical testing. Muscle Nerve. 2000;23:399–409. doi: 10.1002/(sici)1097-4598(200003)23:3<399::aid-mus12>3.0.co;2-g. [DOI] [PubMed] [Google Scholar]
- Kiernan MC, Cikurel K, Bostock H. Effects of temperature on the excitability properties of human motor axons. Brain. 2001a;124:816–825. doi: 10.1093/brain/124.4.816. [DOI] [PubMed] [Google Scholar]
- Kiernan MC, Lin CS-Y, Andersen KV, Murray NMF, Bostock H. Clinical evaluation of excitability measures in sensory nerve. Muscle Nerve. 2001b;24:883–892. doi: 10.1002/mus.1085. [DOI] [PubMed] [Google Scholar]
- Lin CS-Y, Kuwabara S, Cappelen-Smith C, Burke D. Responses of human sensory and motor axons to the release of ischaemia and to hyperpolarizing currents. J Physiol. 2002;541:1025–1039. doi: 10.1113/jphysiol.2002.017848. [DOI] [PMC free article] [PubMed] [Google Scholar]
- Meulstee J, Darbas A, van Doorn PA, van Brieman L, van der Meché FGA. Decreased electrical excitability of peripheral nerves in demyelinating polyneuropathies. J Neurol Neurosurg Psychiatry. 1997;62:398–400. doi: 10.1136/jnnp.62.4.398. [DOI] [PMC free article] [PubMed] [Google Scholar]
- Mogyoros I, Kiernan MC, Burke D. Strength-duration properties of human peripheral nerve. Brain. 1996;119:439–447. doi: 10.1093/brain/119.2.439. [DOI] [PubMed] [Google Scholar]
- Nodera H, Bostock H, Kuwabara S, Sakamoto T, Asanuma K, Jia-Ying S, Ogawara K, Hattori N, Hirayama M, Sobue G, Kaji R. Nerve excitability properties in Charcot-Marie-Tooth disease type 1A. Brain. 2004;127:203–211. doi: 10.1093/brain/awh020. [DOI] [PubMed] [Google Scholar]
- Nodera H, Kaji R. Nerve excitability testing and its clinical application to neuromuscular diseases. Clin Neurophysiol. 2006;117:1902–1916. doi: 10.1016/j.clinph.2006.01.018. [DOI] [PubMed] [Google Scholar]
- Panizza M, Nilsson J, Roth BJ, Rothwell J, Hallett M. The time constants of motor and sensory peripheral nerve fibers measured with the method of latent addition. Electroenceph Clin Neurophys. 1994;93:147–154. doi: 10.1016/0168-5597(94)90078-7. [DOI] [PubMed] [Google Scholar]
- Poliak S, Peles E. The local differentiation of myelinated axons at nodes of Ranvier. Nature Rev Neurosci. 2003;4:968–980. doi: 10.1038/nrn1253. [DOI] [PubMed] [Google Scholar]
- Röper J, Schwarz JR. Heterogeneous distribution of fast and slow potassium channels in myelinated rat nerve fibres. J Physiol. 1989;416:93–110. doi: 10.1113/jphysiol.1989.sp017751. [DOI] [PMC free article] [PubMed] [Google Scholar]
- Schwarz JR, Glassmeier G, Cooper EC, Kao T-C, Nodera H, Tabuena D, Kaji R, Bostock H. KCNQ channels mediate IKs, a slow K+ current regulating excitability in the rat node of Ranvier. J Physiol. 2006;573:17–34. doi: 10.1113/jphysiol.2006.106815. [DOI] [PMC free article] [PubMed] [Google Scholar]
- Schwarz JR, Reid G, Bostock H. Action potentials and membrane currents in the human node of Ranvier. Pflugers Arch. 1995;430:283–292. doi: 10.1007/BF00374660. [DOI] [PubMed] [Google Scholar]
- Sung J-Y, Kuwabara S, Kaji R, Ogawara K, Mori M, Kanai K, Nodera H, Hattori T, Bostock H. Threshold electrotonus in chronic inflammatory demyelinating polyneuropathy: correlation with clinical profiles. Muscle Nerve. 2004;29:28–37. doi: 10.1002/mus.10516. [DOI] [PubMed] [Google Scholar]
- Vogel W, Schwarz JR. Voltage-clamp studies in axons: Macroscopic and single-channel currents. In: Waxman SG, Kocsis JD, Stys PK, editors. The Axon: Structure, Function and Pathophysiology. New York: Oxford University Press; 1995. pp. 257–280. [Google Scholar]
- Waxman SG. Voltage-gated ion channels in axons: localization, function, and development. In: Waxman SG, Kocsis JD, Stys PK, editors. The Axon: Structure, Function and Pathophysiology. New York: Oxford University Press; 1995. pp. 218–243. [Google Scholar]
- Waxman SG, Ritchie JM. Molecular dissection of the myelinated axon. Ann Neurol. 1993;33:121–136. doi: 10.1002/ana.410330202. [DOI] [PubMed] [Google Scholar]


