Abstract
This article reports the development of an optical imaging technique, confocal light absorption and scattering spectroscopic (CLASS) microscopy, capable of noninvasively determining the dimensions and other physical properties of single subcellular organelles. CLASS microscopy combines the principles of light-scattering spectroscopy (LSS) with confocal microscopy. LSS is an optical technique that relates the spectroscopic properties of light elastically scattered by small particles to their size, refractive index, and shape. The multispectral nature of LSS enables it to measure internal cell structures much smaller than the diffraction limit without damaging the cell or requiring exogenous markers, which could affect cell function. Scanning the confocal volume across the sample creates an image. CLASS microscopy approaches the accuracy of electron microscopy but is nondestructive and does not require the contrast agents common to optical microscopy. It provides unique capabilities to study functions of viable cells, which are beyond the capabilities of other techniques.
Keywords: light-scattering spectroscopy, submicrometer, native contrast, imaging, refractive index
Despite the importance of cells as the basic building blocks of all biological organisms, there is yet much to be learned about cell function. Thus, there is a need for a tool that can monitor cells and subcellular organelles on a submicrometer scale without damaging them or using exogenous markers that could affect cell function. The electron microscope (EM) can resolve subcellular structure with very high resolution, but it can only work with nonviable cells. Thus, researchers are studying various modifications of optical microscopy because of its nondestructive nature. However, standard optical microscopy lacks contrast in cells and thus requires the introduction of fluorophores or other exogenous compounds. It also is diffraction-limited and cannot resolve objects much smaller than a wavelength without complex subdiffraction microscopy approaches.
As proof of principle, we have developed a confocal light absorption and scattering spectroscopic (CLASS) microscope, which combines confocal microscopy, a well established high-resolution microscopic technique, with light-scattering spectroscopy (LSS). Perelman and Backman have applied LSS to biological problems, primarily to detect early cancer (1–4). One very important capability of the CLASS microscope is that it provides excellent and highly specific native contrast of internal cell structures by using a physical parameter different from that used by other microscopy techniques. Here, light-scattering spectra are the source of the contrast. Another important aspect of LSS is its ability to detect and characterize particles well beyond the diffraction limit, as recently demonstrated experimentally by Backman et al. (5), Fang et al. (6), and Schuele et al. (7). As explained in Perelman and Backman (4), particles much larger than the wavelength of light give rise to a prominent backscattering peak, and the larger the particle, the narrower the angular width of the peak. However, particles with sizes smaller than the wavelength give rise to broad angle backscattering. Thus, the requirement for high numerical aperture (N.A.) optics, common in confocal microscopy, is not in conflict with the submicrometer resolution of LSS. On the contrary, the larger the N.A., the larger the contribution of signal from smaller particles. Note that this conclusion does not require an assumption that the particles are spherical or homogenous.
Results
Experiments with Suspensions.
To establish the accuracy of the CLASS technique and its ability to detect submicrometer organelles, we performed experiments with suspensions of polystyrene microspheres and isolated rat liver organelles. In these experiments no scanning was performed, and the CLASS system was equipped with a continuous wave Xe arc lamp source.
In the first set of experiments, CLASS measurements were performed with polystyrene microspheres with diameters of 175 nm and 356 nm (Polyscience, Inc., Niles, IL) suspended in water and glycerol. We performed measurements on binary mixtures of microspheres to establish that the technique can separate particles of multiple sizes. The spectra predicted by Mie theory were fitted to the microsphere data by using the algorithm described in Materials and Methods for extracting morphological and biochemical information from CLASS. For a binary mixture of microspheres with nominal diameters of 175 and 356 nm, CLASS yielded distributions that peaked at 175 nm and 355 nm. These distributions were overlaid with Gaussian functions, which yielded standard deviations of 13 nm and 14 nm, respectively. The manufacturer provided specifications for the two sizes of microspheres used as 175 nm with a standard deviation of 10 nm and 356 nm with a standard deviation of 14 nm, which are in excellent agreement with our reconstructed distributions. (The manufacturer does not provide the functional form of the size distributions for either size of microspheres.) Based on these numbers, the accuracy of the CLASS method is estimated to be better than 10 nm.
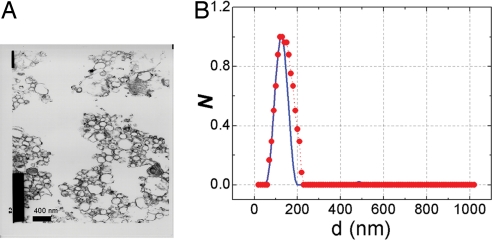
In the second set of experiments, CLASS measurements were performed with suspensions of isolated organelles. In these experiments, the collection time was 100 seconds with organelles drifting in and out of the confocal volume. We prepared suspensions of rat liver microsomes and peroxisomes and also a mixture of both. We compared the size distributions determined by CLASS with those determined by transmission electron microscopy (TEM) for each of the suspensions. We conducted CLASS measurements of organelles, summed the spectra obtained from the individual particles, and obtained the size distributions from the average spectra by using the reconstruction technique described in Materials and Methods. CLASS results were compared with morphometry performed on the same fractions by using TEM photographs taken at ×46,000 and ×63,492 magnifications (Fig. 1A). The morphological measurements were performed by overlaying the TEM photographs with a 100-nm step grid and counting particles of various sizes. We estimate the accuracy of the counting to be ≈20 nm. For nonspherical particles, we used the mean diameter of the organelle. TEM photographs provide thin-section results because the thickness of the TEM sample (60 nm to 80 nm) is smaller than the size of the particles being measured. To compare the 2D TEM results with the 3D CLASS results, it is necessary take into account the frequency of appearance of particles of different sizes in the TEM thin sections and remap the 3D CLASS size distribution to a 2D TEM distribution. The CLASS-reconstructed distribution is in good agreement with the TEM distribution (Fig. 1B). The slight mismatch at larger TEM values is likely to be caused by the inaccuracy in the 2D to 3D remapping.
Fig. 1.
Comparison of the size distributions obtained with TEM and CLASS microscopy. (A) TEM photograph of the fraction containing microsomes taken with a magnification of 46,000. (B) Comparison of the size distributions of the corresponding fraction obtained with TEM (red line) and CLASS microscopy (blue line).
CLASS Measurements of Live Cells.
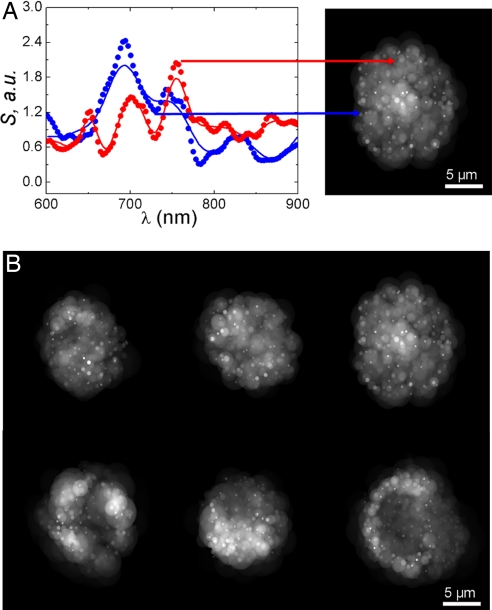
Having established the accuracy of the CLASS technique and its ability to detect submicrometer organelles, we then performed CLASS measurements using live cells. The brightness of the Xe arc lamp is insufficient to perform experiments with live cells, and the lamp was replaced by a supercontinuum laser source. The enhanced brightness allowed us to scan cells with 100-ms exposure per location. To illustrate the principle of scanning CLASS microscopy, we present the CLASS spectra for two individual organelles inside a live 16HBE14o− human bronchial epithelial cell (the left side of Fig. 2A). The spectra show oscillations with periodicity related to the sizes of the organelle in the confocal volume. The dotted lines are data and the solid lines are best fits using the model described in Materials and Methods. The spectra represented by the red lines show higher-frequency oscillations, which correspond to mitochondria, a larger organelle with a size in the 700- to 1,100-nm range. The spectra represented by the blue lines show lower-frequency oscillations, which correspond to a peroxisome, a smaller organelle whose size and shape were reconstructed as a sphere with ≈400-nm diameter. CLASS microscopy provides information about the size, refractive index, shape, and location of particles much smaller than the diffraction limit. There are various ways in which this information can be presented as an image. The right side of Fig. 2A shows one method of presenting the data as a cross-sectional image of the cell reconstructed from the CLASS microscope spectra. The diameters of the spheres represent the reconstructed sizes of the individual organelles, and the grayscale represents their refractive index. Individual organelles can be seen inside the cell. Because of the diffraction limit, the actual position of an organelle is reconstructed with an uncertainty on the order of the focal spot width. However, the reconstructed size of an organelle is not limited by diffraction.
Fig. 2.
The CLASS spectra for two individual organelles inside the live 16HBE14o− human bronchial epithelial cell. (A Left) The spectra show oscillations with periodicity related to the sizes of the organelle in the confocal volume. The dotted lines are data and the solid lines are best fits using the model. (A Right) Reconstructed cross-sectional image of the cell. The image is reconstructed from the CLASS microscope spectra. The diameters of the spheres in the image represent the reconstructed sizes of the individual organelles, and the grayscale represents their refractive index. Individual organelles can easily be seen inside the cell. (B) The reconstructed images of three untreated human bronchial epithelial cells (upper row) and three similar cells treated with DHA that are undergoing apoptosis (lower row). In the apoptotic cells, the organelles form shell-like structures with an empty space in the middle. The treated and untreated cells show clear differences in organelle spatial distribution.
To test the ability of CLASS to monitor changes in live cells in real time, we treated 16HBE14o− cells with 100 μM docosahexaenoic acid (DHA) for 18 to 24 h, a carboxylic acid known to induce apoptosis. The upper row in Fig. 2B shows the reconstructed images of three untreated human bronchial epithelial cells, and the lower row shows three similar cells treated with DHA that are undergoing apoptosis. In the apoptotic cells, the organelles form shell-like structures with an empty space in the middle. The treated and untreated cells show clear differences in organelle spatial distribution.
To ensure that CLASS microscopy detects organelles inside living cells and correctly identifies them, we modified the CLASS instrument with a wide-field fluorescence microscopy arm, which shares a major part of the CLASS optical train (see Materials and Methods).
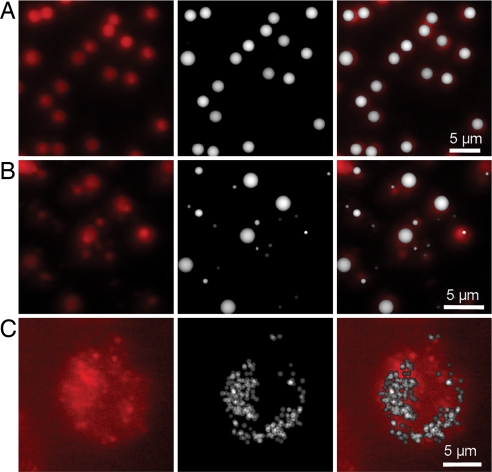
We first tested the combined CLASS/fluorescence instrument on suspensions of carboxylate-modified Invitrogen microspheres, which exhibit red fluorescence emission at a wavelength of 605 nm with excitation at 580 nm. The microspheres were effectively constrained to a single-layer geometry by two thin microscope slides coated with a refractive index matching optical gel. Fig. 3A shows (from left to right) the fluorescence image of the layer of 1.9-μm diameter microspheres, the image reconstructed from the CLASS data, and the overlay of the images. Fig. 3B shows a mixture of three sizes of fluorescent beads with sizes 0.5 μm, 1.1 μm, and 1.9 μm mixed in a ratio of 4:2:1. Note the misleading size information evident in the conventional fluorescence images. A 0.5-μm microsphere located at the right-hand side of the images, midway between top and bottom, produces a fluorescence spot that is significantly larger than the microsphere's actual size, which may be because it is either close to the focal plane of the fluorescence microscope or carries a high load of fluorescent label. On the other hand, the CLASS image of the same spot does not make this error and correctly reconstructs the real size of the microsphere (Fig. 3B Center). We also can see that prior fluorescence labeling does not affect the determination of the objects with CLASS measurements.
Fig. 3.
Simultaneous CLASS and fluorescence imaging of microspheres and live cells. (A) Fluorescence image of the suspensions of carboxylate-modified 1.9-μm-diameter microspheres exhibiting red fluorescence (Left), the image reconstructed from the CLASS data (Center), and the overlay of the images (Right). (B) Image of the mixture of three sizes of fluorescent beads with sizes 0.5 μm, 1.1 μm, and 1.9 μm mixed in a ratio of 4:2:1 (Left), the image reconstructed from the CLASS data (Center), and the overlay of the images (Right). (C) Image of live 16HBE14o− human bronchial epithelial cells with lysosomes stained with lysosome-specific fluorescence dye (Left), the image reconstructed from the CLASS data (Center), and the overlay of the images (Right).
To confirm the ability of CLASS to detect and identify specific organelles in a live cell, we performed simultaneous CLASS and fluorescence imaging of live 16HBE14o− human bronchial epithelial cells, with the lysosomes stained with a lysosome-specific fluorescent dye (see Materials and Methods). The fluorescence image of the bronchial epithelial cell, the CLASS reconstructed image of the lysosomes, and the overlay of two images are provided in Fig. 3C. The overall agreement is very good; however, as expected, there is not always a precise, one-to-one correspondence between organelles appearing in the CLASS image and the fluorescence image because the CLASS image comes from a single, well defined confocal image plane within the cell, whereas the fluorescence image comes from several focal “planes” within the cell, throughout the thicker depth of field produced by the conventional fluorescence microscope. Thus, in the fluorescence image, we observe the superposition of several focal planes and therefore additional organelles above and below those in the single, well defined confocal image plane of the CLASS microscope.
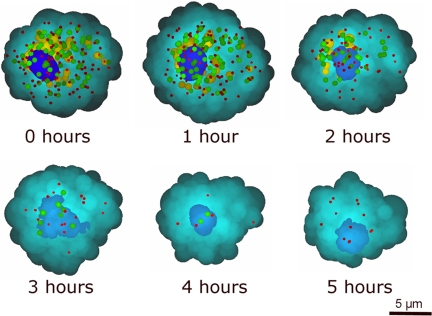
Fig. 4 shows the ability of CLASS to do time sequencing on a single cell. The cell was incubated with DHA for 21 h. The time indicated in each image is the time elapsed after the cell was removed from the incubator. In Fig. 4, the nucleus, which appears as the large blue organelle, has its actual shape and density reconstructed from the CLASS spectra obtained by point-by-point scanning. The remaining individual organelles reconstructed from the CLASS spectra are represented simply as spheroids whose size, elongation, and color indicate different organelles. The small red spheres are peroxisomes, and the intermediate size green spheres are lysosomes. Organelles with sizes in the 1,000-nm to 1,300-nm range, which are mitochondria, are the large yellow spheroids. It can be seen that between times 0 and 1 h, the population of mitochondria begin to disappear. The shape of the nucleus has changed dramatically by the third hour, and the nuclear density, indicated by color depth, has decreased with time. The organelles are almost completely vanished by 4 h.
Fig. 4.
The time sequence of CLASS microscope reconstructed images of a single cell. The cell was treated with DHA and incubated for 21 h. The time indicated in each image is the time elapsed after the cell was removed from the incubator.
Discussion
In this article, we describe an optical method for observing submicrometer intracellular structures in living cells. This method approaches the spatial resolution of EM but is nondestructive and does not require the contrast agents common to optical microscopy. By combining the principles of LSS and confocal microscopy, we produced a prototype instrument, the CLASS microscope. Because CLASS microscopy requires no exogenous labels, thus avoiding their potential interference with cell processes, it is applicable to viable cell and tissue preparations, enabling the observation of cell and organelle functioning at scales on the order of 100 nm. Using the CLASS microscope, we were able to differentiate and monitor functioning cells' individual organelles, such as mitochondria, lysosomes, and microsomes, based on their inherent physical-chemical properties.
Applications for CLASS microscopy in such diverse areas as obstetrics, neuroscience, and drug discovery are all linked by the potential of this technique to observe functional intracellular processes nondestructively.
Human embryo development and quality, as well as response to environmental factors, might be monitored progressively at all critical stages, using CLASS. Because the CLASS measurement is nondestructive and requires no exogenous chemicals, a given embryo in vitro could be monitored over time before implantation. These kinds of progression studies are not possible with the techniques currently available.
Current advances in the molecular and cellular biology of neurodegenerative diseases point toward cell aging and cell death processes. Mitochondrial permeability transitions, with resultant efflux of molecules typically sequestered within the mitochondrial compartment, are implicated in the initiating events of apoptosis (8). In Alzheimer's disease, amyloid-β protein (Aβ) is well known to form β-sheet structures, and insertion of β-sheet proteins into the mitochondrial membrane is predicted to form pores, which may effect this efflux (9, 10). CLASS could provide a means of observing the resultant morphological changes of mitochondria in real time in viable primary tissue cultures of human cell models of Alzheimer's and related neurodegenerative diseases.
An important part of the drug discovery process is to monitor changes in organelle morphology in cells treated with compounds being screened for therapeutic or toxic effects. Currently, imaging using numerous fluorescence markers (11) or EM using nonviable cell preparations (12–14) are being used to detect these changes. However, CLASS could be used to monitor organelle responses in multiple cell lines in parallel, in real time, using viable cells with no exogenous markers. Not only would CLASS enable more rapid screening but it also would provide results more likely to be predictive of animal and, ultimately, human outcomes.
Materials and Methods
CLASS Microscope Design.
The CLASS microscope is capable of collecting both spatial (imaging) and spectroscopic information based on light scattering by submicroscopic biological structures. To test the CLASS microscope, we modified it by adding a wide-field fluorescence microscope arm, which shares a major part of the CLASS microscope optical train. This step is done to ensure that both microscopes have a common field of view.
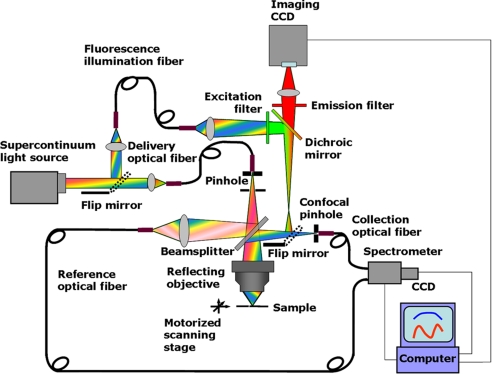
A schematic of the combined CLASS/fluorescence microscope is shown in Fig. 5. The optical train of a CLASS microscope consists of three major systems with a broadband 50/50 beam splitter at their nexus. Above the beam splitter is the light delivery system, below the beam splitter is the sampling/light-scattering system, and to the right of the beam splitter is the light collection and detection system. Two pinholes, positioned in the light delivery and collection paths, are optically conjugate relative to the focal plane of the objective, thus providing confocal optical sampling.
Fig. 5.
Schematic of the prototype CLASS/fluorescence microscope.
System design provides for broadband illumination with either a Xe arc lamp for the measurements performed on extracted organelles in suspension, or a supercontinuum laser (Fianium SC-450-2) the measurements performed on organelles in living cells. The lamp source provides stable, continuous wave operation over a very wide spectral range, whereas the supercontinuum source provides very high brightness, enabling near-real-time acquisition of images.
Light from the broadband source is delivered through an optical fiber (200 μm diameter, N.A. = 0.22) onto a 30-μm pinhole. The delivery fiber is mounted in a fiber positioner, which allows precise alignment of the fiber relative to the pinhole with the aid of an alignment laser. An iris diaphragm positioned beyond the pinhole is used to limit the beam to match the acceptance angle of the reflective objective (≈20 mrad). The light beam from the delivery pinhole is partially transmitted through the beam splitter to the sample and partially reflected to the reference fiber. The sample is mounted on an XYZ motorized translation stage and is imaged by point-by-point scanning. The stage has a 40-nm resolution in each direction.
The reflected light is coupled into the reference fiber by the reference collector lens and delivered to the spectrometer. Thus, the output power and spectrum of light from the source are measured simultaneously with light from the imaged object and used to correct the latter for any variations in the power or spectrum of the source. This approach is especially useful with the supercontinuum laser source.
The transmitted light is delivered through an achromatic reflective objective (N.A. = 0.5, ×36 magnification; Ealing 25-0522) to the sample. Because CLASS is a multiwavelength spectroscopic technique, achromatic components are needed to get good multiwavelength confocal performance and accurate spectroscopic intensity information. We used a reflective objective that is free from chromatic aberration.
Light backscattered from the sample is collected by the same objective and is reflected by the beamsplitter toward the 30-μm collection pinhole. Located between the beamsplitter and the pinhole is a flip mirror that can redirect light from the sample to the imaging lens and the imaging CCD. This arrangement allows us to observe a visual image of the target, similar to a conventional high-resolution microscope.
The collection pinhole blocks most of the light coming from regions above and below the focal plane, allowing only the light scattered from a small focal volume to pass through. The light passing through the pinhole is collected by a second optical fiber (100 μm diameter, N.A. = 0.11) for delivery to an imaging spectrograph (Acton Research SpectraPro 150) with a thermo-electrically cooled detector (Andor Technology DU-434-FI), which is coupled to a computer.
The optical train of the fluorescence microscope consists of the lens that couples supercontinuum laser light, reflected by the flip mirror, with the illumination optical fiber (400 μm diameter, N.A. = 0.22), and another lens that delivers light from the fiber to the excitation filter (Chroma Technology Corp., centered at 540 nm, bandwidth 30 nm). The light reflected by the dichroic mirror and second flip mirror illuminates the sample via the same objective as the CLASS instrument. The reflected fluorescence light then is collected by the objective and directed by the flip mirror and dichroic mirror toward the emission filter (Chroma Technology Corp., centered at 620 nm, bandwidth 65 nm). The portion of the light that passes the emission filter and the imaging lens forms an image on the imaging CCD (Andor Technology, DV855KCS) with a 200-μm total field of view.
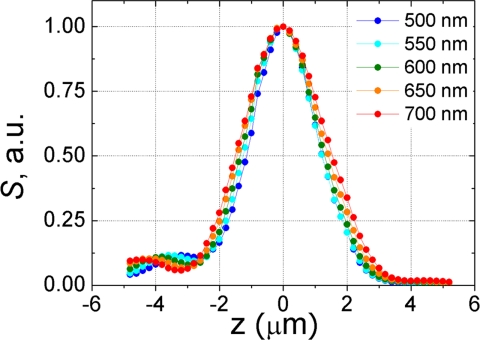
CLASS microscope depth sectioning characteristics were determined by scanning a mirror located near the focal point and aligned normal to the optical axis of the objective by using five different wavelengths spanning the principal spectral range of the instrument (Fig. 6). The half-width of the detected signal is ≈2 μm, which is close to the theoretical value (15–17) for the 30-μm pinhole and ×36 objective used. In addition, the shapes of all five spectra in Fig. 6 (500 nm, 550 nm, 600 nm, 650 nm, and 700 nm) are almost identical, which demonstrates the very good chromatic characteristics of the instrument. Small maxima and minima on either side on the main peak are caused by diffraction from the pinhole. The asymmetry is caused by spherical aberration in the reflective objective (18).
Fig. 6.
Depth sectioning of CLASS microscope along vertical axis at five different wavelengths (500 nm, 550 nm, 600 nm, 650 nm, and 700 nm). The almost identical nature of the spectra demonstrates the very good chromatic characteristics of the instrument.
Microspheres Preparation.
The refractive index of the microspheres can be described by n = 1.5607 + 10,002/λ2 (λ in nanometers) (19). The relative refractive index of the microspheres in water (nr = 1.194 at 600 nm) is substantially higher than that of subcellular organelles in cytoplasm, which is in the range nr = 1.03–1.1 at visible wavelengths (20). Therefore, we also suspended the microspheres in glycerol to decrease the relative refractive index to 1.07–1.1 in the visible range, to better approximate biological conditions, and we used these measurements as a calibration of the technique. The suspensions were prepared so that the optical thickness τ was 0.2, τ = μsz, where μs is the scattering coefficient and z is the distance into the solution. (A photon propagating through a medium with τ = 1 will undergo one scattering event on average.)
Organelle Preparation.
Liver cells from rats were subfractionated by differential and density gradient centrifugation, following a protocol based on the method described in ref. 21. Our purpose, to obtain viable organelles in a state as close as possible to that of organelles in situ, is not the purpose usually sought in this procedure.
Briefly, adult rats were killed by asphyxiation, under an institutionally approved protocol. The liver was minced with scissors, suspended in 0.25 M sucrose, and homogenized in a Dounce homogenizer on ice. The homogenate then underwent stepped differential and density gradient centrifugation procedures to obtain purified fractions enriched in mitochondria, peroxisomes, and microsomes and a “light mitochondrial fraction” composed of mitochondria, peroxisomes, and some lysosomes. Each fraction of viable organelles thus obtained was separated into two specimens, one for CLASS measurements and one for EM. CLASS specimens were used as a suspension in the aqueous glucose solution of the final isolation step. The EM specimens were fixed in 2.5% glutaraldehyde in phosphate buffer, postfixed in cold 1% osmium tetroxide, poststained with alcoholic uranyl acetate, and embedded in fresh Epon araldite. The orientation chosen for sectioning the cell fractions was normal to the gradient that resulted from centrifuging. Thin sections of ≈60–80 nm were prepared and photographed with a Phillips 200 EM at both low and high magnification. In cases where there were particles of varying sizes present, all were photographed.
Apoptotic Cell Preparation.
Live 16HBE14o− human bronchial epithelial cells were cultured in MEM (GIBCO, Grand Island, NY) with 10% FBS, 100 unit/ml penicillin, and 100 μg/ml streptomycin. Cells (50% confluent) were incubated with 100 μM DHA for 24 h to induce apoptosis. Then the cells were detached with trypsin/EDTA, washed in DMEM solution without phenol red, and resuspended in the DMEM/OptiPrep solution. In experiments where staining of lysosomes was performed, lysosome staining dye Lysotracker Red DND-99 was added to the solution.
Reconstruction of the Size Distributions.
The experimentally observed CLASS spectrum is a sum of the CLASS spectra of individual organelles within the focal volume of the instrument. In general, these organelles have different characteristic sizes, aspect ratios, and refractive indices. To extract these organelle properties, we expressed the experimentally measured CLASS spectrum as a linear combination over organelle diameters, aspect ratios, and refractive indices. To calculate the CLASS spectrum of an individual scatterer, we began with the scalar wave model developed by Wiese et al. (22) and Aguilar et al. (23). This model uses the formalism of Mie theory but limits the directions of incident and scattered light by the N.A. of the objective. It provides the amplitude of the detected signal for a single scatterer as a function of wavelength, physical properties of the scatterer, and geometry of a confocal system. The CLASS spectrum, which is the square of the signal amplitude, can be written in matrix form. However, because it is a highly singular matrix and a certain amount of noise is present, it is not feasible to calculate the size distribution by directly inverting the CLASS spectrum matrix. Instead, we use the linear least squares with nonnegativity constraints algorithm with regularization (24) to solve for the size distribution. It is important to emphasize that use of the nonnegativity constraint and the regularization procedure are critical to find the correct distribution. To obtain aspect ratios, we used Waterman's T-matrix approach (25) and the related extended boundary condition based computational method developed by Mishchenko et al. (26). The T-matrix approach can be considered an extension of Mie theory to nonspherical particles and, in the case of spherical particle, all formulas of the T-matrix approach become identical to the corresponding formulas of Mie theory. The algorithm also assumes that there may be more than one particle in the confocal volume and fits the spectra accordingly. Thus, we can accurately reconstruct the size, aspect ratio, and refractive index distributions of scattering particles (microspheres, organelles, etc.) present in the focal volume of the CLASS instrument.
Acknowledgments
This study was supported by National Institutes of Health Grant RR017361, National Science Foundation Grant BES0116833, and the Department of Veterans Affairs, Office of Research and Development.
Abbreviations
- CLASS
confocal light absorption and scattering spectroscopic
- LSS
light-scattering spectroscopy
- TEM
transmission electron microscopy
- DHA
docosahexaenoic acid.
Footnotes
The authors declare no conflict of interest.
References
- 1.Perelman LT, Backman V, Wallace M, Zonios G, Manoharan R, Nusrat A, Shields S, Seiler M, Lima C, Hamano T, et al. Phys Rev Lett. 1998;80:627–630. [Google Scholar]
- 2.Backman V, Wallace MB, Perelman LT, Arendt JT, Gurjar R, Müller MG, Zhang Q, Zonios G, Kline E, McGillican T, et al. Nature. 2000;406:35–36. doi: 10.1038/35017638. [DOI] [PubMed] [Google Scholar]
- 3.Gurjar RS, Backman V, Perelman LT, Georgakoudi I, Badizadegan K, Itzkan I, Dasari RR, Feld MS. Nat Med. 2001;7:1245–1248. doi: 10.1038/nm1101-1245. [DOI] [PubMed] [Google Scholar]
- 4.Perelman LT, Backman V. In: Handbook on Optical Biomedical Diagnostics. Tuchin V, editor. Bellingham: SPIE Press; 2002. pp. 675–724. [Google Scholar]
- 5.Backman V, Gopal V, Kalashnikov M, Badizadegan K, Gurjar R, Wax A, Georgakoudi I, Mueller M, Boone CW, Dasari RR, Feld MS. IEEE J Sel Top Quant Elect. 2001;7:887–894. [Google Scholar]
- 6.Fang H, Ollero M, Vitkin E, Kimerer LM, Cipolloni PB, Zaman MM, Freedman SD, Bigio IJ, Itzkan I, Hanlon EB, Perelman LT. IEEE J Sel Top Quant Eectl. 2003;9:267–276. [Google Scholar]
- 7.Schuele G, Vitkin E, Huie P, Palanker D, Perelman LT. J Biomed Opt. 2005 doi: 10.1117/1.2075207. 10:051404-1-051404-8. [DOI] [PubMed] [Google Scholar]
- 8.Zamzami N, Hirsch T, Dallaporta B, Petit PX, Kroemer G. J Bionenerg Biomembr. 1997;29:185–193. doi: 10.1023/a:1022694131572. [DOI] [PubMed] [Google Scholar]
- 9.Swerdlow RH, Shaharyar MK. Med Hypothesis. 2004;63:8–20. doi: 10.1016/j.mehy.2003.12.045. [DOI] [PubMed] [Google Scholar]
- 10.Dyall SD, Lester DC, Schneider RE, Delgadillo-Correa MG, Plumper E, Martinez A, Koehler CM, Johnson PJ. J Biol Chem. 2003;278:30548–30561. doi: 10.1074/jbc.M304032200. [DOI] [PubMed] [Google Scholar]
- 11.Yarrow JC, Feng Y, Perlman ZE, Kirchhausen T, Mitchison TJ. Comb Chem High Throughput Screen. 2003;6:279–286. doi: 10.2174/138620703106298527. [DOI] [PubMed] [Google Scholar]
- 12.El Mouedden M, Laurent G, Mingeot-Leclercq MP, Tulkens PM. Toxicol Sci. 2000;56:229–239. doi: 10.1093/toxsci/56.1.229. [DOI] [PubMed] [Google Scholar]
- 13.Van Bambeke F, Gerbaux C, Michot JM, d'Yvoire MB, Montenez JP, Tulkens PM. J Antimicrob Chemother. 1998;42:761–767. doi: 10.1093/jac/42.6.761. [DOI] [PubMed] [Google Scholar]
- 14.Carryn S, Chanteux H, Seral C, Mingeot-Leclercq M-P, Van Bambeke F, Tulkens PM. Infec Dis Clinic N Am. 2003;17:615–634. doi: 10.1016/s0891-5520(03)00066-7. [DOI] [PubMed] [Google Scholar]
- 15.Webb RH. Rep Prog Phys. 1996;59:427–471. [Google Scholar]
- 16.Drazic V. J Opt Soc Am A. 1992;9:725–731. [Google Scholar]
- 17.Wilson T, Carlini AR. Opt Lett. 1987;12:227–229. doi: 10.1364/ol.12.000227. [DOI] [PubMed] [Google Scholar]
- 18.Scalettar LT, Swedlow JR, Sedat JW, Agard DA. J Microsc. 1995;182:50–60. doi: 10.1046/j.1365-2818.1996.122402.x. [DOI] [PubMed] [Google Scholar]
- 19.Marx E, Mulholland GW. J Res Natl Bur Stand. 1983;88:321–338. doi: 10.6028/jres.088.016. [DOI] [PMC free article] [PubMed] [Google Scholar]
- 20.Beauvoit B, Kitai T, Chance B. Biophys J. 1994;67:2501–2510. doi: 10.1016/S0006-3495(94)80740-4. [DOI] [PMC free article] [PubMed] [Google Scholar]
- 21.Bonifacino JS, Dasso M, Harford JB, Lippincott-Schwartz J, Yamada KM. Current Protocols in Cell Biology. New York: Wiley; 2001. [Google Scholar]
- 22.Wiese W, Zinin P, Wilson T, Briggs A, Boseck S. Opt Lett. 1996;21:1800–1802. doi: 10.1364/ol.21.001800. [DOI] [PubMed] [Google Scholar]
- 23.Aguilar JF, Lera M, Sheppard SJR. Appl Opt. 2000;39:4621–4627. doi: 10.1364/ao.39.004621. [DOI] [PubMed] [Google Scholar]
- 24.Craig IJD, Brown JC. Inverse Problems in Astronomy: A Guide to Inversion Strategies for Remotely Sensed Data. Bristol, UK: Adam Hilger Ltd; 1986. [Google Scholar]
- 25.Waterman PC. Proc IEEE. 1965;53:805–812. [Google Scholar]
- 26.Mishchenko MI, Travis LD, Mackowski DW. J Quant Spectrosc Radiat Transfer. 1996;55:535–575. [Google Scholar]


