Abstract
Microscopic statistical pressure fluctuations can, in principle, lead to corresponding fluctuations in the shape of a protein energy landscape. To examine this, nanosecond molecular dynamics simulations of lysozyme are performed covering a range of temperatures and pressures. The well known dynamical transition with temperature is found to be pressure-independent, indicating that the effective energy barriers separating conformational substates are not significantly influenced by pressure. In contrast, vibrations within substates stiffen with pressure, due to increased curvature of the local harmonic potential in which the atoms vibrate. The application of pressure is also shown to selectively increase the damping of the anharmonic, low-frequency collective modes in the protein, leaving the more local modes relatively unaffected. The critical damping frequency, i.e., the frequency at which energy is most efficiently dissipated, increases linearly with pressure. The results suggest that an invariant description of protein energy landscapes should be subsumed by a fluctuating picture and that this may have repercussions in, for example, mechanisms of energy dissipation accompanying functional, structural, and chemical relaxation.
Keywords: critical damping, dynamical transition, energy dissipation, harmonic–anharmonic motions
A fundamental concept in protein biophysics is that of an energy landscape. Originally introduced to explain the temperature dependence of the rebinding kinetics of ligands to myoglobin (1, 2), over time the energy landscape picture has been successfully used to describe such diverse phenomena as the temperature-induced dynamical transition, protein folding, and enzyme function (3–5).
Valuable information on the physics of protein energy landscapes has been obtained through study of the temperature dependence of protein structure and dynamics (6). However, it is only recently that the experimental tools have become available to investigate the effect of pressure on the structure and dynamics of biomolecules (7, 8). Whereas temperature variations influence both the thermal energy and, due to thermal expansivity, the volume of a system, a pressure perturbation affects only the system volume, via the isothermal compressibility. For proteins, for example, pressure changes of a few kbar give rise to changes in free energy that are similar to the free-energy difference between the native and unfolded state (8).
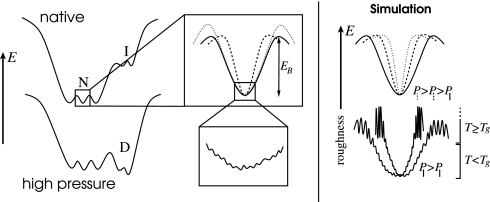
In Fig. 1, a schematic diagram of a protein energy landscape is shown. The region of minimal free energy, which accomodates the ensemble of native or folded states, is surrounded by regions of high free energy, where the protein is partly or wholly unfolded. Local minima in the energy landscape may give rise to functional or folding intermediate states. In contrast to temperature variations, the application of pressure alters the structure of the energy landscape and may, for example, result in nonnative configurations competing with the ensemble of lowest free-energy states, thus leading to pressure-induced structural changes or unfolding. In this contribution, however, the focus is on pressure-induced changes in the native-state region of the energy landscape.
Fig. 1.
Schematic illustration of the protein energy landscape. (Left) Native and high-pressure conditions. N, I, and D represent ensembles of native, intermediate, and pressure-denatured states, respectively. (Upper Center) The application of pressure may change the local curvature of the energy landscape (dashed line), alter the height of energy barriers between substates (dotted line), or both. (Lower Center) Dissipative forces of the environment can be depicted as roughness of the energy landscape and may also be pressure dependent. (Right) Schematic illustration of the simulation results. (Upper Right) Application of pressure increases curvature of local potential wells without changing barriers between them. (Lower Right) Below the dynamical transition temperature the damping is relatively unaffected by pressure, whereas above Tg the application of pressure strongly increases frictional effects.
On a microscopic length scale, i.e., the length scale of a single protein molecule, pressure is not constant but fluctuates with amplitudes in the kbar-range around the macroscopic mean value. These fluctuations give rise to instantaneous changes in the energy landscape topology on the characteristic time scale τF = d/vs, where d is the molecular diameter and vs the velocity of sound; for small globular proteins in solution, realistic values are in the order of d ≈ 1 nm and vs ≈ 103 m s−1, hence τF ≈ 1 ps. Motions on this time scale are important for overall protein flexibility and, thus, may also be of relevance for functional dynamics.
In this contribution, the pressure-induced changes in the native-state region of the energy landscape of the protein hen egg white lysozyme (HEWL) in solution are investigated by using molecular dynamics (MD) simulations in the pressure and temperature ranges from 0.1 to 1,000 MPa and from 20 to 320 K, respectively. HEWL has been shown to readily and reversibly denature above 350 MPa on the time scale of minutes (9). However, here the focus is on changes upon pressurization in the local curvature of, and barrier heights separating substates in the energy landscape of the native ensemble, as is illustrated in Fig. 1. Furthermore, the pressure-temperature dependence of dissipative forces acting on collective modes of protein motion are analyzed. The results suggest that the traditional, static view of a protein energy landscape should be subsumed by a fluctuating picture, and that this can potentially have functional consequences.
Results and Discussion
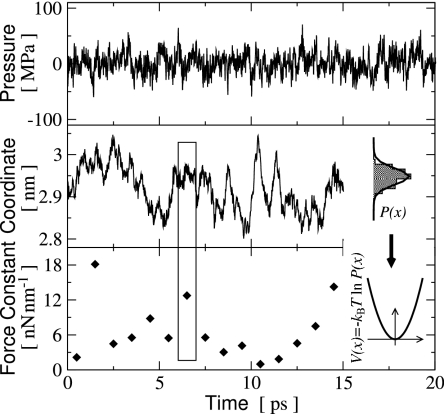
In Fig. 2, we show representative examples of picosecond fluctuations in pressure and atomic coordinates observed during the MD simulations. The pressure of the whole simulation-box rapidly fluctuates with an amplitude of ≈50 MPa around the reference value. The fluctuations in atomic position involve fast components on the subpicosecond time scale, which resemble vibrations in the underlying approximately harmonic potential, and slower components on the picosecond (or longer) time scale, which are due to variations in the position and force constant of that potential. Fig. 2 also illustrates how the underlying potential and force constant can be determined from the fluctuations in atomic position. The variation of the force constant on the picosecond time scale is also shown.
Fig. 2.
Examples of picosecond fluctuations in the simulation-box pressure (Top), a single atomic cartesian coordinate (Middle), and its associated force constant (Bottom) at 300 K and 0.1 MPa. The calculation of the one-dimensional force constant, k is illustrated for a 1-ps interval indicated by the rectangle: the probability distribution P(x) is fitted by a Gaussian, which readily yields the effective potential V(x), and comparison with V(x) = kx2/2 yields k = kBT/σ2, where σ2 is the variance of P(x).
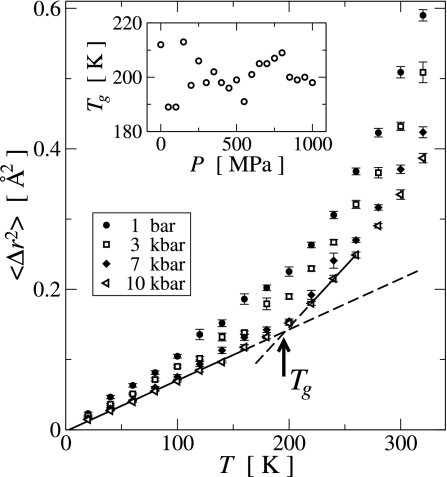
A measure for the overall motion present in a protein molecule is provided by the time-dependent atomic mean-square displacement (MSD), , where rk(t) is the coordinate vector of atom k at time t, and 〈·〉 and ·̄ are the time and ensemble averages, respectively. 〈Δr2〉T,P(τ) can readily be calculated from the MD trajectories, rT,P(t). In Fig. 3, the temperature dependence of the hydrogen 〈Δr2〉 is shown for τ = 1 ps. Hydrogen atoms were chosen here due to their large and evenly distributed abundance in the protein, to avoid mass-weighting, and because the hydrogen 〈Δr2〉 can be directly measured in neutron scattering experiments. Similar results were obtained when all atoms are included in the analysis (data not shown). For all pressure values, 〈Δr2〉P(T) is linear for T < Tg ≈ 200 K and increases nonlinearly at a higher rate for T > Tg. This phenomenon is widely known as the protein dynamical (or glass) transition and is due the solvent-driven activation of anharmonic dynamics with increasing temperature above Tg (4, 10, 11). For temperatures below Tg the energy landscape explored by the system is effectively harmonic. Tg is related to the depth of this harmonic potential well by kBTg ∝ EB, where EB represents the effective energy barrier indicated in Fig. 1. Fig. 3 Inset shows that, although Tg fluctuates with pressure, there is no systematic pressure dependence and Tg(P) is effectively constant. Hence, the effective energy barriers EB separating the harmonic substates are independent of pressure.
Fig. 3.
Temperature dependence of the hydrogen mean-square displacements during a time interval τ = 1 ps for selected pressure values. (Inset) The pressure dependence of the transition temperature Tg, calculated as the intersection between two linear fits to 〈Δr2〉P(T) in the ranges T ≤ 160 K and 220 K ≤ T ≤ 260 K, respectively, as illustrated for the 1,000 MPa data by the solid (fit region) and dashed (continuation outside fit region) lines.
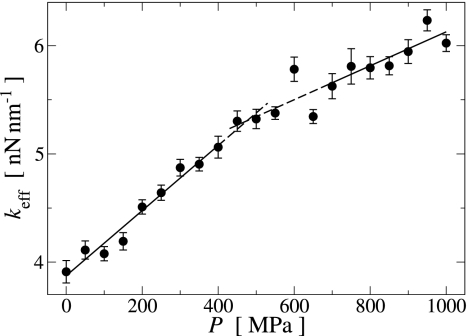
From the slope of 〈Δr2〉P(T) in the linear regime (T ≤ 160 K) the effective force constant of the underlying harmonic potential can be derived by using keff(P) = 6kB/(d〈Δr2〉P/dT) (12). The results are shown in Fig. 4. keff(P) increases with increasing pressure corresponding to an overall stiffening of the protein. The slope of keff(P) is approximately linear in two distinct ranges of P, being 3.0 ± 0.2 pN/nm MPa and 1.6 ± 0.4 pN/nm MPa for P ≤ 400 MPa and P ≥ 700 MPa, respectively, with a transition around P* ≈ 480 MPa, indicating a qualitative change in the pressure response of the protein energy landscape.
Fig. 4.
Pressure dependence of the effective environmental force constant keff for dynamics on the τ = 1 ps time scale derived by using linear fits to 〈Δr2〉P(T) in the harmonic regime (T ≤ 160 K), as illustrated in Fig. 3. The solid and dashed lines are linear fits in the ranges P ≤ 400 MPa and P ≥ 700: MPa.
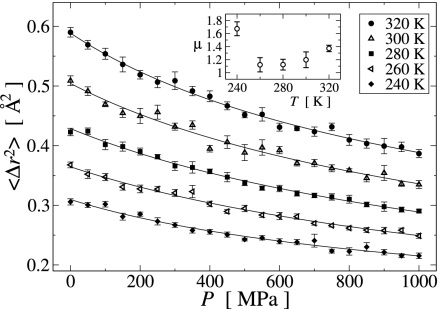
The transition pressure P* is closely similar to the value of 400 MPa found previously for the pressure-induced dynamical transition in the atomic MSD for a crystalline protein, Staphylococcal nuclease (SNase) (13), between two approximately linear regions of 〈Δr2〉300K(P), with d〈Δr2〉(P)/dP|P<P* > d〈Δr2〉(P)/dP|P>P*. To investigate whether a similar transition occurs in the present system of HEWL in solution, 〈Δr2〉T is plotted against pressure in Fig. 5. For all temperatures, 〈Δr2〉T(P) significantly decreases with increasing pressure but with the slope being nonlinear over the whole pressure range. Assuming this decrease in mobility with increasing P being due to the reduction in accessible volume, 〈Δr2〉/〈Δr02〉 = (V/V0)2/3, and using the relations β = −(∂(lnV)/∂P) and μ = ∂β−1/∂P, where β is the compressibility and μ is the nonlinearity index, yields
 |
where c1,2 are integration constants. For lysozyme in solution the pressure dependence of 〈Δr2〉T(P) can be well described by using Eq. 1, as shown in Fig. 5. The fit results for μ are also shown in Fig. 5 and vary between 1.1 and 1.7. Experimental μ values for proteins range from 7 to 12 (14), and for an ideal harmonic system μ = 1 (15). This result indicates that lysozyme in the present MD simulations only partially relaxed at high pressure, but was rather elastically compressed and thus remained close to the native conformation.
Fig. 5.
Pressure dependence of the hydrogen mean-square displacements during a time interval τ = 1 ps for temperatures well above the dynamical transition temperature. Solid lines represent least-squares fits of Eq. 1, described in the text, and the fit results for the nonlinearity index μ are shown in Inset.
The above analysis investigated the dynamics of individual atoms, averaged over the whole ensemble present in the protein, thus providing a mean-field measure for the local (cartesian real-space) energy landscape explored by a single atom. The curvature of this local energy landscape was found to increase with increasing pressure, whereas the effective barrier height separating substates remains unchanged. These results are pictorially described in Fig. 1 Upper Right.
In the following, the energy landscape is further examined but with the focus redirected from the above mean-field description to the characterization of collective dynamics. Collective coordinates were determined by using principal component (PC) analysis of the full MD trajectories. Apart from ≈10 modes at T > Tg, all PC modes were found to be approximately harmonic. Thus, Brownian dynamics in a harmonic potential was used to model the collective dynamics and, in particular, to determine the eigen and damping frequencies of each PC mode. Results for anharmonic and/or undersampled lowest-frequency modes (≈5–20 modes for each trajectory) were excluded in the following analysis. However, it is important to note that, due to the superposition of PC modes (while sampling mode m, the trajectory simultaneously samples all other modes), the effect of anharmonic (and also solvent) dynamics is implicitly included in all mode variables, i.e., in the time series of the projection σm(t). In the Brownian description, Eq. 2, this effect is mediated by the random force, ξ.
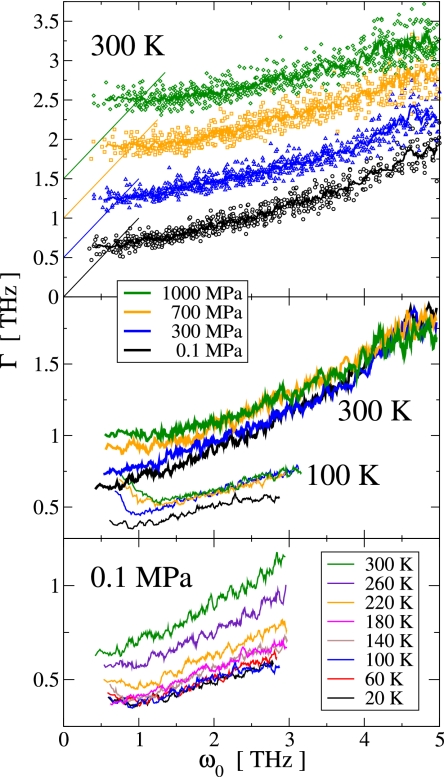
In Fig. 6, we show the damping frequencies, Γ plotted against the eigenfrequencies, ω0 of the PC modes for selected pressure and temperature values. In general, the lowest-frequency PC modes are those with the largest amplitude. Fig. 6 Top shows the distribution of ΓP(ω0) for individual modes at 300 K. At all pressure values the distribution of damping frequencies has a spread of ≈0.3 THz (at given ω0) and the average Γ increases with increasing ω0. For the lowest-frequency modes Γ > ω0 and, therefore, the motion along these modes is overdamped. Γ = ω0 is critical damping. Critical damping establishes the fastest process for dissipating the energy contained in an oscillator and, therefore, the determination of the critical damping frequency Γc is of possible functional interest.
Fig. 6.
Eigen and damping frequencies ω0 and Γ, respectively, of the low-frequency principal component modes for selected pressure and temperature values. (Top) Symbols show {ω0, Γ} for individual modes and thick solid lines represent running averages. For clarity, data sets for different pressure values are vertically offset by 0.5 THz. The thin solid lines indicate critical damping, Γ = ω0. (Middle) Comparison of the damping frequencies at 300 K (thick solid lines) and 100 K (thin solid lines) for the same pressure values as in Top. (Bottom) Comparison of the damping frequencies at 0.1 MPa and various temperatures.
At 300 K, the application of pressure gives rise to an increase of Γ at any given eigenfrequency for modes in the range ω0 ≲ 3 THz, leading to a pressure-induced increase in the critical damping frequency, from 0.66 THz at 0.1 MPa to 1.0 THz at 1,000 MPa. The damping frequencies of PC modes with ω0 ≳ 3 THz show no significant dependence on pressure, indicating that the dynamics of the largest-amplitude modes, i.e., those modes with the lowest eigenfrequencies, is more strongly affected by pressure than the more localized modes with higher frequencies.
The temperature dependence of Γ(ω0) is shown for P = 0.1 MPa in Fig. 6 Bottom. In the regime of harmonic protein dynamics, i.e., for T < Tg, Γ(ω0) shows little temperature dependence. However, in the presence of anharmonic dynamics, i.e., for T ≳ Tg, Γ(ω0) significantly increases with increasing temperature. This suggests the existence of two distinct damping regimes: one that is associated with the dynamics within harmonic substates, and one of relatively larger strength that is associated with anharmonic and/or diffusive motions. This finding is pictorially described in Fig. 1 Lower Right, where an increased amplitude in the energy landscape roughness symbolizes relatively stronger damping.
Fig. 6 Middle shows a comparison of ΓP(ω0) for two temperatures, 100 K and 300 K. For PC modes with ω0 ≳ 1 THz, the main effect of the lower temperature is to reduce the damping frequency at any given ω0 by ≈0.4 THz. This is in accord with the above finding. However, for the lowest-frequency (ω0 ≲ 0.5 THz) modes, the temperature-induced change in Γ is smaller. Because these modes describe collective displacements distributed over the whole protein, damping of these modes may be of particular importance. At temperatures below Tg, the surrounding solvent acts as a cage for protein dynamics (on the ns/ps time scale) that may provide a strong damping mechanism additional to protein-internal damping. With increasing frequency, the PC modes become more localized and, thus, the relative importance of protein/solvent interactions is reduced and protein-internal damping mechanisms become more dominant. This hypothesis is supported by the observation that, at 100 K, Γ(ω0) initially decreases with increasing ω0, as is also shown in Fig. 6. For T > Tg, with increasing temperature, this initial decrease in Γ(ω0) becomes smaller and vanishes at ≈260 K, as can be seen for P = 0.1 MPa in Fig. 6 Bottom.
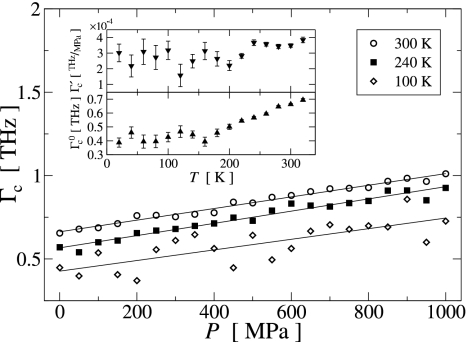
The pressure and temperature dependence of Γ(ω) of the low-frequency PC modes also determines the critical damping frequency, Γc(P,T). Γc(P,T) was determined for all temperatures and pressures as the intersection of the Γ = ω0 line with a linear (T ≥ 260 K) or quadratic (T ≤ 240 K) fit to Γ(ω0) for ω0 ≤ 1.5 THz. The results are shown in Fig. 7. At constant temperature, Γc(P) increases approximately linearly with increasing pressure. Because Γ(ω) is a slowly varying monotonic function for ω ≲ 1 THz, Γc ∝ P is equivalent to an approximately linear increase with pressure of Γ, which can also be seen in Fig. 6 Top and Middle. For T ≤ 220 K and T ≥ 240 K, the slope Γ′c of Γc(P) is almost independent of temperature, the averages being (2.7 ± 0.1)10−4 THz MPa−1 and (3.56 ± 0.06)10−4 THz MPa−1, respectively. This difference in slope can be related to the two damping regimes found above, which are associated with the harmonic and anharmonic dynamics below and above Tg, respectively.
Fig. 7.
Pressure dependence of the critical damping frequency Γc for selected temperatures. Symbols represent data points, and the solid lines are linear fits. The temperature dependence of the slope Γ′c and intercept Γc0 of each linear fit to Γc(P) are presented in Upper and Lower Insets, respectively.
The critical damping frequency at ambient pressure (i.e., at 0.1 MPa), Γc0, was also determined from the linear fits to Γc(P). For T ≲ 160 K, Γc0(T) fluctuates around a constant value of ≈0.43 ± 0.01 THz, whereas for T ≳ 180 K Γc0(T) increases linearly with increasing temperature. Again, this finding is consistent with the above observation that the damping is independent of temperature in the harmonic substates. However, when the temperature increases to or above Tg, the trajectories cumulatively sample more anharmonic regions of the energy landscape, in which Γ is larger and thus Γc increases.
Conclusions
Understanding the topology of and the dynamics on protein energy landscapes furnishes insight into the physical mechanisms governing protein folding and function. Here, the variation of pressure and temperature in MD simulations of lysozyme has revealed a pressure-induced increase in the curvature of the harmonic substates lining the ensemble of native states. The effective force constant associated with this curvature initially increases linearly with increasing pressure, but at ≈480 MPa exhibits a 2-fold reduction in slope, indicating the presence of two pressure–response mechanisms. Because the application of pressure in the 100 MPa range does not significantly change the lengths of chemical bonds, both mechanisms are likely to originate from interactions governed by van der Waals forces. The question arises as to whether these mechanisms describe the different pressure responses of the protein and the solvent, or whether both can be attributed to either the protein or the solvent. For example, the application of pressure significantly decreases the tetrahedrality of the water structure (16). Because the protein dynamics is slaved to the solvent fluctuations (17), the comparatively more rigid tetrahedral water structure at lower pressure may then cause a stiffer protein response to pressure changes than the less rigid van der Waals liquid-like water structure at higher pressure.
Protein relaxation accompanying functional processes such as folding, ligand binding or chemical reaction often requires the dissipation of kinetic and/or potential energy contained within collective degrees of freedom (modes). This dissipation is fastest for modes that are critically damped and, because of the equipartition of energy among all modes and mode coupling (18), these modes contribute disproportionately high to energy dissipation and thus relaxation. Accordingly, the critical damping frequencies for collective modes of protein motions were determined. Γc(P) is found to depend approximately linearly on pressure indicating that the pressure dependence is governed by a single physical mechanism. In contrast, the temperature dependence of Γc(T) reveals the existence of two damping mechanisms with a transition temperature close to the protein dynamical transition. One temperature-independent mechanism (present at all T) is associated with the motions within harmonic substates. The other mechanism (present for T ≳ Tg) originates from anharmonic and/or diffusive dynamics connecting the harmonic substates and its contribution increases with increasing temperature.
Finally, the above results suggest that an invariant description of the protein energy landscape is incomplete on the picosecond time scale. Fluctuations in volume, and thus in pressure, are inevitably present on the molecular length scale and lead to variations in both the topology and the dissipation characteristics of the energy landscape. For globular proteins (with an average size on the nanometer length scale), these fluctuations occur on the picosecond time scale, which is the predominant time scale for global vibrations (19). Therefore, pressure-fluctuation induced variations in the protein energy landscape may be important for substate alterations of functional relevance and may expedite relaxation processes by broadening the range of the most effective, i.e., critical, damping.
Methods
Molecular Dynamics.
MD simulations were performed of hen egg white lysozyme over the temperature and pressure ranges 20–320 K (every 20 K) and 0.1–1,000 MPa (every 50 MPa). The initial structure 1GXV (20) (solved at atmospheric pressure using NMR) was taken from the Protein Data Bank (21) and centered in the rhombic-dodecahedron primary simulation cell with initial box length of 70 Å. A total of 7,309 TIP4P water molecules (22), 15 sodium ions, and 24 chloride ions were added as a 0.1 M salinity solvent, resulting in an electrically neutral system comprising 31,236 atoms.
MD simulations were performed by using the Gromacs suite of programs (23, 24) with the all-atom OPLS-AA/L force field (25) and periodic boundary conditions. The OPLS force field was parameterized in conjunction with the TIP4P potential, which reproduces the anomalous diffusion coefficient of water in the present temperature and pressure ranges (16). Electrostatic interactions were computed by using the particle mesh Ewald method (26) with the direct-sum cutoff and Fourier grid spacing being 9 and 1.2 Å, respectively, and van der Waals interactions were cut off at 14 Å.
The system was energy minimized to a root-mean-square (RMS) force gradient of 1.6 × 10⁻² kJ mol−1Å−1, subsequently heated during 100 ps and then pressurized and equilibrated during 600 ps. Temperature and pressure coupling were enforced by using the extended-ensemble Nosé–Hoover/Parrinello–Rahman algorithms (27–30) with a coupling time constant of 1 ps. The production phase at each temperature–pressure value was 1 ns long. Coordinates were saved with a sampling interval of 0.1 ps used in all subsequent analyses. For all simulations, the trajectory-average protein Cα-atom RMS-deviation from the experimental structure was <1.7 Å, indicating that the protein structure remained close to the native state in all simulations. Also, the comparison with an additional 10 ns trajectory (at T = 300 K, P = 0.1 MPa) showed that the 1-ns sampling of the native state is sufficient for the atomic RMS displacements to converge within 5% of the average value obtained during the 10-ns trajectory.
Eigen and Damping Frequencies of Protein Collective Motions.
Collective protein motions present in each trajectory rT,P(t) were determined by using principal component (PC) analysis as described in ref. 31, i.e., by diagonalizing the all-protein-atom mass-weighted variance–covariance matrix yielding the eigenvectors vm. The dynamics along the mth PC mode were investigated by analyzing the time series of the projection, σm(t) = (M1/2[rT, P(t) − rT, Pave]) · vm, where M is the diagonal mass matrix and rT, Pave denotes the average structure. The effective free-energy landscape along the mode is given by Gm(σ) = −kBT ln pσm, where kB is the Boltzmann constant and pσmdσ is the probability of σm(t) ∈ [σ,σ + dσ). If the motion is harmonic, then Gm(σ) is also harmonic and the probability density pσm is Gaussian. Anharmonic and/or quasiharmonic modes were found for T ≳ 200 K at all pressure values as has been reported for other systems (11, 13).
The projection σm(t) can be rationalized as a stochastic process sampling the underlying potential. Therefore, if Gm(σ) is approximately harmonic, σm(t) can be described as Brownian motion in a harmonic potential using the set of Langevin equations
where Γ is the damping frequency, ω0 is the eigenfrequency, and ξ(t) is a random force that represent the effect of environmental degrees of freedom, i.e., ξm(t) implicitly represents the effect on σm(t) of the solvent dynamics but also of σm′≠m(t). In equilibrium, ξ and Γ are related by the fluctuation–dissipation theorem, 〈ξ(t)ξ(t′)〉 = 4ΓkBT δ(t − t′), where δ(t) is the Dirac Delta function.
The power spectral density (PSD) Sυυ(ω) can be calculated analytically (32)
with , and can be compared with the PSD Sσσ = ω−2Sυυ obtained from the simulation. Sσσ was computed from σm(t) by using a fast Fourier transform and subsequently the analytical Sυυ was least-squares fitted to the simulation-derived ω2Sσσ to determine the parameters ω0 and Γ (31, 33, 34).
Acknowledgments
This work was supported by the Physical Biology Center for Ultrafast Science and Technology. L.M. acknowledges support from a Deutsche Physikalische Gesellschaft/Deutsche Forschungsgemeinschaft fellowship to visit Japan before joining the group at The California Institute of Technology.
Footnotes
The authors declare no conflict of interest.
References
- 1.Austin RH, Beeson KW, Eisenstein L, Frauenfelder H, Gunsalus I C. Biochemistry. 1975;14:5355–5373. doi: 10.1021/bi00695a021. [DOI] [PubMed] [Google Scholar]
- 2.Frauenfelder H, Petsko GA, Tsernoglou D. Nature. 1979;280:558–563. doi: 10.1038/280558a0. [DOI] [PubMed] [Google Scholar]
- 3.Onuchic JN, Wolynes PG. Curr Opin Struct Biol. 2004;14:70–75. doi: 10.1016/j.sbi.2004.01.009. [DOI] [PubMed] [Google Scholar]
- 4.Doster W, Cusack S, Petry W. Nature. 1989;337:754–756. doi: 10.1038/337754a0. [DOI] [PubMed] [Google Scholar]
- 5.Kumar S, Ma B, Tsai CJ, Sinha N, Nussinov R. Protein Sci. 2000;9:10–19. doi: 10.1110/ps.9.1.10. [DOI] [PMC free article] [PubMed] [Google Scholar]
- 6.Parak FG. Rep Prog Phys. 2003;66:103–129. [Google Scholar]
- 7.Kamatari YO, Kitahara R, Yamada H, Yokoyama S, Akasaka K. Methods. 2004;34:133–143. doi: 10.1016/j.ymeth.2004.03.010. [DOI] [PubMed] [Google Scholar]
- 8.Gruner SM. In: High-Pressure Crystallography. Katrusiak A, McMillan P, editors. The Netherlands: Kluwer Academic, Dordrecht; 2004. pp. 543–556. [Google Scholar]
- 9.Nash DP, Jonas J. Biochemistry. 1997;36:14375–14383. doi: 10.1021/bi970881v. [DOI] [PubMed] [Google Scholar]
- 10.Tournier AL, Xu J, Smith JC. Biophys J. 2003;85:1871–1875. doi: 10.1016/S0006-3495(03)74614-1. [DOI] [PMC free article] [PubMed] [Google Scholar]
- 11.Tournier AL, Smith JC. Phys Rev Lett. 2003;91:208106. doi: 10.1103/PhysRevLett.91.208106. [DOI] [PubMed] [Google Scholar]
- 12.Zaccaï G. Science. 2000;288:1604–1607. doi: 10.1126/science.288.5471.1604. [DOI] [PubMed] [Google Scholar]
- 13.Meinhold L, Smith JC. Phys Rev E. 2005;72:061908. doi: 10.1103/PhysRevE.72.061908. [DOI] [PubMed] [Google Scholar]
- 14.Kharakoz DP. Biophys J. 2000;79:511–525. doi: 10.1016/S0006-3495(00)76313-2. [DOI] [PMC free article] [PubMed] [Google Scholar]
- 15.Moelwyn-Hughes EA. Physical Chemistry. London: Pergamon; 1961. [Google Scholar]
- 16.Reddy MR, Berkowitz M. J Chem Phys. 1987;87:6682–6686. [Google Scholar]
- 17.Fenimore PW, Frauenfelder H, McMahon BH, Parak FG. Proc Natl Acad Sci USA. 2002;99:16047–16051. doi: 10.1073/pnas.212637899. [DOI] [PMC free article] [PubMed] [Google Scholar]
- 18.Moritsugu K, Miyashita O, Kidera A. Phys Rev Lett. 2000;85:3970–3973. doi: 10.1103/PhysRevLett.85.3970. [DOI] [PubMed] [Google Scholar]
- 19.Balog E, Becker T, Oettl M, Lechner R, Daniel R, Finney JL, Smith JC. Phys Rev Lett. 2004;93:028103. doi: 10.1103/PhysRevLett.93.028103. [DOI] [PubMed] [Google Scholar]
- 20.Refaee M, Tezuka T, Akasaka K, Williamson MP. J Mol Biol. 2003;327:857–865. doi: 10.1016/s0022-2836(03)00209-2. [DOI] [PubMed] [Google Scholar]
- 21.Berman HM, Westbrook J, Feng Z, Gilliland G, Bhat TN, Weissig H, Shindyalov IN, Bourne PE. Nucleic Acids Res. 2000;28:235–242. doi: 10.1093/nar/28.1.235. [DOI] [PMC free article] [PubMed] [Google Scholar]
- 22.Jorgensen WL, Chandrasekhar J, Madura JD, Impey RW, Klein ML. J Chem Phys. 1983;79:926–935. [Google Scholar]
- 23.Berendsen HJC, van derSpoel D, vanDrunen R. Comp Phys Comm. 1995;91:43–56. [Google Scholar]
- 24.Lindahl E, Hess B, van derSpoel D. J Mol Mod. 2001;7:306–317. [Google Scholar]
- 25.Kaminski GA, Friesner RA, Tirado-Rives J, Jorgensen WL. J Phys Chem B. 2001;105:6474–6487. [Google Scholar]
- 26.Essmann U, Perera L, Berkowitz ML, Darden T, Lee H, Pedersen LG. J Chem Phys. 1995;103:8577–8593. [Google Scholar]
- 27.Nosé S. Mol Phys. 1984;52:255–268. [Google Scholar]
- 28.Hoover WG. Phys Rev A. 1985;31:1695–1697. doi: 10.1103/physreva.31.1695. [DOI] [PubMed] [Google Scholar]
- 29.Parrinello M, Rahman A. J Appl Phys. 1981;52:7182–7190. [Google Scholar]
- 30.Nosé S, Klein ML. Mol Phys. 1983;50:1055–1076. [Google Scholar]
- 31.Meinhold L, Smith JC. Proteins. 2007;66:941–953. doi: 10.1002/prot.21246. [DOI] [PubMed] [Google Scholar]
- 32.Reichl LE. A Modern Course in Statistical Physics. New York: Wiley-Interscience; 1998. [Google Scholar]
- 33.Kitao A, Hirata F, Gō N. Chem Phys. 1991;158:447–472. [Google Scholar]
- 34.Hayward S, Kitao A, Hirata F, Gō N. J Mol Biol. 1993;234:1207–1217. doi: 10.1006/jmbi.1993.1671. [DOI] [PubMed] [Google Scholar]


